


Pivot points are a popular technical analysis tool used by traders to identify potential turning points in the market. These key price levels are calculated using the previous sessions high, low, and close, and provide traders with projected areas of support and resistance. The central premise of Pivot Points is that if the future is like the most recent past, the pivot point and its support and resistance level is an effective means of defining normal price action.
Pivot points have been at the core of successful trading strategies for over a century, and it all started with one of the most iconic traders in history, Jesse Livermore. Livermore, a market legend of the early 20th century, built his strategy around what he called the “pivotal point.” He discovered that when stocks hit certain key price levels, they would often make major, decisive moves. By zeroing in on these pivotal points, Livermore was able to time his trades to perfection, riding massive market swings. His mastery of this approach didn’t just make him a fortune—it proved the undeniable importance of identifying these critical price levels in trading.
Fast forward to the 1950s and 60s, and we see Nicholas Darvas, a professional dancer who turned his eyes toward Wall Street, developing his own version of this strategy. Darvas produced the “Darvas Box” theory, which also focused on key price levels. He noticed that stocks tended to move within a set range, or what he called a “box.” When a stock broke out of that range, it was a signal of a significant price movement, a breakout level that worked much like Livermore’s pivotal point. It was the perfect time to buy. Both Livermore and Darvas—though decades apart and from vastly different walks of life—proved one thing: understanding these key price levels is vital for traders who want to get ahead of the market.
The pivot point is, at its core, a straightforward calculation: an average of the high, low, and closing prices from the prior period. Yet, this seemingly simple figure carries significant weight for traders. In the trading session that follows, movement above the pivot point is often interpreted as a signal of bullish momentum, suggesting optimism in the market. Conversely, when prices drop below the pivot point, it tends to reflect a shift toward bearish sentiment, hinting at a potential downturn. This dynamic makes the pivot point a critical tool for those trying to navigate and anticipate market trends.

The central pivot point acts as a baseline, while additional levels—commonly referred to as R1 – Resistance 1, R2 – Resistance 2, and R3 – Resistance 3 and S1 Support 1, S2 – Support 2, and S3 – Support 3 offer potential price targets. Pivot points are particularly favored by day traders and swing traders for their ability to offer clear, predefined price levels to guide decision-making.
- In an uptrend, prices consistently close above the pivot point.
- In a downtrend, prices consistently close below the pivot point.
In this article I will discuss how traders use pivots to improve their decision making and better understand price action.
Originally crafted by floor traders on the stock exchange, pivot points were a straightforward yet powerful tool. Using the previous sessions high, low, and close, they calculated a pivot point that would set the stage for the current trading session. But over time, the use of pivot points has evolved. Today, traders apply them not just daily but across weekly, monthly, and even quarterly and annual timeframes, offering a broader view of “normal” price action and a more strategic long-term perspective.
The beauty of pivot points lies in their simplicity and their ability to signal key levels throughout the session. These are considered leading indicators, giving traders an edge in anticipating market moves before they happen. The main pivot point itself is the most critical level—a line in the sand between bullish and bearish forces. Prices above the pivot point? The market is leaning bullish. Below it? That’s a signal of potential bearish pressure. For bulls, the aim is to buy near the pivot point, and for bears, the objective is to short as close to that line as possible.
What started as a tool for floor traders has now become a go-to for retail traders in markets ranging from equities to futures, crypto, and forex. It’s simple, reliable, and continues to help traders across the globe navigate today’s fast-moving markets with confidence.
Let me elaborate on this point by looking at PIVOT POINTS for Bitcoin on a multi-timeframe analysis. I will create a simple grid where the pivot point will be clearly defined for the daily, weekly, monthly, quarterly and annual time frames. If the grid is green, it will communicate that the current price has been above the market price. If the grid is red, it is communicating that the current price is below the pivot point. The purpose of this simple analysis is threefold:
- Define the PIVOT POINT on multiple time frames.
- Show whether price action is positive or negative according to the pivot point calculation.
- Isolate what price needs to do to change the trend.
The first step is simply gathering the HIGH, LOW and CLOSE values for each time frame. Then add them all together and divide by 3. The number in each grid below is the PIVOT point for that time frame.
As I write these words Bitcoin is trading at $56,700.

So, in studying these values we can quickly and clearly see that the trend on Bitcoin is only bullish on the annual time frame. On all other time frames the current bitcoin price is below the pivot point which highlights the magnitude of the downtrend and more importantly the boundary that bitcoin would have to cross to objectively change the current trend on each time frame. This is commonsense analysis at its finest.
When we talk about support and resistance levels in trading, we’re talking about two important prices that can tell us whether an asset is more likely to go up or down.
Now, to figure out the first levels of support and resistance, we use a basic formula. Let’s start with resistance, which is the price where a stock might struggle to go higher.
Here’s how you calculate the first resistance level, or R1:

What does that mean? You take the pivot point, multiply it by two, and then subtract the lowest price from the previous session. That gives you a price where the stock might start to slow down. However, if the stock were to close above this resistance point it is considered objective proof that price is breaking out from its previous range.
On the other side, we have support, which is the price where a stock is expected to stop falling and start going back up. However, if the stock were to close below the support point it is considered to be in a firm downtrend that has broken into a new range.
Here’s how we calculate the first support level, or S1:

This time, you take the pivot point, multiply it by two again, but now subtract the highest price from the previous session. This value tells you where the stock is expected to hit a “floor” and bounce back up.
With these three values, the pivot point, 1st Support and 1st resistance you have the broad valuation levels for the time frame being analyzed.
Let me share some longer-term charts on a quarterly basis that highlight the value of these “boxes” and value grids.
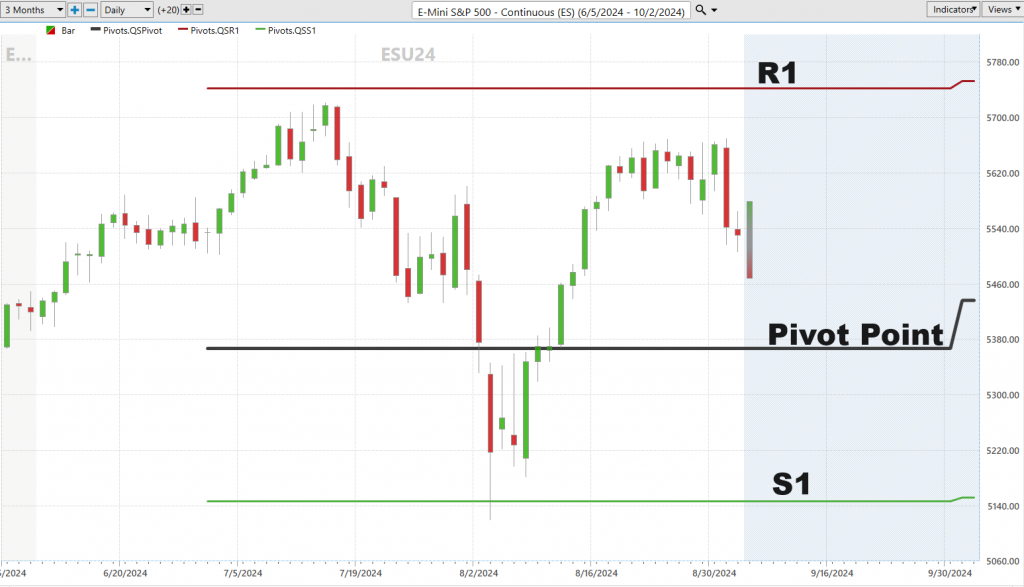
Here is a chart of the S&P 500 Index with the Quarterly Pivot Point, S1 and R1 clearly delineated on the chart. Amazing how these levels drawn at the beginning of this quarter have contained the entire trading range so far.
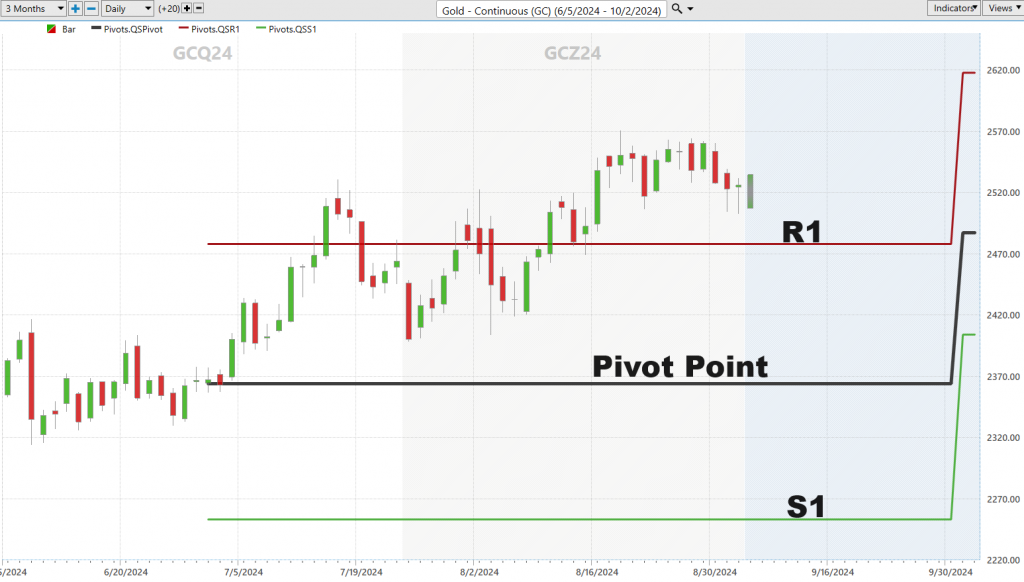
Let’s look at Gold which has been in the news lately. Observe how Gold started the quarter at the pivot point and immediately rallied to R1 and has spent the better part of the quarter above R1. Clearly this is a BULL market in Gold and Pivot traders had plenty of time to jump on board beforehand.
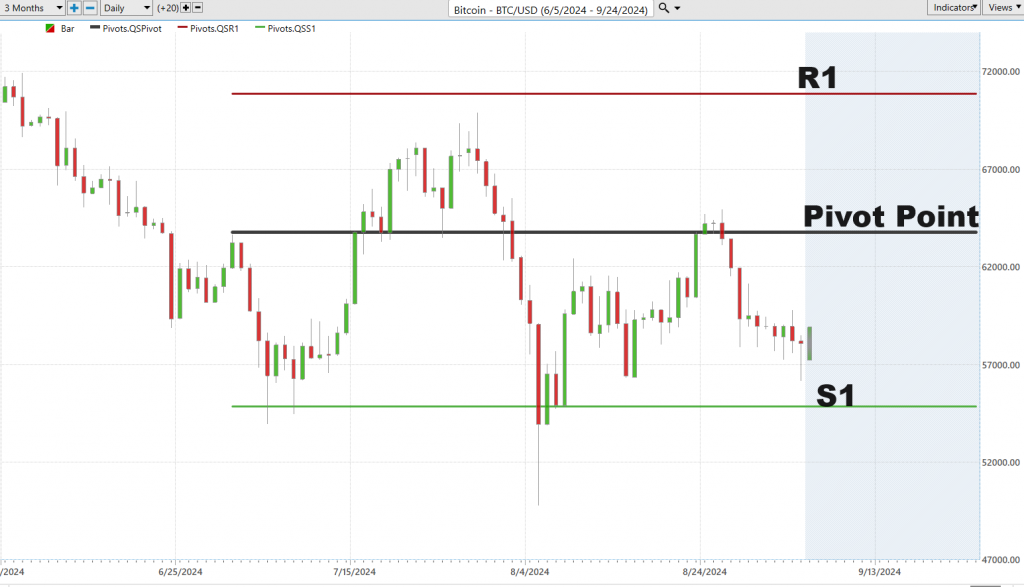
Let’s apply this same logic to Bitcoin.
Clearly Bitcoin has a slight downward bias. It is currently testing very important support at S1. It has spent the better part of the 3rd quarter under the quarterly PIVOT POINT indicating a lack of upward momentum.
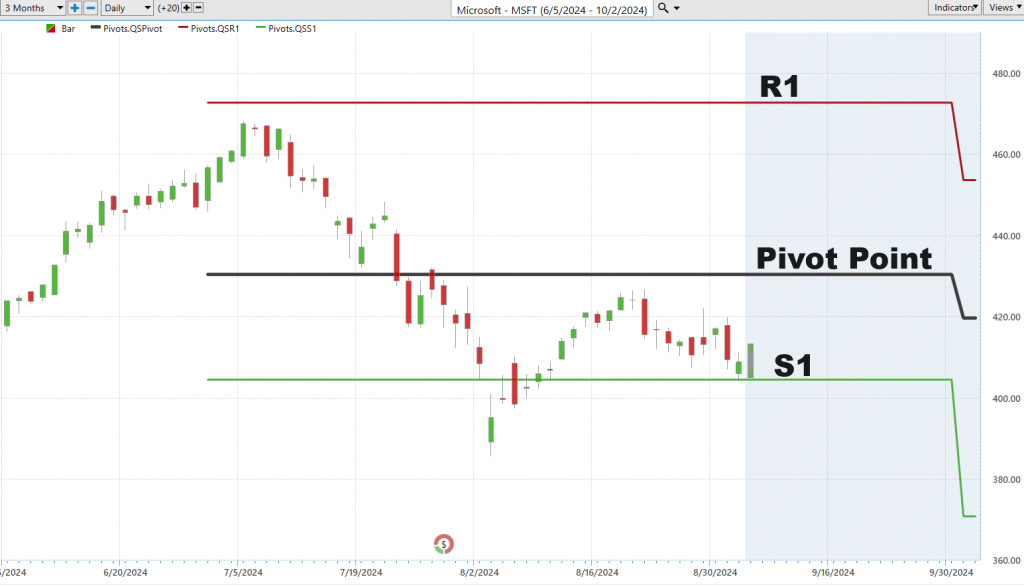
Here is Microsoft. The chart looks very heavy at the present time. It is also testing S1 and looks rather lackluster. A close below S1 would indicate a downdraft to the next support level.
Traditional Pivot Point analysis provides 5 levels for each time frame being analyzed which I will briefly explain here but many traders simply rely on the PIVOT POINT, S1 and R1.
The five-point system is a widely used method that helps traders identify key price levels for the day. It starts with the previous session’s high, low, and close, and builds out with two extra support levels and two resistance levels, giving you five critical pivot points to guide your trades. Here’s the breakdown:
PivotPoint =(PreviousHigh + PreviousLow + PreviousClose) / 3
Support 1 (S1) = (Pivot Point x 2) – Previous High
Support 2 (S2) = Pivot Point – (Previous High – Previous Low)
Resistance 1 (R1) = (Pivot Point x 2) – Previous Low
Resistance 2 (R2)= Pivot Point + (Previous High – Previous Low)
By watching how prices react around these pivot points, traders can gain key insights into market sentiment and potential trend reversals. These levels serve as guideposts for identifying where the market might find support or face resistance, allowing traders to time their entries and exits more effectively.
Breakouts are defined by consecutive closes above the R1 or below the S1 areas for each timeframe being analyzed.
I recommend that you monitor pivot points on three different timeframes which will validate your analysis.
Of course, it’s not just about watching the levels; it’s about confirming what you see. Volume analysis should always be cross-referenced with pivot point analysis. When prices are moving higher with rising volume, it signals a strong uptrend, with plenty of traders backing the move. If prices are falling and volume is increasing, that downtrend has conviction. On the flip side, low volume during price moves could suggest that the trend lacks staying power and might reverse.
At the end of the day, pivot points are about preparation. Whether you’re walking into a new trading day, week, month, or quarter, these levels allow you to enter each session with a clear game plan, ready to respond to whatever the market throws at you. That level of preparation gives you a serious edge in the trading game.
Traders use pivot points because they provide a structured framework for analyzing price action. By identifying key support and resistance levels ahead of time, traders can make better-informed decisions about where to enter or exit a trade, reducing the emotional aspects of trading. Pivot points also serve as valuable tools for spotting potential reversals or confirming the strength of a trend, giving traders an edge in anticipating market movements. Whether used on their own or in combination with other indicators, pivot points are a powerful tool for traders seeking to improve their timing and risk management.
Once you start using pivot points you will recognize their value in spotting strong and weak trading candidates.
I’d like to invite you to learn how to trade with artificial intelligence so our software can do all of the heavy lifting for you.
The purpose of A.I. in trading is simple: keep you on the right side, of the right trend at the right time.
Greed, hope, fear, and vanity—they’re the eternal players tugging at the strings of the human imagination. But while emotions run rampant in the minds of traders, technology sits in the background, quietly crunching numbers, analyzing thousands of data points, and offering cold, hard facts. No emotion, no ego—just a calculated path forward. The truth is, every trader, no matter how seasoned, must confront these powerful emotions. And the smartest way to do it? Lean into the emotionless, unwavering logic of artificial intelligence.
Are you ready to absolutely crush it in today’s lightning-fast financial markets? Let me ask you something—what if you had a way to predict market movements with laser-like precision and never miss a beat? What if you could catch the right trends, at the right time, over and over again? Well, hold onto your hat, because we’re about to introduce you to something that will change your trading game forever.
Introducing our Exclusive A.I. Trading Masterclass—this isn’t some run-of-the-mill training. No, this is your ticket to dominating the markets with the kind of precision that only cutting-edge technology can deliver.
Artificial Intelligence isn’t the future of trading, it’s the *now* of trading, and it’s ready to skyrocket your performance beyond anything you’ve imagined. Picture this: our A.I.-powered system scans the markets 24/7, so you don’t have to. It pinpoints opportunities, navigates through market chaos, and helps you ride the waves of every twist and turn like a pro.
Sound good?
You bet it does.
But you don’t have to take my word for it.
Join us for the next live Masterclass and see for yourself. We’re pulling back the curtain and showing you how to harness the power of A.I. to navigate the wild financial landscape ahead. Plus on thisLIVE Trading Master Class we’ll show you 3 stocks that the artificial intelligence has isolated for big moves.
Let’s Be Careful Out There.
It’s Not Magic.
It’s Machine Learning.
THERE IS A SUBSTANTIAL RISK OF LOSS ASSOCIATED WITH TRADING. ONLY RISK CAPITAL SHOULD BE USED TO TRADE. TRADING STOCKS, FUTURES, OPTIONS, FOREX, AND ETFs IS NOT SUITABLE FOR EVERYONE.IMPORTANT NOTICE!
DISCLAIMER: STOCKS, FUTURES, OPTIONS, ETFs AND CURRENCY TRADING ALL HAVE LARGE POTENTIAL REWARDS, BUT THEY ALSO HAVE LARGE POTENTIAL RISK. YOU MUST BE AWARE OF THE RISKS AND BE WILLING TO ACCEPT THEM IN ORDER TO INVEST IN THESE MARKETS. DON’T TRADE WITH MONEY YOU CAN’T AFFORD TO LOSE. THIS ARTICLE AND WEBSITE IS NEITHER A SOLICITATION NOR AN OFFER TO BUY/SELL FUTURES, OPTIONS, STOCKS, OR CURRENCIES. NO REPRESENTATION IS BEING MADE THAT ANY ACCOUNT WILL OR IS LIKELY TO ACHIEVE PROFITS OR LOSSES SIMILAR TO THOSE DISCUSSED ON THIS ARTICLE OR WEBSITE. THE PAST PERFORMANCE OF ANY TRADING SYSTEM OR METHODOLOGY IS NOT NECESSARILY INDICATIVE OF FUTURE RESULTS. CFTC RULE 4.41 – HYPOTHETICAL OR SIMULATED PERFORMANCE RESULTS HAVE CERTAIN LIMITATIONS. UNLIKE AN ACTUAL PERFORMANCE RECORD, SIMULATED RESULTS DO NOT REPRESENT ACTUAL TRADING. ALSO, SINCE THE TRADES HAVE NOT BEEN EXECUTED, THE RESULTS MAY HAVE UNDER-OR-OVER COMPENSATED FOR THE IMPACT, IF ANY, OF CERTAIN MARKET FACTORS, SUCH AS LACK OF LIQUIDITY. SIMULATED TRADING PROGRAMS IN GENERAL ARE ALSO SUBJECT TO THE FACT THAT THEY ARE DESIGNED WITH THE BENEFIT OF HINDSIGHT. NO REPRESENTATION IS BEING MADE THAT ANY ACCOUNT WILL OR IS LIKELY TO ACHIEVE PROFIT OR LOSSES SIMILAR TO THOSE SHOWN.


