


How do you define normal?
How do you define abnormal?
I used to know how to answer those questions.
In today’s chaotic world, distinguishing between normal and abnormal has become increasingly difficult. Historically, normalcy was defined quantitatively using statistical averages and standard deviations, allowing us to build expectations based on probability theory. This method enabled predictions by identifying what fell within or outside the typical range. Probability theory, a crucial area of study, remains invaluable for determining potential outcomes and making informed decisions. As traders, developing the skill to ask meaningful questions is essential; it helps us apply probability theory effectively and gain wisdom from the chaotic and unpredictable nature of markets. This analytical approach equips us to better navigate and adapt to the complexities of modern trading environments.
In this article I will share a few charts which illustrate the idea that what we are experiencing in the economy and financial markets is not normal. We have entered an era of Permanent Inflation that is much more difficult for the Feds to disguise.
Here is a chart of the Warren Buffett Indicator. The Warren Buffett Indicator, which compares the total market capitalization of a country’s stock market to its GDP, has historically helped define normal and abnormal market environments by indicating overvalued (when the ratio is significantly above 100%) or undervalued conditions (when below 100%). By utilizing this ratio, investors could assess whether the market was in a bubble or undervalued, aiding in making informed investment decisions based on deviations from historical averages.
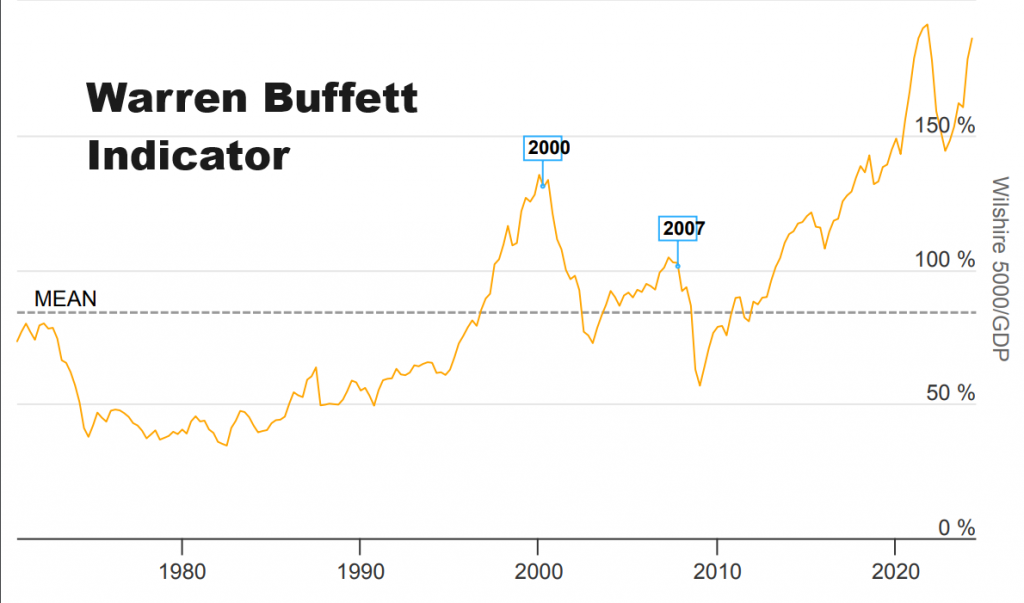
Today this indicator, which has helped traders and investors define overvalued market conditions, stands at 193%. It is approaching new all-time highs again.
When the Warren Buffett Indicator is approaching new all-time highs and is at 193%, it suggests that the stock market’s total valuation is significantly higher than the country’s GDP, indicating overvaluation on a historical basis and a heightened risk of a market bubble. Such extreme levels have preceded huge market corrections or downturns, signaling that the market environment is abnormal and overextended.
Notice how the MEAN on the chart going back 60 years is around 80%.
When I study that chart, I see the last time we were this high was November 2021. In November 2021, the Federal Funds Rate remained at the target range of 0.00% to 0.25%. This rate was consistent throughout the year as part of the Federal Reserve’s policy to support economic recovery during the COVID-19 pandemic. As of June 2024, the Federal Funds Rate is currently set at 5.33%.
What I don’t claim to understand but causes me great personal angst and uncertainty is that today interest rates are 20 x times higher than they were in November 2021, and the stock market as measured by the S&P 500 is 21% higher. How does that work?
In traditional macroeconomic theory, there’s a saying: “When interest rates are high, stocks will die; when interest rates are low, stocks will grow.” This basically means that high interest rates make it more expensive for companies to borrow money, which slows down their growth and profits, leading to lower stock prices. On the flip side, when interest rates are low, borrowing is cheaper, companies can grow faster, and stocks usually go up because investors look for better returns than what they get from low-yield bonds.
Historically, this has been seen many times. For example, in the early 1980s, the Federal Reserve jacked up interest rates to 18% to fight inflation, and the stock market took a big hit because of it. But after the 2008 financial crisis, the Fed cut rates to almost zero to help the economy recover. This led to a long bull market in stocks, as cheap borrowing fueled business expansion and investors flocked to stocks for higher returns. So, understanding how interest rates affect stocks can help you make smarter investment decisions. But this theory does nothing to help explain how interest rates are 20 times higher than in November 2021 and the stock market has surged 21% since then. Clearly, I would put this in the not normal category. Welcome to Permanent Inflation.
Next, here is the one chart that fundamentally bothers me the most. It is a chart which shows that interest payments on the US National Debt just crossed $1 trillion dollars and has surpassed military spending on the domestic budget.
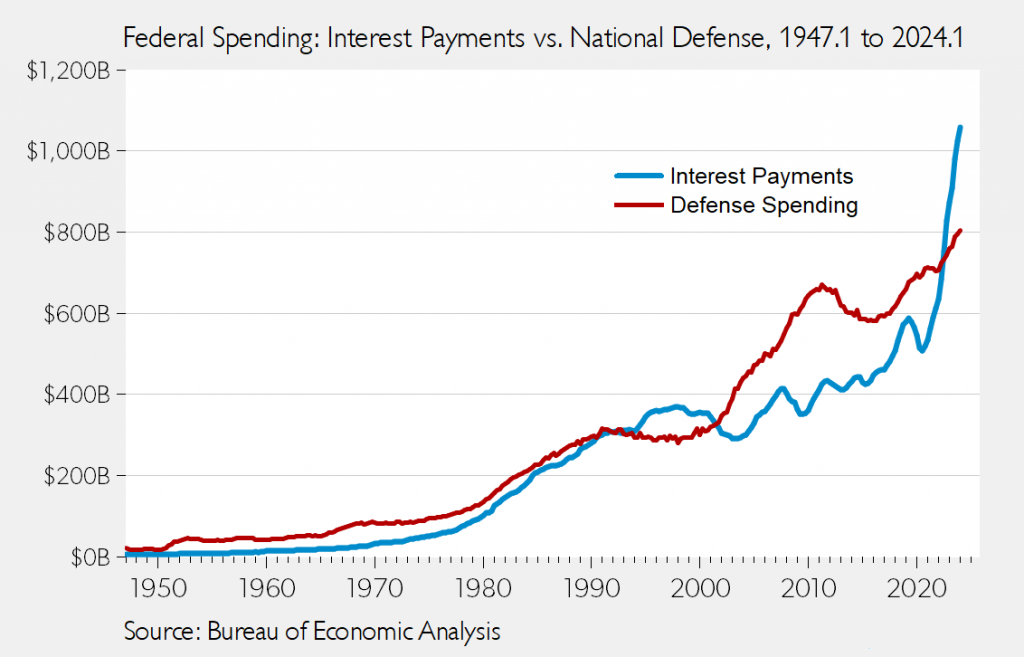
In November 2021, interest payments of the debt were $600 billion. In less than 3 years they have grown 66% and surpassed $1 trillion! How in the world is that sustainable?
Currently the top item on the Budget is Social Security at $1.3 trillion. Interest Payments on the debt will surpass it in the next 18 months.
Why does this cause me angst?
It’s all about who purchases the debt?
I pay attention to the Treasury auctions and the feedback I receive is that there is great demand for US Treasuries up to 2 years in the future. But nobody wants the longer-term.
U.S. Treasuries have been the worst performing asset class since 2020. Nobody wants to be trapped in a low yielding asset in an inflationary market environment.
But what is even more concerning is that the interest payments on the debt speaks to how to U.S. Treasury funds the government operations moving forward.
To estimate the total amount of debt that the U.S. Treasury will need to refinance over the next three years, we can use current figures and projections.
1. **Immediate Term**: Approximately $7.6 trillion of U.S. government debt is set to mature within the next year, which constitutes about 31% of all outstanding government debt.
2. **Projection for Three Years**: The Treasury’s refinancing activities include regular issuance of new securities to replace maturing ones. Given the historical and ongoing trends, we can extrapolate the refinancing needs for the next three years. If approximately $7.6 trillion matures annually, this figure would roughly triple over three years.
Thus, a conservative estimate would be around $22.8 trillion over the next four years. This assumes that the volume of maturing debt remains relatively constant and does not account for any significant increases or decreases in federal borrowing requirements or major fiscal policy changes.
Like I said earlier, it all boils down to who purchases the debt. If the Fed ends up purchasing the debt, it will make any inflation we have had in the United States look like a picnic.
What traders and investors are paying close attention to is when will the money printer go Brrrr again.
The government has an affordability crisis in that it cannot afford the current interest rate environment. Over the last three months, the Fed has been buying and supporting the Treasury market.
Over the short term this is perfectly normal.
Over the long term it is very abnormal.
My thesis is that the Fed is buying the Treasuries market to support the financing of the U.S. government. If they didn’t do this, it would be catastrophic. The problem moving forward is that to fund the government over the next 4 years as I stated earlier there is roughly $22 trillion in debt that needs to be purchased. This is also a recipe for PERMANENT INFLATION.
Next, a chart of the realized gains and losses on the books of the US banking system provided by the Federal Deposit Insurance Corporation. Anybody want to guess what type of investment securities these banks have on their books?

If you said, U.S. Treasuries, go to the head of the class.
Simple question, how can it be that today the banking system is exponentially worse from a solvency perspective than in 2008 and our monetary authorities are telling us that the economy is strong and resilient?
I would urge you to ask that question as well and apply it to your personal finances.
It is generally true and fair to say that when the economy is healthy, banks tend to be healthy, and vice versa. This relationship exists because banks are integral to the economic system, acting as intermediaries that facilitate economic activity through lending, savings, and investment services. The chart above does not inspire confidence for me to conclude that we have a healthy economy.
In a strong economy, businesses and individuals are more likely to borrow money for expansion, investments, and consumption. This increased demand for loans can boost bank revenues through interest income.
Economic growth typically leads to higher employment rates and incomes, reducing the likelihood of loan defaults. This helps maintain the asset quality of banks.
With more economic activities, banks often see higher transaction volumes and fees, contributing to better profitability.
During economic downturns, businesses and consumers often reduce borrowing due to uncertainty and lower confidence. This decrease in lending can reduce banks’ interest income.
The health of the banking sector is closely tied to the overall economic environment. A robust economy promotes healthy banking operations through higher lending, lower default rates, and better profitability. Conversely, economic downturns challenge banks with reduced lending demand, higher defaults, and lower profits. Understanding this interrelationship helps in comprehending the broader financial stability of an economy.
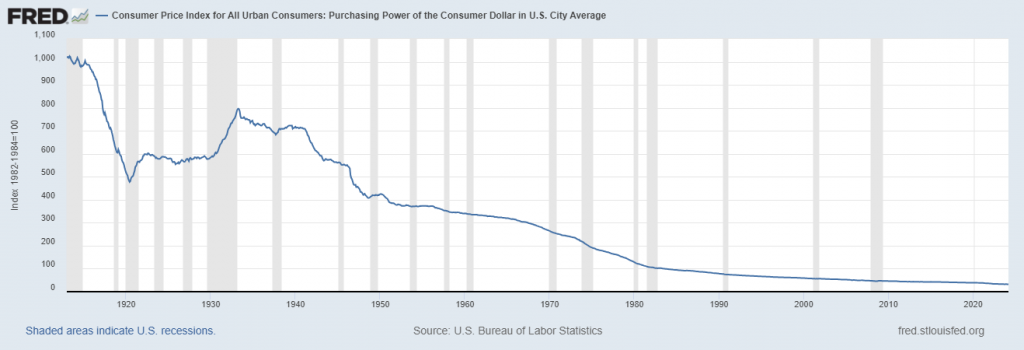
What I have been obsessed with since the pandemic is the loss of purchasing power that the events I outlined above have created. Whether you are aware of it or not, this Permanent Inflation trend is accelerating.
Doubt me?
Over the past few weeks if you pay close attention to the financial media the political class has been floating a new solution. As if this couldn’t get any weirder, the solution proposed by Washington D.C bureaucrats is to tax unrealized capital gains.
You read that right. The discussions and legislation have been drafted to TAX unrealized profits.
In a normal world, taxes would be paid at the end of a complete transaction. Meaning you would determine your profit or loss as the difference between where you acquired an asset and where you sold it. Today our political class has decided that is an old school way of thinking which needs to fit in with modern times. In other words, if you own an asset and it is profitable, the government wants their tax NOW, even though you have not sold it.
If the taxation of unrealized capital gains were implemented, the financial markets would be thrown into turmoil. The political class, in their frantic and urgent attempts to address their insolvency and lack of fiscal responsibility, recognizes that their solution lies in making you pay for profits that have never materialized. This aggressive and overzealous approach would compel investors to sell assets to cover their tax liabilities on gains that remain unrealized. Such compulsive and panicked forced liquidation would significantly increase market volatility, as a large number of high-value assets, like stocks, bonds, and real estate flood the market simultaneously. The sudden oversupply of these assets would drive prices down, creating a ripple effect that could destabilize the entire financial system. The traditional mechanisms of supply and demand would be upended, resulting in unpredictable and potentially severe market fluctuations.
This is a horrible idea! But the mere fact that it is bandied about shows you the desperation and frantic nature of those seeking to fund the government coffers.
We don’t live in normal times.
There is nothing normal about any of these ideas that I have shared. They are all part and parcel of the reality that since the Federal Reserve Act was passed in 1913 the US. Dollar has lost almost 98% of its purchasing power.
Have you noticed that the economy simply seems to move from addressing one emergency to the next?
The point I am making is that normalcy is an icon of the past. All these events defy financial logic. I would go so far as to claim that if I had forecasted these outcomes a decade ago it would have been considered extreme.
However, we live in extreme times! Trying to figure out how to navigate to a financial destination in these excesses requires more than just determination, brain power and logic.
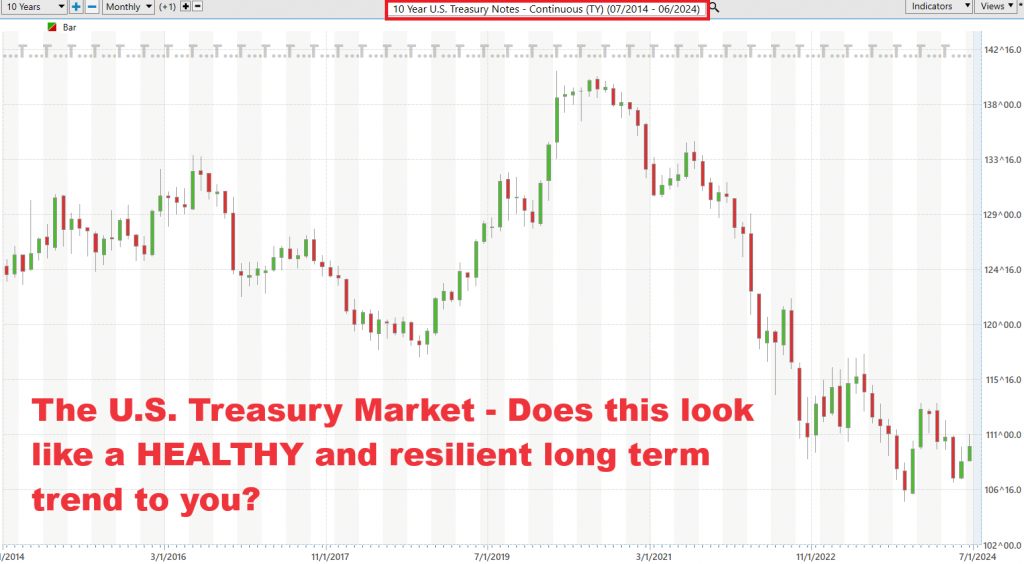
When you dive into the annals of history, you’ll see clear markers where debt, bankruptcy, war, and political upheaval have left their scars. This isn’t just academic—it’s a critical insight for today’s traders, especially given the shaky state of the U.S. Treasury market. Right now, Treasuries are offering a yield of 4.1%, while inflation hovers around 3.5%. Do the math, and Treasury investors are barely scraping by with a positive yield of just 0.6% if they stretch out to a 10-year investment. This comes after U.S. Treasuries have taken a whopping 40% hit since March 2020.
The Fed is in a bind—they need to prop up the U.S. Treasury market because there’s a serious lack of buyers, and the government has bills to pay. If interest rates fall, as Wall Street is betting they will, Treasuries lose their luster. But if rates climb, the government faces a mountain of debt interest it can barely manage. Traders and investors are stuck between these two extremes, trying to navigate the risk so they don’t see their savings evaporate.
In short, it’s a treacherous game out there. Balancing on this razor’s edge, one misstep could spell disaster for your portfolio.
So, when you’re bombarded with glowing economic data in the headlines, but you hear the rising concerns of the American people, don’t be misled. This isn’t some enigma, it’s not fake news, and it’s certainly not just political gamesmanship. This is what happens when the government cranks up the printing press to fuel our dubious economic growth. The disconnect between the rosy statistics and the real-world struggles is a direct consequence of reckless monetary policy. It’s high time we recognized the perils of relying on such unsustainable practices and demand real, responsible economic management.
Here’s the bottom line.
Remember, in the trading game, the only score that matters is how accurately you’ve predicted price movements. Everything else—the incessant buzz of financial news, the punditry, the market rumors—is just noise, a distracting backdrop to the main event.
While Wall Street obsesses over every word in the financial news cycle, the savvy trader should be laser-focused on the insights provided by artificial intelligence in trading. These tools are not just about crunching numbers; they’re about capturing the market’s pulse, slicing through the cacophony of daily headlines, and pinpointing what truly drives market movements.
For traders, the compass should always point in one of three directions: up, down, or sideways. Everything else is mere static. Navigating this terrain requires more than gut instinct; it demands the sophisticated edge that artificial intelligence trading software offers. It’s not just a tool—it’s your guiding light through the murky waters of market trends, sharpening your trading skills to a fine point.
Now, let’s take a moment to reflect on your market performance post-pandemic. Got that number in your head? Great. Now, adjust that figure by incorporating a cumulative inflation rate of about -19%. What you’re left with is the real measure of your trading prowess in these volatile times.
In other words, if you had a one-million-dollar portfolio in March 2020, it would have to be worth $1,190,000 today for you to be just at break even. The S&P 500 index is up 65% in this same time frame. But most traders missed most of that move. Why? Because it makes zero fundamental sense for the market to run that much higher during a pandemic and economic lockdown.
Like I said at the beginning of this article. I used to be pretty good at defining normal and abnormal.
The race to debase our currency is very real, and everyone feels its impact. Whether you’re a seasoned trader or just navigating the market, understanding the true value of your gains after accounting for inflation is crucial. The economic landscape is shifting, and it’s essential to stay informed and adapt.
When it comes to this Treasury borrowing fiasco, let’s cut through the noise and focus on the stark realities. Forget the fancy numbers for a second.
First off, let’s be clear: the U.S. government isn’t going to cut spending willingly. It’s just not going to happen. So, if we ever reach a point where we can’t keep issuing Treasury bonds, brace yourself because our dollar’s going to nosedive. At that point, the government will be left with three grim choices:
1. Increase taxes
2. Inflate the debt away
3. Default
Historically, governments tend to inflate the debt away, gradually eroding your purchasing power until it’s practically gone. This is Permanent Inflation.
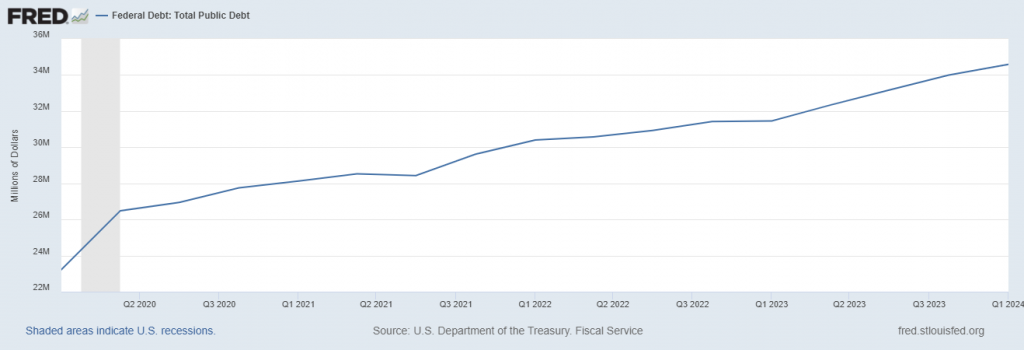
Look, we’re already sitting on a staggering $35 trillion in debt, and if we keep this up, $40 trillion is just around the corner, filled with empty political promises. Since March 2020, the Federal Debt has ballooned by 59% in just four short years.
This is clearly abnormal.
My best advice? Learn how to leverage artificial intelligence in your trading strategy to ensure you’re on the right side of the right trend at the right time.
In a realm where only the fittest endure, hesitation is a luxury you simply can’t afford. To thrive, not just survive, in this high-stakes, zero-sum game, you must harness the power of innovative technology and intelligent trend analysis.
Artificial intelligence is your secret weapon because it learns from failures, remembers them, and then charts new paths to find success. This Feedback Loop is the cornerstone of building fortunes for every successful trader I know. It’s about outsmarting the market with relentless precision and adaptability.
Visit With US and check out the A.I. at our Next Free Live Training.
It’s not magic. It’s machine learning.
Make it count.
THERE IS A SUBSTANTIAL RISK OF LOSS ASSOCIATED WITH TRADING. ONLY RISK CAPITAL SHOULD BE USED TO TRADE. TRADING STOCKS, FUTURES, OPTIONS, FOREX, AND ETFs IS NOT SUITABLE FOR EVERYONE.IMPORTANT NOTICE!
DISCLAIMER: STOCKS, FUTURES, OPTIONS, ETFs AND CURRENCY TRADING ALL HAVE LARGE POTENTIAL REWARDS, BUT THEY ALSO HAVE LARGE POTENTIAL RISK. YOU MUST BE AWARE OF THE RISKS AND BE WILLING TO ACCEPT THEM IN ORDER TO INVEST IN THESE MARKETS. DON’T TRADE WITH MONEY YOU CAN’T AFFORD TO LOSE. THIS ARTICLE AND WEBSITE IS NEITHER A SOLICITATION NOR AN OFFER TO BUY/SELL FUTURES, OPTIONS, STOCKS, OR CURRENCIES. NO REPRESENTATION IS BEING MADE THAT ANY ACCOUNT WILL OR IS LIKELY TO ACHIEVE PROFITS OR LOSSES SIMILAR TO THOSE DISCUSSED ON THIS ARTICLE OR WEBSITE. THE PAST PERFORMANCE OF ANY TRADING SYSTEM OR METHODOLOGY IS NOT NECESSARILY INDICATIVE OF FUTURE RESULTS. CFTC RULE 4.41 – HYPOTHETICAL OR SIMULATED PERFORMANCE RESULTS HAVE CERTAIN LIMITATIONS. UNLIKE AN ACTUAL PERFORMANCE RECORD, SIMULATED RESULTS DO NOT REPRESENT ACTUAL TRADING. ALSO, SINCE THE TRADES HAVE NOT BEEN EXECUTED, THE RESULTS MAY HAVE UNDER-OR-OVER COMPENSATED FOR THE IMPACT, IF ANY, OF CERTAIN MARKET FACTORS, SUCH AS LACK OF LIQUIDITY. SIMULATED TRADING PROGRAMS IN GENERAL ARE ALSO SUBJECT TO THE FACT THAT THEY ARE DESIGNED WITH THE BENEFIT OF HINDSIGHT. NO REPRESENTATION IS BEING MADE THAT ANY ACCOUNT WILL OR IS LIKELY TO ACHIEVE PROFIT OR LOSSES SIMILAR TO THOSE SHOWN.


