


In the trading world, the distinction between opinion and fact is not merely academic — it’s the cornerstone of financial success or failure. While everyone holds and expresses varied opinions, within the unforgiving theater of financial markets, the movements of price stand as the only arbiter of reality. In trading the only thing that matters is what price does. It is this foundational principle which differentiates great traders from bad traders. Great traders are obsessed with what “IS” occurring. Bad traders place all their energy and capital on what “SHOULD” occur. The journey about learning to differentiate between “IS” and “SHOULD” is ground zero. Price establishes the incontrovertible facts that dictate whether a trader’s wealth is on the ascent or a decline. As traders, the crucial question that must guide our decisions is whether we are relying on subjective opinions or objective facts. This delineation is critical, as it influences the trading narrative as well as the strategies adopted and the outcomes of our trades. Thus, discerning between what one believes, and what actually “is,” becomes a pivotal skill in the pursuit of profitable trading.
Success in trading hinges significantly on a trader’s awareness of overarching macroeconomic themes, which encapsulate the broad economic narratives influencing market movements. To grasp these themes effectively, one must begin by examining which markets have excelled and which have faltered within a specific analysis period. This initial observation serves as a foundation from which a coherent trading thesis can be constructed. By continuously comparing the performance of the markets that are leading against those that are lagging, traders can discern the prevailing economic ‘theme’ that is currently steering the financial markets. This methodical approach not only aids in understanding the macroeconomic environment but also in aligning trading strategies with the most influential economic forces at play.
Let me explain.
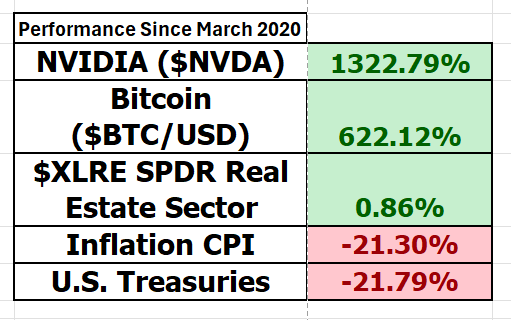
Let me pose a very simple, yet profound question to you. Since the pandemic began in March 2020, what has been the worst performing asset class? This question has only one answer. The answer is factual because I can easily measure all asset classes and determine which has been the worst performer.
Any guesses?
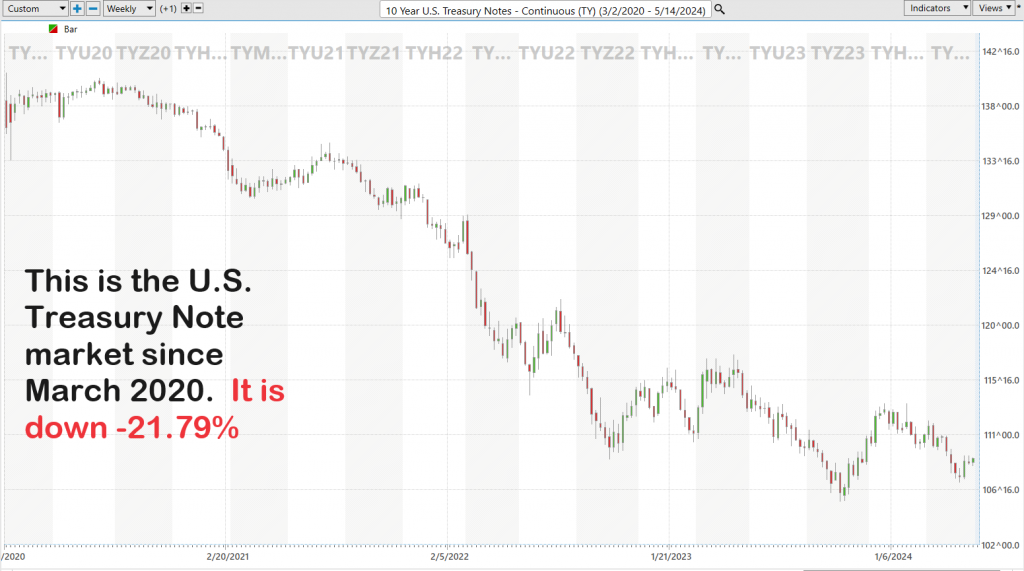
The worst performing asset class since March 2020 has been The United States Treasury Market. It is down -21.79%. U.S. Treasury instruments have long served as a cornerstone of the American economy, offering a robust framework for financial security and stability. Historically, these instruments have provided retirees with a reliable means to secure their futures, thanks to the consistent returns and low risk associated with Treasury bonds and notes. Savers, too, have benefited from these securities, which have offered a safe haven for accumulating wealth over time, especially in an environment of fluctuating market conditions. Furthermore, the interest rates on short-term Treasury bills have been instrumental in economic planning and decision-making, acting as a benchmark for assessing the financial viability of countless projects. It is fair to state that the U.S. Treasury market historically has been the GOLD standard for savers.
However, the landscape dramatically shifts when interest rates approach zero percent. Such an environment wreaks havoc on traditional economic roles played by Treasury instruments. Retirees find it increasingly difficult to rely on the income generated from these securities, as the yields dwindle, failing to keep up with inflation or provide sufficient income. Savers face similar challenges, as the returns on their investments in Treasury products become negligible, undermining their ability to grow their financial reserves effectively. For planners and investors, the zero-interest rate policy removes a critical tool for evaluating and comparing investment opportunities, as the baseline for risk-free returns essentially vanishes. This disruption in the foundational elements of financial planning and saving underscores the profound impact that near-zero interest rates can have on the economy and its participants.
This one data point of U.S. Treasuries being down -21.79% since the March 2020 is the backdrop against which all the other noise in the economy happens.
The U.S. Treasury market is about $24 trillion in size. Look at the following chart. Were you aware of this reality? The consequences of this fact is that if the GOLD STANDARD for savers no longer exists, how do savers save?
How does this affect pensions, banks, retirement planning?
Next, we have to understand the inflationary climate that the economy is operating under. Using the Bureau of Labor Statistics figures we can see that since March 2020 the Consumer Price Index has risen 21.3%. Once again these are the facts from the government’s statistics which most market participants feel are very much understated.
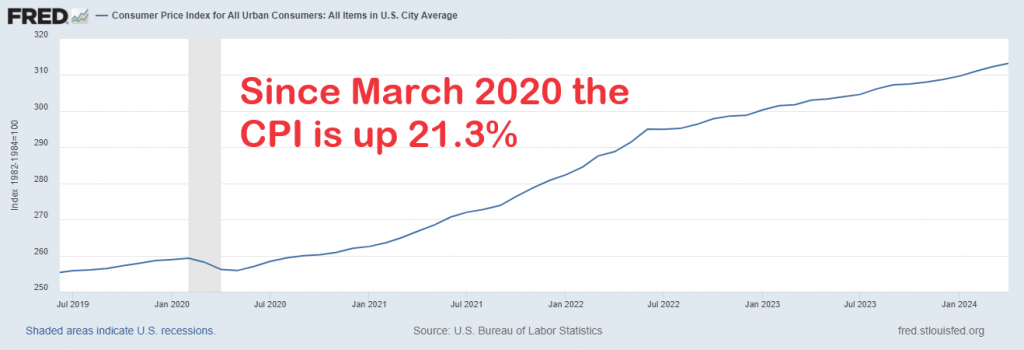
Experiencing a 21.3% inflation rate over the last four years significantly impacts financial decisions and perceptions. For one, this high rate of inflation necessitates a reassessment of long-term financial planning to ensure savings do not erode in value. It also influences trading strategies, as investors might seek higher returns to outpace inflation, potentially increasing exposure to riskier assets. Confidence in the U.S. dollar could wane, as its purchasing power diminishes, affecting both domestic and international trust in the currency. Finally, investors and savers in the U.S. Treasury market may find the real returns on their investments severely diminished, prompting a shift towards assets that better hedge against inflation.
Stop and think about the ramifications and consequences of just these two data points. Are you making 21% more than you were four years ago? Subtract 21% from the returns on your trading portfolio to see what your real purchasing power is today. Looked at another way, if your portfolio was $100,000 four years ago it would need to be at $121,300 just to keep pace with inflation.
More importantly when financial media proposes that the economy is strong and resilient, simply contrast that opinion against these two data points.
How do you navigate against this backdrop? What has your performance been so far?
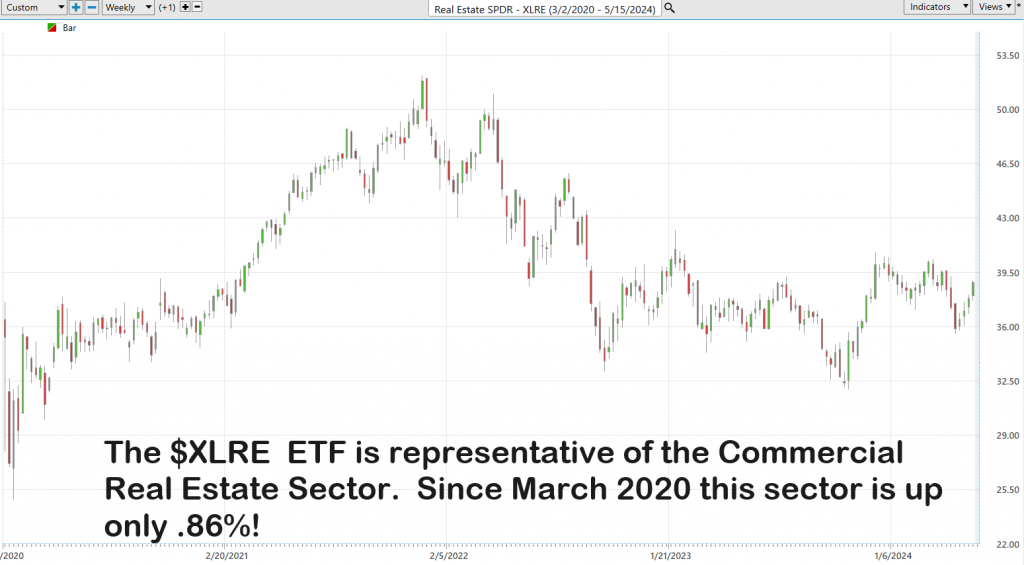
I get very curious when I do this type of research. I start digging and digging trying to steer clear of opinions and simply focus on the facts. What was troubling for me is stumbling across the SPDR Real Estate ETF $XLRE. Since March 2020, this asset class representing mostly commercial real estate is up only 0.86%. Clearly this illustrates the troubles in the commercial real estate sector post-pandemic. The Real Estate Select Sector SPDR Fund ($XLRE) is an exchange-traded fund that aims to provide investment results that correspond generally to the price and yield performance of the Real Estate Select Sector Index. Its primary focus is on companies involved in real estate management and development, as well as REITs, with the objective of mirroring the sector’s performance as it is represented in the S&P 500.
The commercial real estate sector is facing significant challenges in the post-pandemic landscape, primarily due to the persistent emptiness of office spaces in major cities. With the widespread adoption of remote work, many businesses have reevaluated their need for physical office space, leading to a reduction in demand and potentially long-term vacancies. This shift threatens the financial stability of real estate investments in urban centers, as property values decline and landlords might struggle to find new tenants, reshaping the economic fabric of city-based commercial real estate.
So far, I have provided you with three data points. They have all been rather negative. If I were to end the article here, you would conclude that things are really horrific. That’s why as a trader, as you develop your macro-economic thesis, you have to look at both sides of the ledger. You must look at the entire picture. However, by looking at the worst performers you are aware of reality. This allows you to filter all news and form your opinions against this context and scenario.
These three data points are indeed horrific. It is against this setting that we must now start to evaluate the best investments in the economy.
In trading we always want to know which are the fastest and slowest horses in the financial race. When you perform this analysis, you’ll find the news and headlines don’t often align with these facts. From this starting point you start to be able to develop some pretty important questions. Like if U.S. Treasuries are the slowest horse in the race, what exactly does that mean for me and my portfolio? Equally as important we are at least aware of the effect of inflation against the commercial real estate sector.
Any guesses as to which have been the top three investments since March 2020? Instead of just looking at sectors I chose to include a handful of the top performing stocks in this analysis. I’ll provide a complete synopsis at the end of this article.
Traders monitor the “M-A-T-A-N-A” stocks, which is an acronym for Microsoft ($MSFT), Apple ($AAPL), Tesla ($TSLA), Amazon ($AMZN, Nvidia ($NVDA) and Alphabet ($GOOGL). These are the heaviest weighted companies in the NASDAQ and the S&P 500 Index.
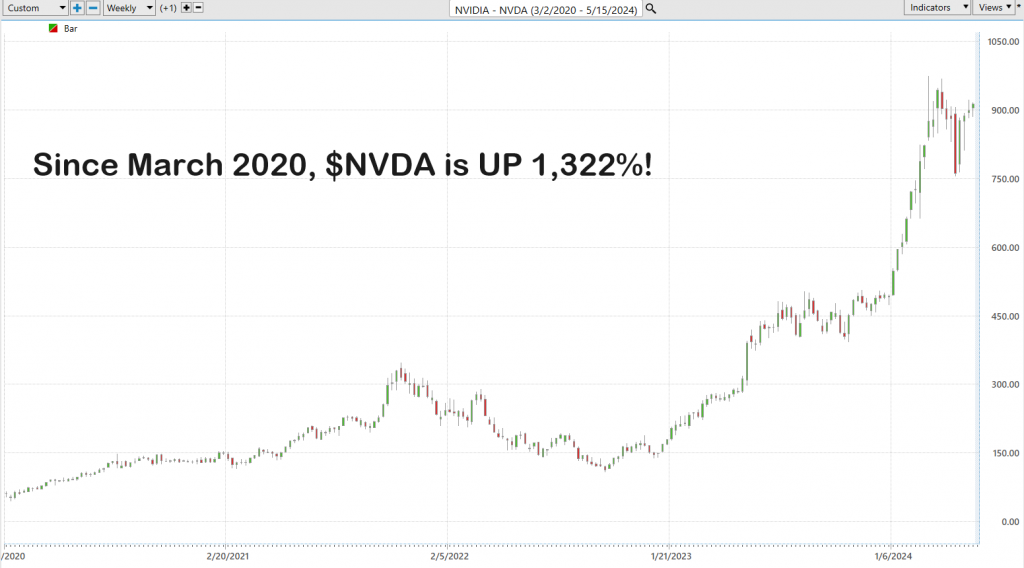
The top performing stock since March 2020 has been Nvidia ($NVDA).
It’s up 1,322%!
Since its founding in 1993, NVIDIA’s mission has been to advance the field of visual computing — the art and science of computer graphics. With a focus initially on creating graphics chips for gaming PCs, NVIDIA evolved to become a leader in graphics processing unit (GPU) design, impacting a broader range of industries including professional visualization, computing, and automotive markets. Over the years, their purpose expanded to harness GPU capabilities for parallel processing tasks, making substantial advancements in deep learning and artificial intelligence. Today, NVIDIA is fully committed to supporting and driving the A.I. boom, leveraging their GPU technology to power A.I. applications across diverse sectors such as robotics, autonomous vehicles, and high-performance computing, underscoring their ongoing mission to revolutionize industries through enhanced computing and visualization technologies.
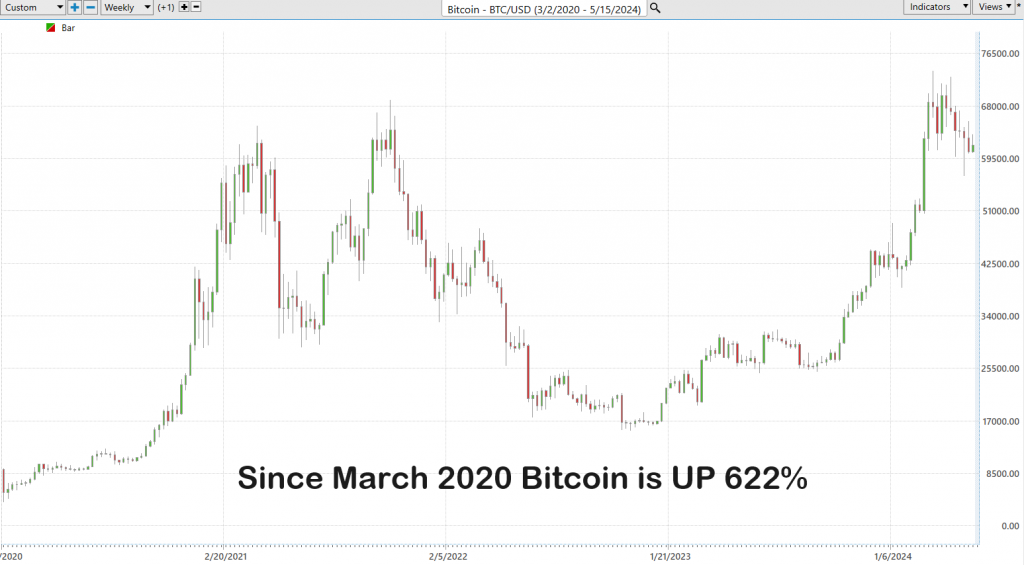
What has been the second-best asset class since March 2020?
Bitcoin and $NVDA have been the two outliers out of all sectors and individual stocks. Since March 2020 Bitcoin is up 622%.
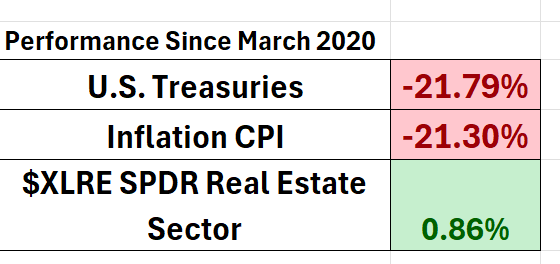
So, let’s do a quick review of the 5 data points that we have reviewed so far.
What kind of macro-economic theme has played out since March 2020?
When I look at those metrics this is what I understand.
- There is a lack of faith in U.S. Debt.
- Inflation was not transitory, regardless what the Fed or U.S. Treasury tell us.
- Any institution or individual that tried to save capital in the form of Treasury debt got run over. This includes banks, pension funds, insurance companies and retirees.
- The Commercial Real Estate Sector is barely staying afloat. It could cause all types of problems in the economy.
- Bitcoin, the top cryptocurrency is the best performing asset class, because it presents an alternative form of money to fiat currency. The lack of faith in U.S. Debt only accelerates this trend.
- NVIDIA, the groundbreaking tech company which pioneered computer chips for graphics cards and crypto creation is now the market leader in the artificial intelligence boom. Expect that trend to accelerate further.
My opinions are built from the performance metrics since March 2020. The gorilla in the room is government debt. The US Treasury must refinance $10 trillion of government debt this year.
Quick question: Who buys it? If the Fed buys it, then you can count on higher inflation as the money printer will be forced to go “Brrrrrrrrr.”
The situation with the U.S. Treasury and its debt can be likened to the historical battle between the horse and buggy and the Model T; an era where emerging technology (the automobile) challenged established modes of transportation. Just as the Model T eventually revolutionized transport despite initial resistance and skepticism, modern financial instruments and practices are gradually reshaping traditional approaches to government debt management. This evolution marks a significant period in economic history, reflecting a shift from old to new ways of thinking about financial stability and public debt.
The opposite is Bitcoin which is an alternative form of currency challenging the status quo.
Amidst that backdrop is all the other financial noise. The contrast is stark. The performance metrics are black and white.
What would need to occur for the U.S. Treasury market to be considered healthy again?
What would need to occur for the bitcoin marketplace to be considered a failure?
We are in a Presidential Election year, and traditionally during these 4-year cycles we traditionally see a massive expansion in new money being created by the incumbent administration to curry favor with the voters.
Directly tied to these questions, is how can you consider the economy to be strong and resilient when you have the Treasury market’s performance being the worst in its history?
I ponder these questions a great deal because they help me see trends emerge. More importantly they help separate fact from fiction. It’s an important exercise that I recommend.
At VantagePoint we teach traders to only be loyal to the trend.
I don’t know what will happen next month, or next year. But this type of analysis coupled with artificial intelligence informs me of what is happening right now.
Sometimes when something occurs, we feel that we need to understand every nook and cranny of a development before we can monetize it. With artificial intelligence in your corner when you trade you don’t need to do cartwheels trying to make sense of the financial markets. Chaos is everywhere. You simply need to learn to trust the trend.
The stock market has 11 different sectors. Each sector of the stock market determines what type of industry a company is in.
Listed below are the 11 different sectors of the stock market. Which sector of the stock market do you think was the best performing sector since March 2020?
1. **Energy**: This sector involves companies engaged in the exploration, production, and management of energy resources, primarily aiming to meet global energy demands efficiently and sustainably.
2. **Materials**: Includes companies that extract, and process raw materials used in industries such as chemicals, construction, and manufacturing, with the objective of providing essential commodities for global industrial operations.
3. **Industrials**: Comprises companies involved in manufacturing, infrastructure, and services, targeting efficient production and distribution of goods essential for economic growth.
4. **Consumer Discretionary**: This sector covers businesses related to non-essential goods and services such as retail, automotive, and leisure, which tend to thrive when the economy grows and consumer spending increases.
5. **Consumer Staples**: Focuses on essential products such as food, beverages, and household goods, aiming for steady demand and stable earnings regardless of economic conditions.
6. **Healthcare**: Encompasses providers of medical services, manufacturers of medical equipment or drugs, and healthcare insurers, all aiming to enhance health outcomes and access to medical care.
7. **Financials**: Includes banks, investment funds, and insurance companies, focusing on providing financial services to individuals and companies that support economic activity and personal financial health.
8. **Information Technology**: Composed of companies that develop software, hardware, electronics, and IT services, with goals centered on innovation and integration of technology into everyday life and business operations.
9. **Telecommunication Services**: Involves companies that provide communication services through various media, aiming to connect people and provide access to voice, data, and internet services.
10. **Utilities**: Includes electric, water, and gas utilities aiming to provide essential services characterized by regular demand, contributing to stability and infrastructure development.
11. **Real Estate**: Consists of companies involved in real estate development and operations, aiming to meet the needs for residential, commercial, and industrial space, often structured as REITs (Real Estate Investment Trusts).
Each sector reflects a specific component of the economy, targeting specific consumer needs, technological advancements, or essential services, contributing to the overall economic fabric.
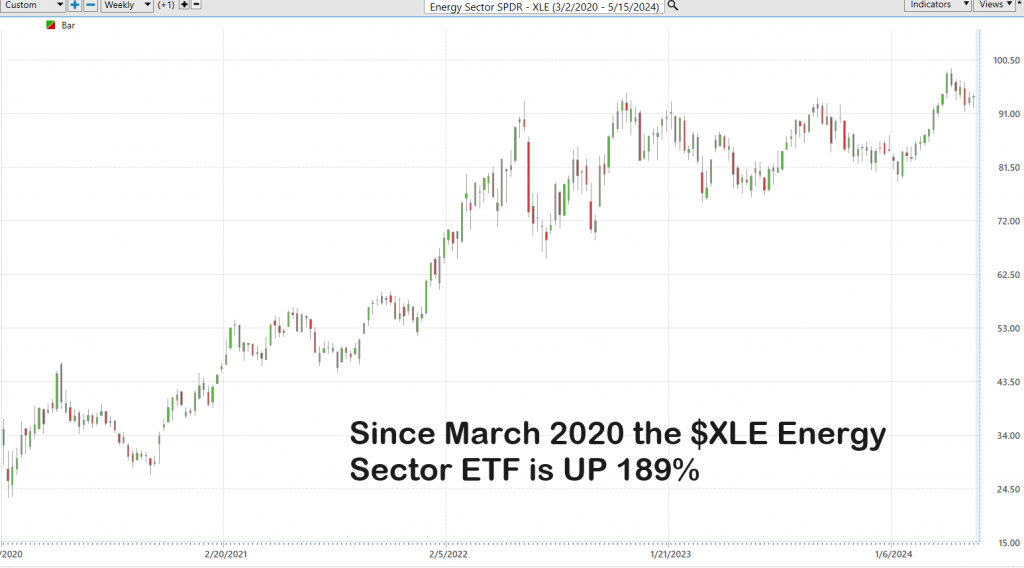
The top performing stock market sector since March 2020 has been the Energy Sector as reflected by the SPDR $XLE ETF. It’s up 189%. Some of the key companies included in the Energy Select Sector SPDR Fund (XLE) are Exxon Mobil Corporation, Chevron Corporation, ConocoPhillips, EOG Resources, Inc., and Schlumberger Limited. Other notable companies in the ETF include Marathon Petroleum Corporation, Phillips 66, Valero Energy Corporation, and Occidental Petroleum Corporation.
The strong performance of the XLE sector since the pandemic suggests a few things about the market and economic environment. Firstly, the resilience and recovery of the energy sector is driven by increasing oil prices, which have rebounded significantly from post-pandemic lows. Rising oil prices is inflationary at their core. Additionally, the sector’s performance reflects a broader market anticipation of rising energy demand as global economies recover and expand post-pandemic. This trend underlines the critical role energy plays in global economic activities and how shifts in this sector can have wide-reaching effects on the world economy.
Trends are what the trading world is all about. The adage that “a trend in motion tends to stay in motion until it is stopped by an opposing force” aptly describes the momentum often observed in financial markets. This principle, known as the trend-following strategy in trading, suggests that assets which have performed well are likely to continue their upward trajectory unless a significant counterforce, such as a shift in economic indicators or market sentiment, intervenes.
Conversely, the saying “winners win, and losers lose” reflects the persistence of performance, where strong performers tend to sustain their success, drawing more investment and interest, while poor performers often struggle to reverse their fortunes.
This behavior is rooted in investor psychology and market dynamics, where confidence in winning assets boosts their appeal, and skepticism about underperformers leads to continued neglect or divestment. This phenomenon underlines the importance of momentum and historical performance in making informed investment decisions.
Here are the performance metrics of all the major asset classes since March 2020. As you study this graphic ponder the following question.
What evidence exists that will alter these prevailing trends?
I find it fascinating to see that the Gold and Silver are keeping pace with many of the top broader stock market indexes. I am fascinated by the fact that CRUDE OIL is outperforming the S&P 500 Index.
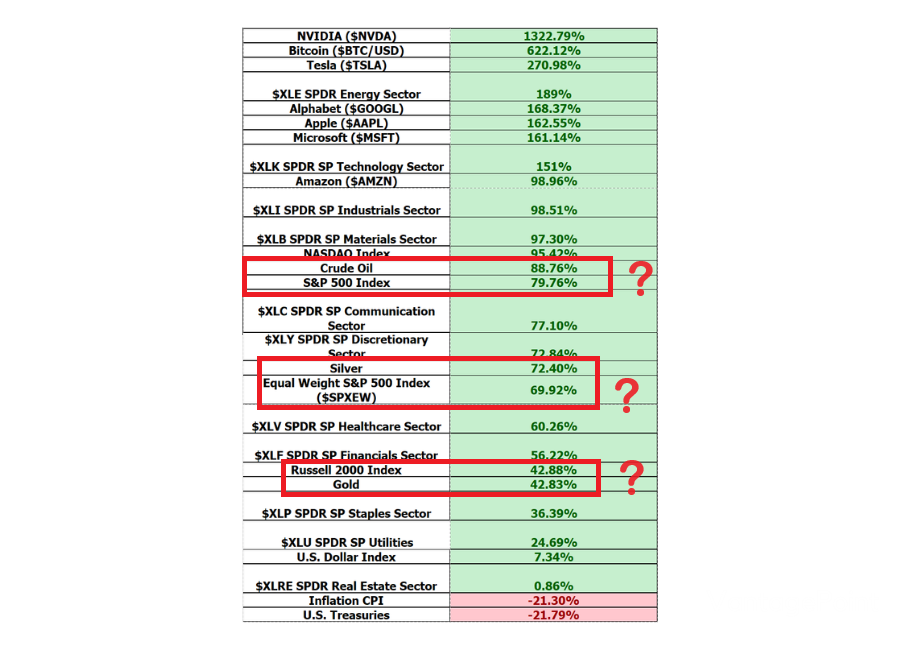
It’s my hope that as you study these metrics that you derive actionable insights that will help preserve your purchasing power. The good news is that with artificial intelligence heavy lifting is all done for you, every trading day.
When I look ahead my fundamental thesis is that the Fed will have to create a tsunami of new money to fund the Government moving forward.
In the financial landscape we navigate today, currency debasement isn’t just a transient concern—it’s the flavor of every day, subtly eroding your purchasing power even as you read this.
This financial phenomenon casts a long shadow, yet it also opens a unique avenue for strategic advantage using advanced technologies like Artificial Intelligence (A.I.) in trading. A.I. offers a pivotal edge in this new normal, transforming not just the way we approach market trends but fundamentally altering our battle tactics against the erosion of our wealth.
With this urgent need in mind, we proudly unveil an exclusive masterclass designed to demystify the current economic landscape and unveil the transformative potential of Artificial Intelligence (A.I.) in trading. This event promises to be an enlightening exploration for those keen to understand and navigate the complexities of modern markets.
Join us as we delve deep into the capabilities of A.I. trading software, which has not only mastered complex games like Go and Chess but is now redefining financial trading. Our A.I. trading masterclass, led by seasoned experts, will illustrate how A.I. serves as a formidable ally in identifying and capitalizing on market trends, performing sophisticated trend analysis, and refining trading decisions. This session is meticulously crafted to empower you with the skills and insights needed to harness A.I. effectively, ensuring you’re well-equipped to protect your investments and exploit market opportunities to their fullest.
Imagine a world where you’re not just surviving but thriving, even as the value of currency wavers under the pressure of incessant printing. Our cutting-edge A.I. trading technology is designed not merely to safeguard but to enhance your wealth through precise, swift market adaptations. It excels where traditional methods falter, by instantaneously assimilating vast arrays of market data and executing trades that capitalize on fleeting opportunities. This A.I.-driven trading approach is more than just about staying afloat; it’s about turning the tide in your favor, leveraging top-tier technological advancements to not only detect but also dynamically respond to market shifts, ensuring that your investments remain robust and yield fruitful returns.
To those who stand ready at the helm, poised to redefine their financial destiny, this isn’t just an invitation—it’s a call to arms. Arm yourself with our A.I. trading system and transform potential threats into lucrative opportunities. Join us for a transformative journey at our Live Online Free Masterclass on A.I. trading. Here, you’ll gain the insights to harness A.I.’s potential fully, turning the relentless challenge of currency debasement into a strategic advantage that not only preserves but multiplies your wealth. Embrace this chance to redefine your approach to trading and investment, and step into a realm where financial foresight meets technological prowess.
Join us for a Free Live Training.
It’s Not Magic.
It’s Machine Learning.
Let’s Be Careful Out There!
THERE IS A SUBSTANTIAL RISK OF LOSS ASSOCIATED WITH TRADING. ONLY RISK CAPITAL SHOULD BE USED TO TRADE. TRADING STOCKS, FUTURES, OPTIONS, FOREX, AND ETFs IS NOT SUITABLE FOR EVERYONE.IMPORTANT NOTICE!
DISCLAIMER: STOCKS, FUTURES, OPTIONS, ETFs AND CURRENCY TRADING ALL HAVE LARGE POTENTIAL REWARDS, BUT THEY ALSO HAVE LARGE POTENTIAL RISK. YOU MUST BE AWARE OF THE RISKS AND BE WILLING TO ACCEPT THEM IN ORDER TO INVEST IN THESE MARKETS. DON’T TRADE WITH MONEY YOU CAN’T AFFORD TO LOSE. THIS ARTICLE AND WEBSITE IS NEITHER A SOLICITATION NOR AN OFFER TO BUY/SELL FUTURES, OPTIONS, STOCKS, OR CURRENCIES. NO REPRESENTATION IS BEING MADE THAT ANY ACCOUNT WILL OR IS LIKELY TO ACHIEVE PROFITS OR LOSSES SIMILAR TO THOSE DISCUSSED ON THIS ARTICLE OR WEBSITE. THE PAST PERFORMANCE OF ANY TRADING SYSTEM OR METHODOLOGY IS NOT NECESSARILY INDICATIVE OF FUTURE RESULTS. CFTC RULE 4.41 – HYPOTHETICAL OR SIMULATED PERFORMANCE RESULTS HAVE CERTAIN LIMITATIONS. UNLIKE AN ACTUAL PERFORMANCE RECORD, SIMULATED RESULTS DO NOT REPRESENT ACTUAL TRADING. ALSO, SINCE THE TRADES HAVE NOT BEEN EXECUTED, THE RESULTS MAY HAVE UNDER-OR-OVER COMPENSATED FOR THE IMPACT, IF ANY, OF CERTAIN MARKET FACTORS, SUCH AS LACK OF LIQUIDITY. SIMULATED TRADING PROGRAMS IN GENERAL ARE ALSO SUBJECT TO THE FACT THAT THEY ARE DESIGNED WITH THE BENEFIT OF HINDSIGHT. NO REPRESENTATION IS BEING MADE THAT ANY ACCOUNT WILL OR IS LIKELY TO ACHIEVE PROFIT OR LOSSES SIMILAR TO THOSE SHOWN.


