


Over the last couple of months, traders everywhere have watched the stock market take a sharp dive, shedding a full 20% of its value. Many stocks plummeted even further. Observing the unfolding drama, it’s always fascinating to see how the media handles these sharp declines. Given the relentless demand of a 24-hour news cycle, it’s somewhat understandable. Financial journalists are under constant pressure to churn out content, most of which offer little real value to serious traders. This whirlwind of coverage led me to reflect on a crucial concept — simplicity.
I believe great trading hinges on two principles: recognizing opportunities and effectively managing risks. The essence of trading success lies in the ability to distill complex information into actionable insights – identify the underlying market trend and determine a position within that trend. This might sound straightforward, a simple conclusion that can be articulated in ten seconds — but it represents the culmination of processing vast amounts of data. Whenever I find myself on the wrong side of the market, caught in unfavorable conditions, I ask myself a pivotal question: “What did you learn from that experience?” This simple inquiry has been instrumental in helping me discern what truly matters in the world of trading.
Reflecting on the recent market turbulence, I now turn this question over to you, the trader: What did you learn from the experience? In every market correction, there is a lesson to be found, a nugget of wisdom that can refine your trading strategy and decision-making process. Let this simple question guide you through your analysis of events and lead you to clearer, more strategic thinking in future trades. Remember, the ability to simplify complex data into a clear understanding of risk and opportunity is an essential survival skill in the high-stakes world of stock trading.
The big deal about simplicity isn’t just making things easy-peasy; it’s about stripping down to the bare essentials without losing the magic that makes it all work. The trick is about boiling down to what’s essential and ditching the rest. That’s where the real sophistication lies, not in piling on, but in peeling back. Remember, brilliance is in simplicity.
Many years ago, as I found myself grappling with the capricious tides of trading, I sought the guidance of a seasoned trader, whose success was the stuff of legend. Despite making money, my trading results were wildly erratic, a source of considerable frustration. I turned to my mentor, sharing my plight and my trading statements, and confessed that trading the Japanese Yen was my crucible — consistently brutal and unforgiving. After a thorough review, he delivered an insight that was as profound as it was stark in its simplicity. “Stop trading the Yen,” he advised. “Without it, your results are exceptional.”
This advice struck me with the force of a revelation. It was a solution so self-evident, yet I had been blind to it. Here lay the power of simplicity, an often-overlooked principle that, once embraced, could clarify and streamline the path to success. My mentor’s guidance illuminated a fundamental truth: often, the most effective solution is not augmenting our strategies with more complexity but stripping away the parts that entangle us. This lesson, learned at a pivotal moment in my career, not only stabilized my trading outcomes but also reinforced a broader, invaluable lesson in life and business — sometimes, the key to unlocking our potential is hidden not in what we do, but in what we stop doing.
What’s obvious is often the hardest thing to see — not because it’s hidden, but because it’s too simple. Human nature tends to associate value with complexity, assuming that solutions must be layered, sophisticated, or buried beneath analysis. But the truth is, many of the most powerful insights are sitting right in front of us, overlooked precisely because they feel too easy. It’s ironic: the more evident something is, the more likely people are to dismiss it. The mind, trained to hunt for nuance, often misses the plain answer lying in the open.
This tendency reveals itself everywhere — from everyday decisions to major strategies in business and life. People will bypass simple truths in favor of convoluted theories, not realizing that the clearest path forward is usually the one they’ve been stepping around. Simplicity, in this way, becomes almost threatening. It challenges our ego, our education, even our sense of control. But the moment we stop trying to overthink everything and allow ourselves to accept the obvious, that’s often when we gain real clarity and progress.
Recently, as I watched the stock market take a significant downturn, I couldn’t help but reflect on the concept of simplicity amidst the chaos. The media coverage of the event was notably polarized. On one side, some reporters seized the opportunity to lay the blame for the market’s fall squarely at the feet of the Trump administration. On the other, more holistic analysts pointed out the historical overvaluation of the market, invoking Warren Buffett’s decision to shift to cash seven months ago as a prescient move. Each narrative contained elements of truth, yet as I observed the unfolding drama, I found myself distilling all the information down to a few critical questions: “What is the current trend?”, “How extreme can this get?”, and “Where is the opportunity and risk in this trend?”
These questions have always been the bedrock of my approach to understanding market movements. They strip away the noise of conflicting opinions and focus on the underlying currents that drive market dynamics. In moments of volatility, when emotions run high and the temptation to react impulsively increases, these questions serve as a north star, guiding traders toward more reasoned, strategic decisions. By asking these simple yet profound questions, traders can cut through the sensationalism and hyperbole that often dominate financial news. My hope in sharing these insights is to equip you, the trader, with the tools to navigate the market’s complexities with greater ease and to make decisions that are not just reactive, but strategically sound.
Alright, let’s break down this sneaky little devil of the data world — the statistical outlier. Picture this: you’re digging through your numbers, lining up all your ducks, and boom! There’s this one duck that’s unlike the others. It’s either Godzilla among kittens or a mouse in a herd of elephants. That, my friend, is an outlier. It’s that piece of data that doesn’t fit the pattern, the curveball no one saw coming.
Now, why should you care? Because understanding outliers is like having a secret decoder ring for the markets. Most data will cluster around a mean or average, but outliers? They’re the extremes that can throw you for a loop. If you’re not on your toes, they can skew your understanding of what’s really going on. It’s like thinking you’re a hotshot fisherman because you caught one whale, ignoring that the rest were minnows. Outliers can mess with averages and make standard deviations look like a circus sideshow, which directly toys with probability calculations. When you’re dealing with probabilities, especially in trading, you’re playing the odds. Outliers tweak those odds.
For traders, these oddballs are not just nuisances but potential gold mines or landmines. Imagine you’re analyzing stock performance, and there’s this one stock that’s shot up like a rocket while others are trudging along. That’s your outlier. Smart traders ask: “Why is this one different?” Is there a trend here or a fluke? Outliers can signal a shift in the market, a new opportunity, or warn you about a potential disaster. By studying these exceptions to the rule, traders can make decisions that aren’t just based on the majority of data but informed by the full picture. This savvy approach means not just following the herd but understanding where the edges of the herd might lead. So, respect those outliers — they might just be the map to your treasure… or the X marking a spot you want to steer clear of.
Let me explain this concept by looking at the history of Apple (AAPL). Here is a chart of $AAPL going back 10 years. What is it that you see when you first look at this chart?
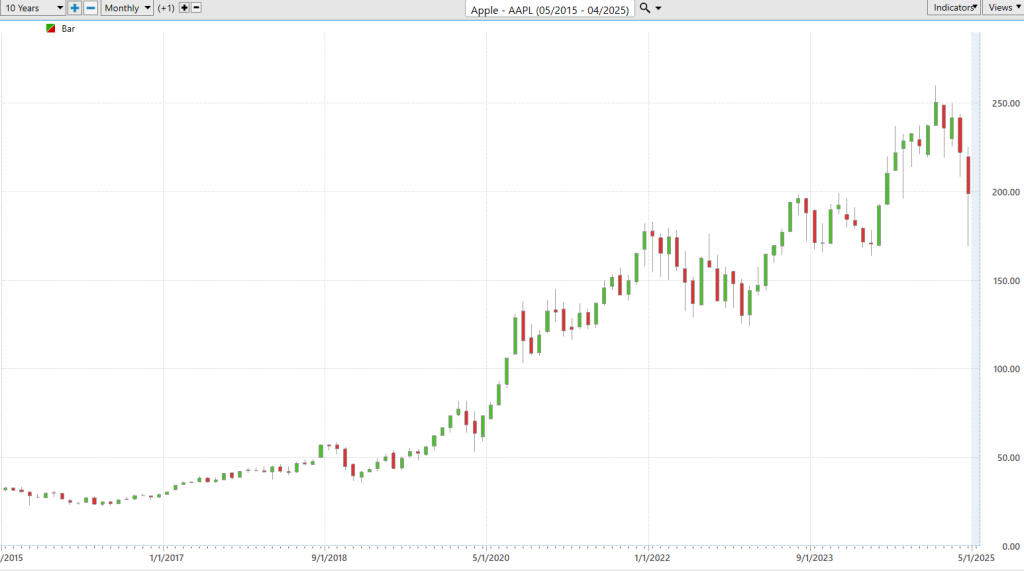
Now, most folks look at a 10-year chart of $AAPL and see a staggering 671% rally. But let’s not just feast on the icing. The real meat comes from examining the dips, the dives, and the downright drops this tech giant has experienced over the decade.
Let’s break down some statistical jargon that sounds boring but is as crucial as knowing where your next paycheck is coming from. We’re talking mean, median, mode, maximum, and minimum. Imagine these terms as your secret weapons in decoding the market.
First, the mean — this is your average joe. Add up all the declines of $AAPL over a set period and divide by the quantity you summed up. This gives you a baseline, a steady normal heartbeat of the stock’s performance.
Next up, the median. This is the middleman. Line up all the declines, and the median is the one smack in the middle. This guy’s cool because he’s not swayed by those wildly high or low extremes — an honest view of what’s typical.
Don’t forget the mode — the crowd favorite. It’s the level of decline that occurs most often. Like that one pop song you can’t get out of your head because it’s always on the radio.
Then, there’s the maximum. This is the OUTLIER, the largest decline $AAPL hit in the time frame you’re looking at. It’s like the extreme—breathtaking and insightful.
And finally, the minimum—the low point. This is where $AAPL dipped its toes in the mud, giving you a clear picture of its worst days.
Now, why does this matter for traders? Because knowing these simple stats can supercharge your decision-making. When you understand not just the glory runs but also the scary plunges — and everything in between — you’re armed with knowledge. You can anticipate how $AAPL might behave in the future, decide if it’s the right time to buy more, sell, or just sit tight with a margarita and watch the chaos unfold.
By having this simple data at your fingertips, you’re not just another trader riding the waves; you’re an informed surfer picking the right waves to ride.
Let’s apply some of these simple concepts to $AAPL. First off, I simply measure the magnitude of the uninterrupted declines that $AAPL has experienced over the past decade and label them all on the chart. Every week when we at VantagePoint perform our A.I. stock study we do this same exercise and refer to it as the worst-case scenario. The purpose of this practical approach is to make volatility real by looking at the adverse price moves of a stock and understanding the risk that presents.
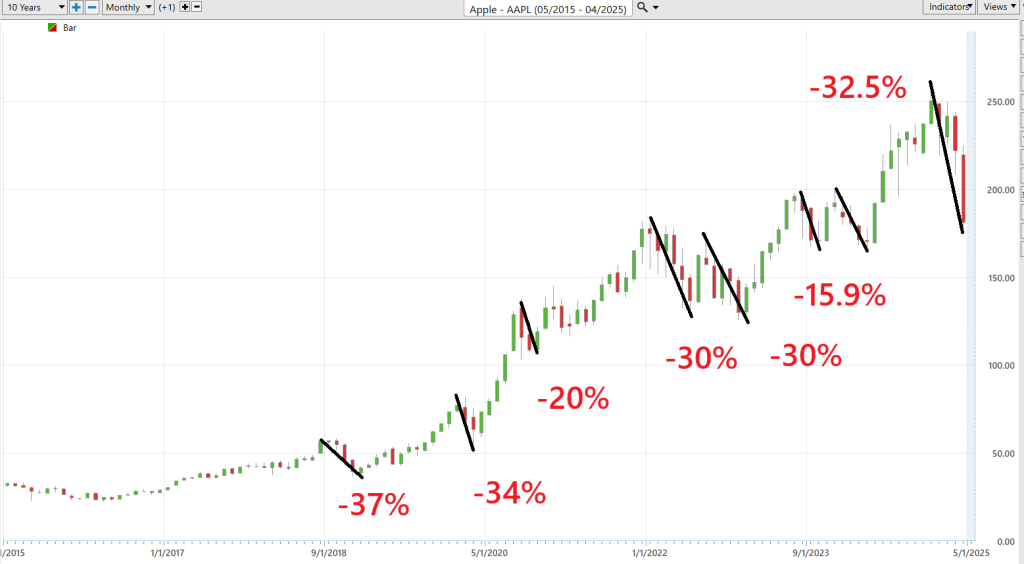
When I eyeball the $AAPL stock chart, I’m not just seeing a bunch of ups and downs — I’m seeing a goldmine of clues on when to make my move. Over the last decade, this tech juggernaut has had its fair share of tumbles, but here’s the kicker: the biggest nosedive was a heart-stopping 37%. Close on its heels was another gut-wrencher at 34%. And just recently, during the latest market freakout, $AAPL took a 32.5% plunge from its peak.
Now, hang on to your hat because this might sound too straightforward, but stick with me. My takeaway, after watching this rodeo play out time and again, is that any time $AAPL gets hammered down by 30% or more, you’re not just looking at a good buying opportunity —you’re staring down the barrel of a trading opportunity where the scales show that risk is minimal compared to reward. For the folks who sweat bullets over risk, consider this: historically, when $AAPL hits that 30% drop, it doesn’t just bounce back; it roars back.
So, how do I land on this nugget of trading gold? By zeroing in on the outliers among these declines. That’s where the treasure map is hidden. It’s not about overanalyzing every little wiggle in the stock’s price. It’s about spotting those rare, extreme moments when $AAPL gets too cheap to ignore.
That doesn’t necessarily mean you have to come out and buy it. But it does mean that the probabilities strongly favor that it will not decline much further.
And that, my friends, is how you sift through a decade of market madness to pinpoint when a stock is screaming buying opportunity — or for the cautious, when it’s unlikely to drop much further. It’s all about distilling the chaos down to the crystal-clear moments that spell opportunity.
I refer to this as RISK radar or outlining the worst-case scenario from a large enough data sample.
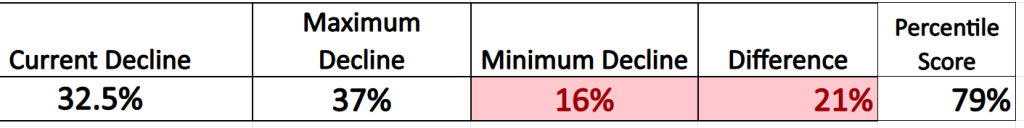
The current decline ranks as the third largest percentage loss when compared to historical declines. This method places the current decline in a specific order among past declines, providing a clear relative positioning. The current 32.5% drop places it in the 79th percentile of all recorded declines for this asset. This shows how severe the current decline is compared to all others, with a higher percentile indicating a more severe drop.
Let me lay it on you straight — human nature is the one constant in the chaotic dance of the stock market. It’s a timeless show where the same old dramas play out, just with different actors and on new stages. At the market’s peak, everyone’s wearing rose-colored glasses, toasting to never-ending prosperity. But when the bottom falls out? Suddenly, it’s like we’re extras in a doomsday blockbuster, bracing for the apocalypse on steroids.
Now, let’s talk about $AAPL. I crunched the numbers, sifted through the data, and got down to the nitty-gritty. I wasn’t playing the guessing game or relying on some hot tip that the President was about to slam the brakes on tariffs. No, sir. I was betting on something far more reliable: the unchanging tides of human emotion and historical patterns. $AAPL was in a nosedive, sure, but through the lens of an ‘uninterrupted decline analysis,’ it was clear we were approaching an extreme — a point where historically, things start to turn around because, frankly, they can’t get much worse.
This isn’t rocket science; it’s just understanding how the game is played. When fear grips the market, that’s when the savvy players watch closely. Because as sure as the sun rises, panic sells off assets too cheap, and calm eventually returns to scoop up the bargains. That’s the cycle, driven by the immutable law of human nature, and it was this law that told me the worst was likely over for $AAPL. Not insider info, just good old-fashioned market psychology and a solid grasp of past patterns thanks to VantagePoint’s artificial intelligence. Remember, the more things change, the more they stay the same, especially in the frenzied world of stock trading.
Outliers, those extreme values that stand out from the usual pattern, serve as beacons in the vast sea of data, signaling the unusual events that might otherwise skew our perception and decision-making. By studying these anomalies, we gain invaluable insights into the boundaries of what’s possible, both good and bad. For instance, in finance, outliers in investment returns can highlight the potential for extraordinary gains but also expose the risks of dramatic losses. Recognizing these extremes empowers us to manage risk more effectively, avoiding knee-jerk reactions to sudden market moves that might seem catastrophic but are, in fact, within the historical range of volatility.
Moreover, understanding outliers helps to reinforce the robustness of our strategies and systems. In areas like engineering, outliers in data can signal potential flaws or extraordinary circumstances that a system must be designed to handle, thus ensuring safety and functionality under all conditions. In a broader sense, when we are aware of the extremes, we can prepare ourselves psychologically and practically to face them without panic. This knowledge equips us to remain balanced and make informed decisions, reducing the potential for outliers to adversely affect our outcomes. Essentially, by acknowledging and planning for these statistical anomalies, we can temper their impact, turning potential threats into manageable challenges, and sometimes, opportunities.
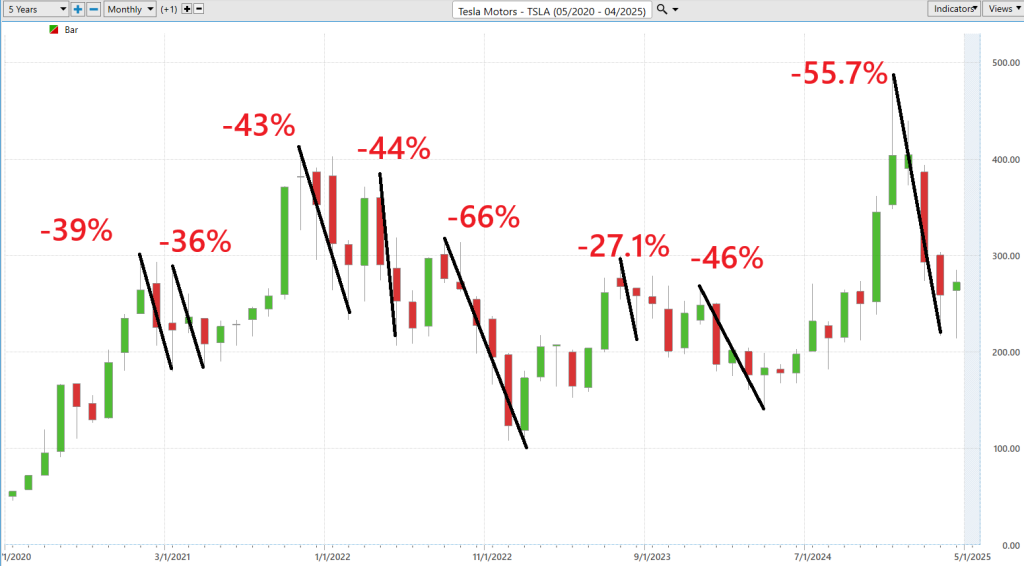
Here is what the RISK RADAR worst case scenario looks for Tesla ($TSLA). By measuring the magnitude of the declines, we can quickly recognize that the most recent decline was the second largest uninterrupted decline over the last 5 years. We can also see how volatile $TSLA has been as a stock. This analysis is not done to try and pick a bottom of a market. It is done for the purpose of maintaining a cool perspective when the markets are in turmoil. Listen up, when markets hit those wild extremes, they don’t just keep barreling on like a runaway train. Nope, they pause to catch their breath, or they snap back hard in a rally. It’s like they hit the wall at the end of a blind alley and have to make a quick decision, stand there dazed or turn around and sprint the other way.
Let’s dive deep into the murky waters of probability theory and fish out why it’s the secret sauce to understanding the wild swings in statistics — and, more importantly, in trading. See, when you flip a coin, the world expects a neat little 50/50 split between heads and tails. But every gambler and trader with salt in their game knows life ain’t that tidy. Sure, you might see heads pop up ten times straight, and while the math geeks start sweating over their calculators, the savvy trader leans back and smirks. Why? Because that kind of extreme is screaming at you: “This ain’t normal, buddy!”
Great trading is about sniffing out what’s normal and what’s not based on those extreme outcomes. It’s about asking, “What’s the real chance of seeing another head after ten in a row?” And here’s where it gets juicy — because in the chaos of those extremes, whether in coin flips or stock dips, there’s gold to be mined. By understanding that these outlandish runs are part of the game, traders can position themselves to capitalize when things swing back to normal, or as we call it in the biz, “regression to the mean.”
So, when you’re eyeballing those charts or sweating over the next trade, remember: probability isn’t just about the likely. It’s also about measuring how far off the rails things can go before they boomerang back. Mastering this can turn you from just another player at the table into the one running the game.
I always apply this simple and practical analysis whenever I am investing or trading an asset. Understanding the distinction between normal market fluctuations and genuine anomalies is akin to possessing an exquisite, finely-calibrated compass in the tumultuous sea of trading. For us as traders, this wisdom offers not just a defense against unpredictable storms but also points us toward hidden opportunities. While the average trader may be buffeted by every gust of panic or euphoria, the astute among us use this knowledge to remain steadfast, recognizing that true anomalies signal rare and potent opportunities for gain. This discernment allows us not merely to survive in a world rife with financial noise but to thrive, by making judicious moves that capitalize on the misunderstandings of others. In mastering this, we do not just participate in the markets — we command them.
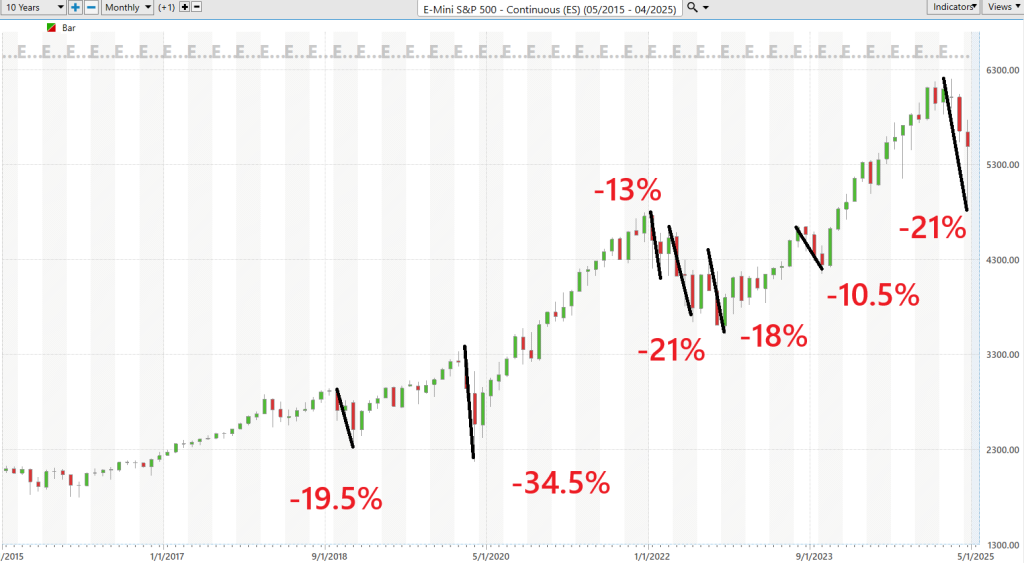
Here is a 10-year monthly chart of the S&P 500 Index. Observe how the most recent decline from peak to bottom amounted to 21%, which is tied for the second largest decline of the last decade. (The covid-19 decline of 34.5% is the outlier in this regard at –34.5%.)
Alright, buckle up because we’re about to slice through some trading wisdom that’s so simple, it’s almost criminal. You see, this practical little exercise I’m talking about is all about defining risk so that it is no longer theoretical. It’s all about spotting those sneaky turning points in market sentiment and momentum. Sounds like a piece of cake, right? But here’s where it gets tricky — many traders, hungry for quick wins, start seeing signals where there aren’t any. They try to force the puzzle pieces to fit, conjuring up conclusions that just ain’t there.
Let’s get back to basics: the single most crucial piece of intel you can arm yourself with is knowing the trend and figuring out how to saddle up right alongside it. Early this week, when I ran my numbers, they whispered back, “Buddy, the trend’s headed south, but hold your horses — we’re nudging an extreme here.” Understanding this helped me put a leash on my fear and a choke chain on my greed. And that’s the kind of clarity that can save your hide in this game. I’m laying this out here, hoping it does for you what it’s done for me — keeps you cool when the market’s hot and cautious when it’s not. So, give it a whirl, watch the extremes, the outliers, and remember in trading, sometimes the simplest tools can provide tremendous insight and wisdom.
Let me ask you a blunt question: Have you ever looked at a stock chart and wondered, “How do the pros always seem to know exactly when to get in… and when to get out?” It’s not magic. The truth is, they’re using tools that give them an edge — tools that take the guesswork out of trading. The most powerful of these tools? VantagePoint’s Artificial intelligence Trading Software. And right now, for a limited time, you have a chance to see how it works for free.
In this exclusive online trading masterclass, you’ll discover how A.I. is completely transforming the way smart traders analyze stocks, spot trends, and make high-probability moves — without spending hours glued to a screen. You’ll learn the same exact techniques that are helping everyday people find confidence in volatile markets… even if they’ve never traded a stock before. This isn’t theory. It’s a behind-the-curtain look at real tools and real trades — designed to show you what’s working right now.
You will walk away with insights most traders will never see — and the opportunity to sharpen your edge before the next big move hits the market. A.I. is leveling the playing field. And those who learn to use it now will have a serious head start. This masterclass is your invitation to be one of them.
Seats are filling fast, and once they’re gone, they’re gone. If you’re ready to trade smarter — not harder — and finally see what’s been missing from your strategy, reserve your spot now. Your future self will thank you.
I invite you to check it out at our next FREE live training.
Let’s be careful out there.
It’s not magic.
It’s machine learning.
THERE IS A SUBSTANTIAL RISK OF LOSS ASSOCIATED WITH TRADING. ONLY RISK CAPITAL SHOULD BE USED TO TRADE. TRADING STOCKS, FUTURES, OPTIONS, FOREX, AND ETFs IS NOT SUITABLE FOR EVERYONE.IMPORTANT NOTICE!
DISCLAIMER: STOCKS, FUTURES, OPTIONS, ETFs AND CURRENCY TRADING ALL HAVE LARGE POTENTIAL REWARDS, BUT THEY ALSO HAVE LARGE POTENTIAL RISK. YOU MUST BE AWARE OF THE RISKS AND BE WILLING TO ACCEPT THEM IN ORDER TO INVEST IN THESE MARKETS. DON’T TRADE WITH MONEY YOU CAN’T AFFORD TO LOSE. THIS ARTICLE AND WEBSITE IS NEITHER A SOLICITATION NOR AN OFFER TO BUY/SELL FUTURES, OPTIONS, STOCKS, OR CURRENCIES. NO REPRESENTATION IS BEING MADE THAT ANY ACCOUNT WILL OR IS LIKELY TO ACHIEVE PROFITS OR LOSSES SIMILAR TO THOSE DISCUSSED ON THIS ARTICLE OR WEBSITE. THE PAST PERFORMANCE OF ANY TRADING SYSTEM OR METHODOLOGY IS NOT NECESSARILY INDICATIVE OF FUTURE RESULTS. CFTC RULE 4.41 – HYPOTHETICAL OR SIMULATED PERFORMANCE RESULTS HAVE CERTAIN LIMITATIONS. UNLIKE AN ACTUAL PERFORMANCE RECORD, SIMULATED RESULTS DO NOT REPRESENT ACTUAL TRADING. ALSO, SINCE THE TRADES HAVE NOT BEEN EXECUTED, THE RESULTS MAY HAVE UNDER-OR-OVER COMPENSATED FOR THE IMPACT, IF ANY, OF CERTAIN MARKET FACTORS, SUCH AS LACK OF LIQUIDITY. SIMULATED TRADING PROGRAMS IN GENERAL ARE ALSO SUBJECT TO THE FACT THAT THEY ARE DESIGNED WITH THE BENEFIT OF HINDSIGHT. NO REPRESENTATION IS BEING MADE THAT ANY ACCOUNT WILL OR IS LIKELY TO ACHIEVE PROFIT OR LOSSES SIMILAR TO THOSE SHOWN.


