


This week’s ai stock spotlight is Johnson and Johnson ($JNJ)
Let’s dive into the meaty world of Johnson & Johnson (NYSE: $JNJ), a behemoth straddling the vast plains of the healthcare industry. Founded way back in 1886 by the Johnson brothers — Robert, James, and Edward — this giant has sunk its roots deep into New Brunswick, New Jersey, which remains its stronghold to this day.
We’re looking at a triple-threat operation here:
1. Pharmaceuticals – The big kahuna of the lot, pulling in the heaviest revenue with drugs zapping cancer and immunological disorders.
2. Medical Devices – Think tools for surgery, orthopedics, and heart-throbbers.
3. Consumer Health – From baby butts to adult acne, they’ve got something for everyone.
Post spinning off Kenvue, their consumer health segment, J&J has laser-focused on its pharmaceutical and medical device arms. But here’s the kicker: the market’s giving this pivot a lukewarm reception at best. The stock’s been sluggishly trading sideways, not really keeping pace with the broader market, a scenario that screams opportunity if you know where to look.
This company isn’t just big; it’s massive, employing about 144,000 globally. Their product mix isn’t just diverse; it’s like a well-oiled machine, cranking out profits year after year, with their fingers in many pies, including a whopping $30 billion acquisition of Actelion in 2017 to boost their pharmaceutical lineup.
Yet, it’s not all smooth sailing. The albatross around J&J’s neck? Talc litigation. Despite some clever legal footwork aiming to wall off liabilities through a subsidiary bankruptcy move, the dark cloud of legal battles looms large, potentially muddying investor sentiment. They’re pulling all the stops, including a subsidiary shuffle via bankruptcy protection to keep the wolves at bay.
On the brighter side, $JNJ isn’t just fighting fires; they’re lighting candles too, ranking top-notch in the 2024 Access to Medicine Index for slinging meds to corners of the globe that are dark with need. For the long-haul investor, J&J paints a picture of a fortress with a moat — AAA-rated, dividend-growing, and a bastion of healthcare exposure. Yet, it’s that same defensive posture coupled with a price that looks fair by historical standards, suggesting that perhaps the market’s tepid reaction might be an overreaction. In other words, if you’ve got patience, this might just be the entry point you’ve been waiting for.
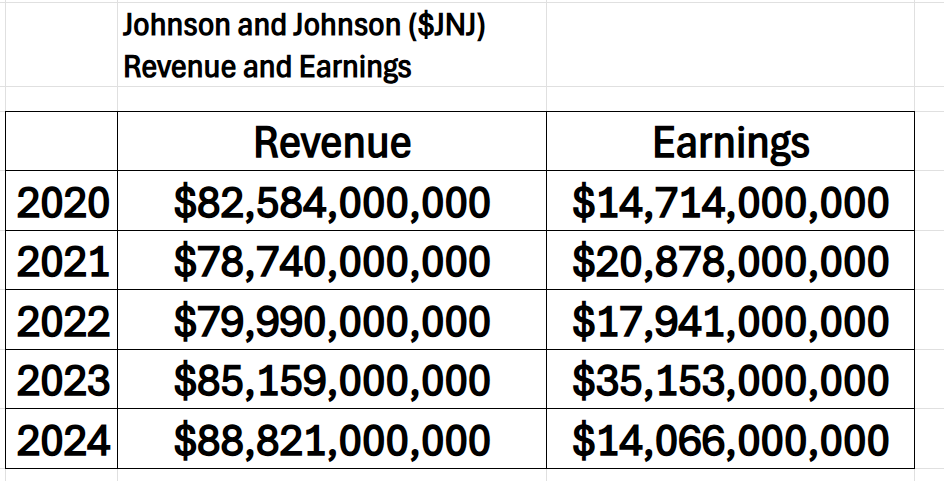
$JNJ’s earnings are swinging like a pendulum — up one year, down the next. The surge in 2023? That smells like a big, fat jackpot moment. Maybe they knocked a new product out of the park or snagged a juicy acquisition that paid off big time. But then, come 2024, we hit a snag. Earnings take a nosedive back to where we started. It screams of a morning-after headache, probably from shelling out big bucks on legal battles.
Johnson & Johnson has made a significant move to settle the vast array of lawsuits related to its talc products with a proposed figure of $8.2 billion. This strategic financial gesture aims to address claims that prolonged exposure to talc in products like Baby Powder may have led to cancer diagnoses among users. The settlement proposal not only seeks to resolve existing claims but also to account for future ones, underlining the ongoing complexities and serious health concerns tied to these products.
This financial resolution is monumental, marking one of the largest in the realm of mass tort bankruptcies. It reflects both the scale of the litigation Johnson & Johnson faces and the substantial public health implications it carries. As this legal chapter evolves, the implications for corporate accountability and consumer safety continue to be significant topics of discussion within the legal and corporate spheres.
This thrill ride? It’s not for the weak-kneed or the faint-hearted. Stick around, keep your eyes peeled, and watch how $JNJ plays their hand. There’s wisdom in these highs and lows, and if you’re sharp, you’ll catch the clues and cash in on the next upswing.
As 2025 rolls in, keep your eyes peeled. J&J’s next moves on pipeline innovation and strategic acquisitions will be critical. This is more than just a healthcare company; it’s a litmus test for whether a storied giant can dance nimbly in the face of industry upheavals and come out on top.
So, what’s the bottom line for the traders and investors skimming through this saga? $JNJ is a mixed bag of solid market stance and pesky legal wrangles. It’s a stalwart with a plan, a pipeline of innovations, and a knack for making strategic buys. Yet those legal clouds do loom, suggesting a need for a sharp eye before drawing the wallet. Can $JNJ keep this momentum in a market jittery over patent cliffs and Medicare redesigns? Stay tuned, because this beast isn’t just lying down.
In this stock study, we will look at an analysis of the following indicators and metrics which are our guidelines.
Wall Street Analysts Forecasts
52 Week High and Low Boundaries
Best-Case/Worst-Case Analysis
Vantagepoint A.I. Predictive Blue Line Indicator
Neural Network Forecast (Machine Learning)
Vantagepoint A.I. Daily Range Forecast
Intermarket Analysis
Our Suggestion
While we make all our decisions based upon the artificial intelligence forecasts, we do look at the fundamentals briefly, just to understand the financial landscape that $JNJ is operating in. This overview provides insights into $JNJ’s status and future outlook.
Wall Street Analysts Forecasts
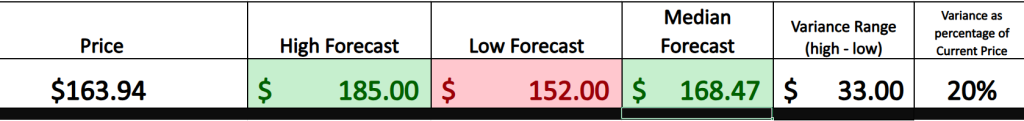
Fifteen analysts have cast their latest projections on Johnson & Johnson. Over the past three months, they’ve pegged the average price target for $JNJ at $168.47. This target sits in a range that stretches up to a hopeful $185.00 at the peak and dips to $152.00 at its base. What’s compelling here is that this average mark suggests a modest uptick of 2.76% from its current standing at $163.94.
In essence, the consensus here is cautiously optimistic, signaling a belief in $JNJ’s steady, if not explosive, growth potential amidst the ever-shifting market landscape. This is a narrative of calculated expectations, where seasoned analysts see growth, albeit at a measured pace.
We always advise that traders pay very close attention to the variance between the most bullish and most bearish forecasts. This metric provides insight to the expected volatility for $JNJ over the coming 12 months. Currently this level is $33 or 20% of the current price which is less volatile than the broader market.
52 Week High and Low Boundaries
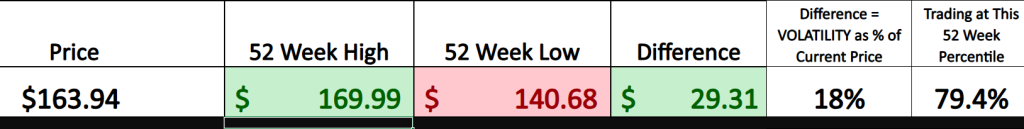
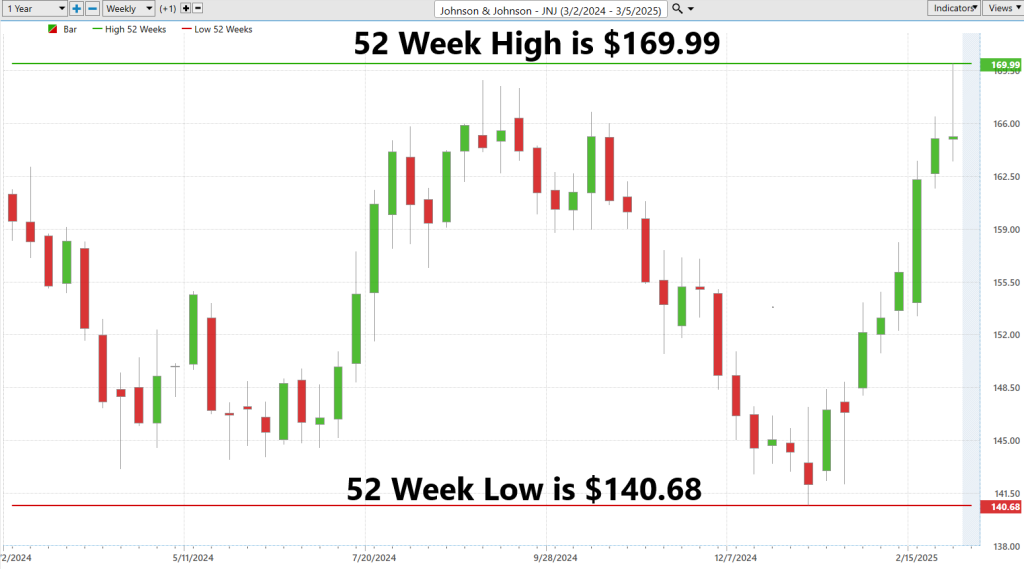
The 52-week range spans about $29.31, which translates to roughly an 18% fluctuation relative to the low ($140.68). For a large, established company like Johnson & Johnson, this level of volatility is moderate.
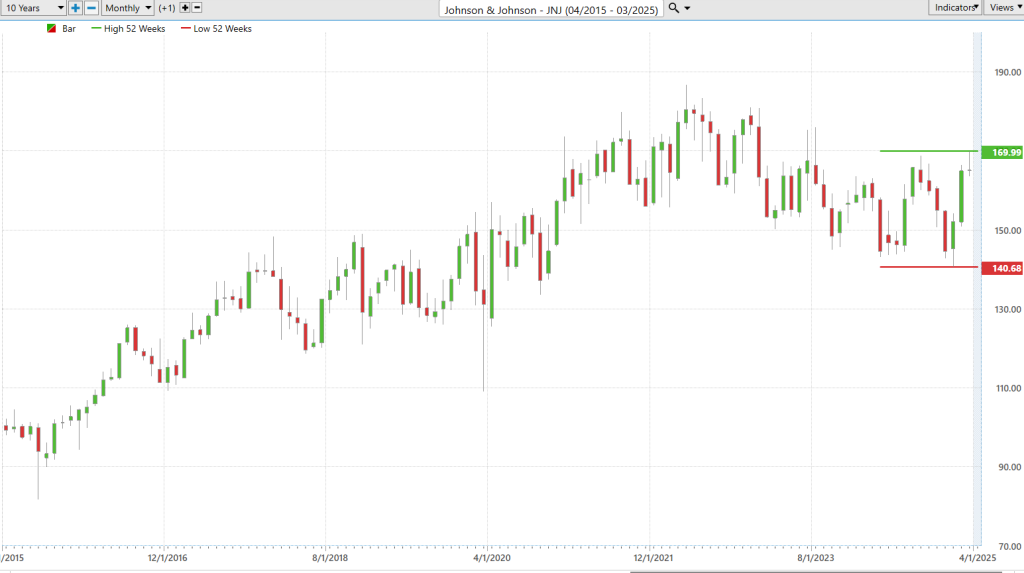
We always advise that traders pay very close attention to where a stock is trading relative to its 52-week range. While it is counter intuitive, companies that are making new 52-week highs are companies that are overcoming the barriers to their success. Power traders are advised to build a watchlist of companies that are testing and making new 52-week highs.
To get a more granular picture we advise traders to zoom out and look at the 10-year monthly chart. By doing so, you can get a better understanding of how the past year’s price action has factored into the current trajectory. We can clearly see that the last 3 years $JNJ has traded in a broad consolidation pattern with a slight downward bias.
Best-Case/Worst-Case Analysis
Do you remember Murphy’s Law? That old adage that if anything can go wrong, it will. Now, let’s take that little nugget of cynicism and throw it into the trading pits with Johnson & Johnson ($JNJ). The idea here is that you can get a pretty good idea of historical volatility by looking at the recent past.
Here’s the street-smart way to play it:
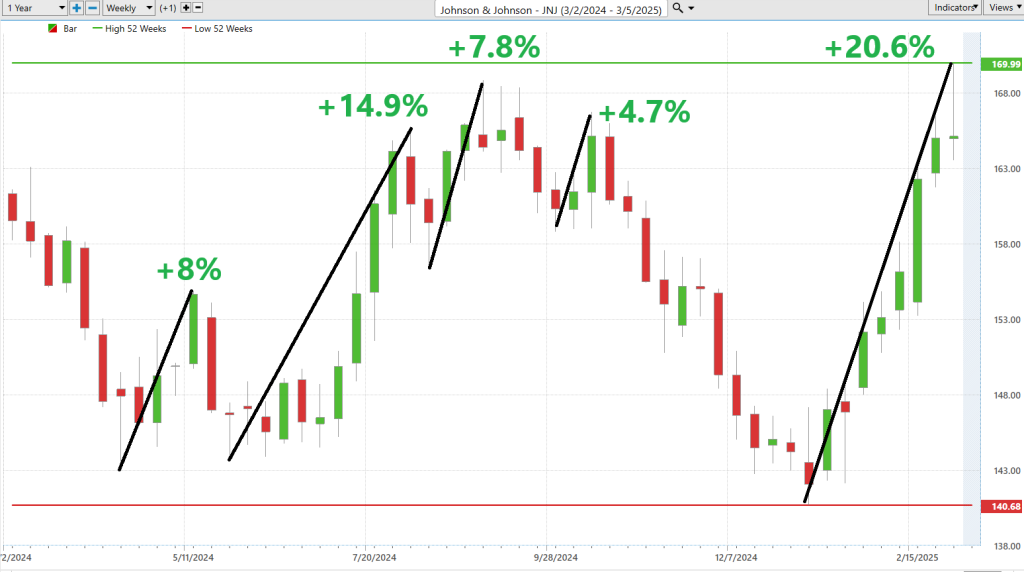
First, you need to scope out the biggest rallies — those moments when $JNJ surged from its lows to towering highs. We simply want to measure the uninterrupted rallies.
This isn’t just about capturing numbers. It’s about understanding the adrenaline-fueled peaks of the market, seeing just how high this beast can roar when the stars align.
Next, flip that script. Look for the heart-stopping drops, from the dizzying peaks straight down to the gut-wrenching lows. This part of the game is about measuring how far it can fall when the market throws a curveball. It’s about the potential disasters lurking when you least expect them.
First let’s look at the best-case analysis:
Followed by the worst-case analysis:

Why bother with this rollercoaster ride? Because trading is not for the faint-hearted. It’s for the battle-ready. It’s about preparing for the best but always ready for the worst.
This hands-on, no-nonsense approach to trading $JNJ isn’t just practical; it’s crucial. It arms you with the knowledge of what you’re really up against: the maximum potential profit and the darkest possible losses.
Understanding the risk and reward, the push and pull of the market’s extremes, gives you that grizzled insight to make the smart plays. And in the world of trading, especially with a giant like $JNJ, that’s not just good — it’s gold. So, remember Murphy’s Law, and use it like a streetwise trader: always ready, never naive.
Next, we move on to compare $JNJ to the broader market and to compare it volatility to the major market indexes.
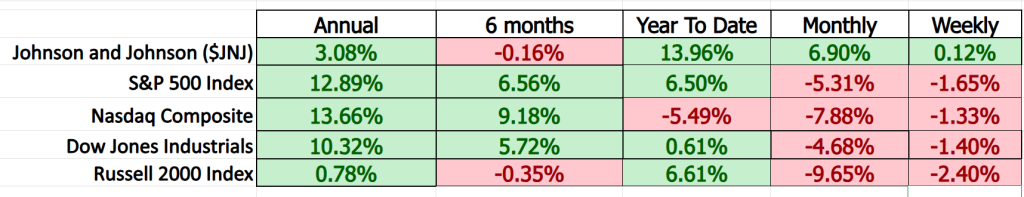
Here we have a mixed bag. Over the longer-term time frames, $JNJ has underperformed. But over the shorter-term time frames $JNJ has outperformed.
Johnson & Johnson ($JNJ) has a five-year beta of approximately 0.51. In the world of finance, beta is a measure of a stock’s volatility in relation to the overall market. A beta of 1 indicates that the stock’s price tends to move with the market. A beta less than 1 suggests that the stock is less volatile than the market, while a beta greater than 1 indicates higher volatility.
For $JNJ, a beta of 0.51 means that the stock is 49% less volatile compared to the broader market. This implies that $JNJ’s stock movements are generally not as extreme as the market’s movements.
Vantagepoint A.I. Predictive Blue Line
Alright, let’s cut through the noise and lay it down with some straight talk about our core trading strategies, especially when we’re maneuvering through the wild waters of Johnson & Johnson’s ($JNJ) market moves.
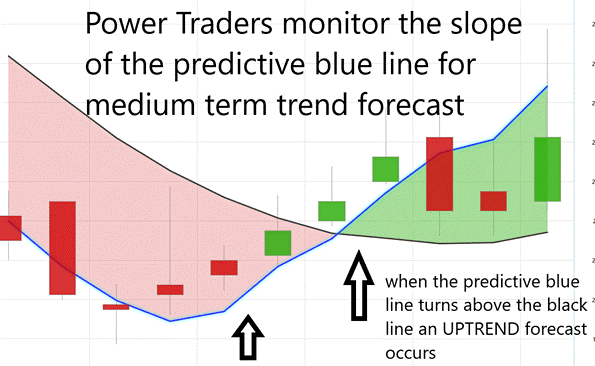
First up, the Predictive Blue Line — this isn’t just some fancy squiggle on a chart. It’s the backbone of our strategy, the main gauge we use to determine where $JNJ is headed. Think of this line as the seasoned captain of our ship, navigating through the choppy sea of market ups and downs. When this line points up, it’s a green light for buying; when it dips, it’s a red flag that prices might tumble.
Then there’s the golden concept of the Value Zone. When $JNJ hovers at or below this predictive line during an uptrend, that’s your cue to find buying opportunities. And when it climbs above during a downturn? Time to find selling opportunities, mate.
But what if that blue line starts to plunge? That’s our cue to possibly step back and watch from the sidelines or hedge our bets to shield against potential losses. It’s all about being smart and not getting caught in a storm.
Thanks to the wizardry of VantagePoint Software and it’s A.I. prowess, we’re not just making wild guesses here. We’ve got top-notch algorithms crunching numbers, predicting trends with an edge that only sophisticated AI tech can provide.
The predictive blue line is more than a tool — it’s our beacon in the fog, guiding us through the complex dance of financial markets. With $JNJ, this line is a critical ally, illuminating our path, showing us when to dive in and when to pull back.
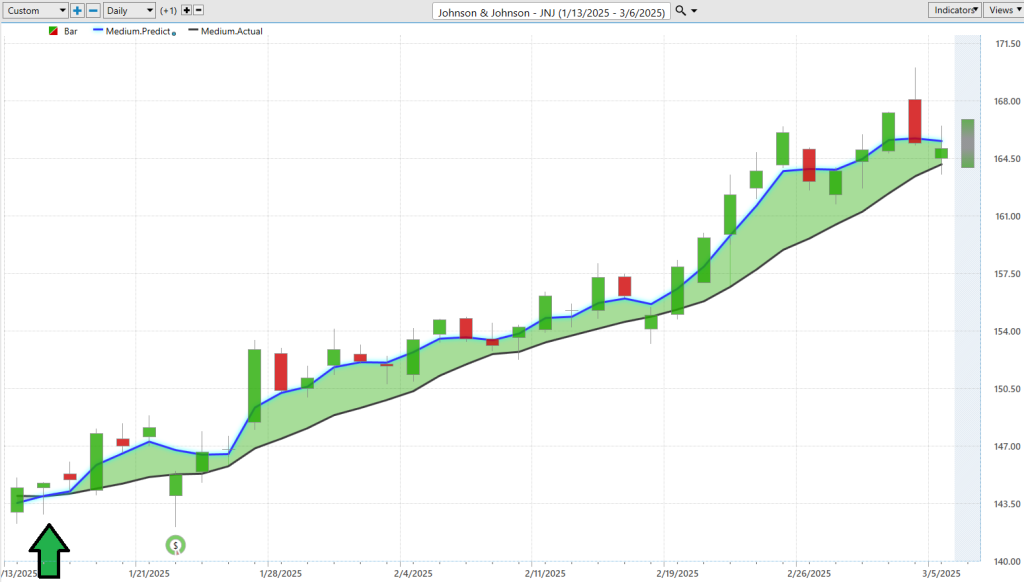
You can easily see that the artificial intelligence issued an UP forecast on January 13th. Prices have rallied over 14% since then.
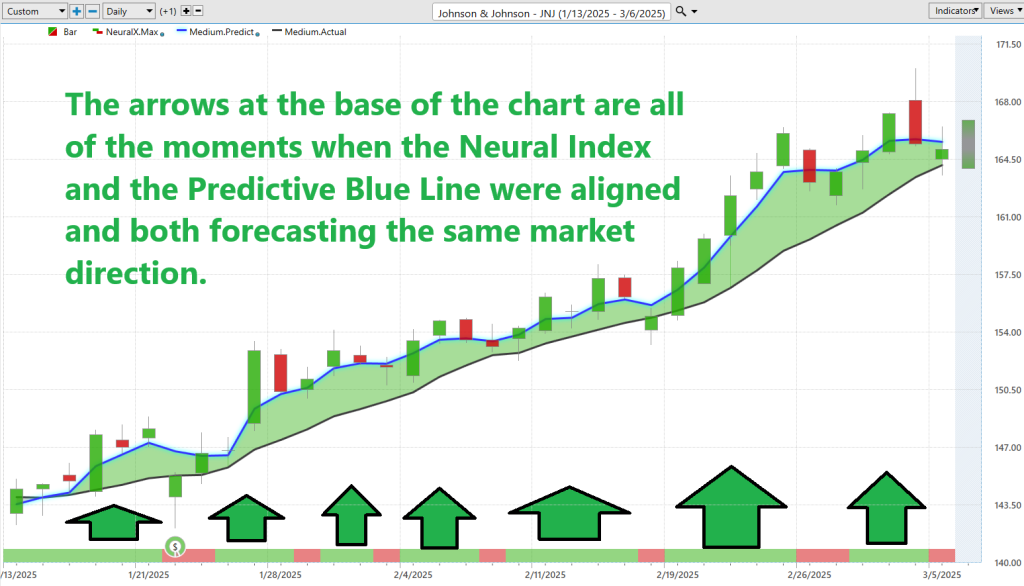
Neural Network Forecast (Machine Learning)
A neural network is a complex computer system modeled after the human brain. It’s designed to learn from vast amounts of data, identifying patterns that are too intricate or subtle for a human to notice. For traders, this technology is like having a super-powered assistant that never sleeps. It continually analyzes market data to recognize profitable trading opportunities or potential risks.
By harnessing the capabilities of a neural network, traders can make more informed decisions. The VantagePoint A.I. Neural Network system can predict market trends 48-72 hours in advance. It’s not just about faster processing but smarter processing, turning raw data into valuable insights that empower traders to act with greater confidence and precision. In essence, a neural network enhances a trader’s decision-making toolkit, allowing for more strategic, data-driven, and potentially profitable trading.
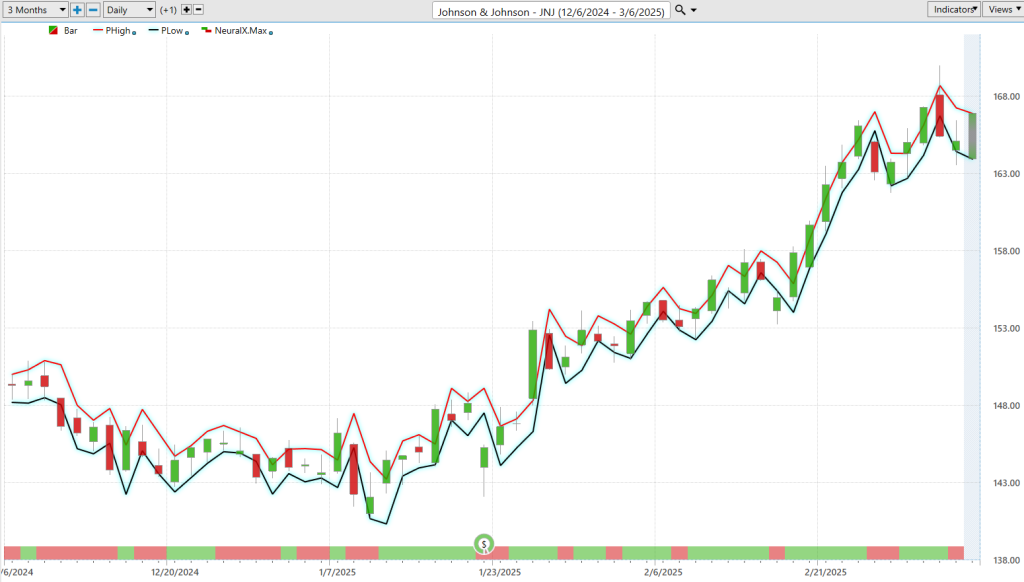
VantagePoint A.I. Daily Range Forecast
Machine learning and neural networks are redefining the landscape of trading with their acute ability to identify patterns and project market trends. Traders equipped with these advanced tools are not just responding to market movements; they are anticipating them with a precision once relegated to the realm of imagination. This transformation in trading harnesses the power of technology to merge clear vision, predictive insight, and sharp acumen, opening doors to opportunities that are unprecedented in their scope and potential.
Now, let’s delve into the practical application of these insights by examining the average trading ranges for Johnson & Johnson ($JNJ). We’ll break down the data by looking at the average trading ranges across daily, weekly, and monthly time frames over the last year to illustrate how these tools can be practically applied to enhance trading strategies.
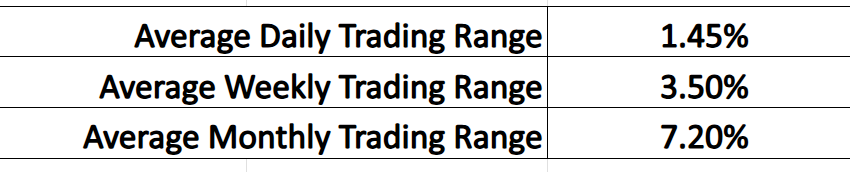
You can easily see that there is plenty of meat on the bone for a short-term trader to strike quickly.
Listen up…
These ranges show you exactly how wild (or tame) this stock moves — day by day, week by week, month by month.
But here’s the rub…
Knowing that is useless unless you know how to cash in on it.
That’s where the VantagePoint A.I. Software comes in. Every single day, it hands you a precision forecast — a literal heads-up — showing you where the market is likely to go before it makes a move.
Take a look at these forecasts. See how clear they are? It’s like having tomorrow’s trading map in your hands today.
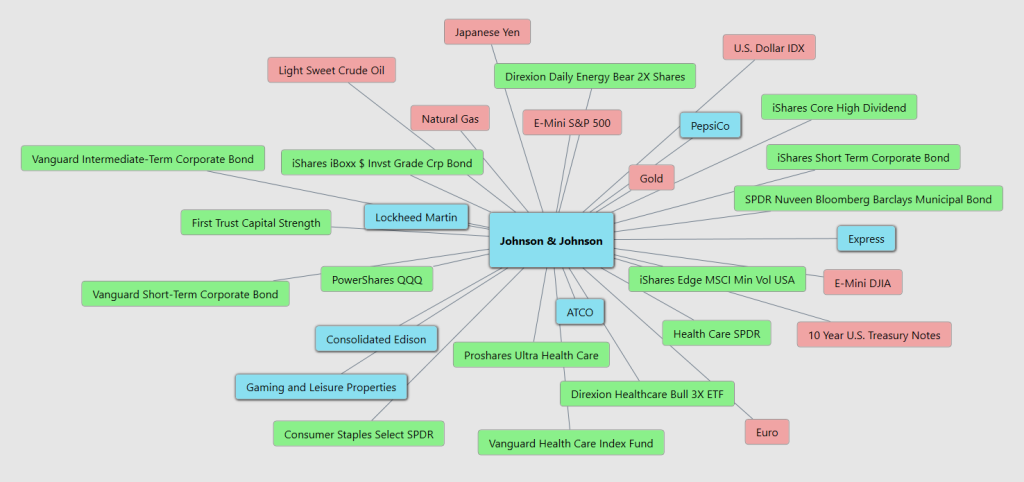
Intermarket Analysis
In the fast-paced world of stock market analysis, Johnson & Johnson ($JNJ) provides a compelling case study on how intermarket dynamics influence stock prices. Here’s the lowdown on $JNJ’s dance with the broader market elements, laid out with the no-nonsense clarity that seasoned traders appreciate.
$JNJ, a heavyweight in the NYSE, moves to the rhythm of the S&P 500. This company, entrenched in the necessity-driven healthcare sector, tends to maintain a steady pace even when the broader market sprints during bull runs. Its defensive nature offers shelter during market storms, appealing to those who prefer consistency over the thrill of high stakes. As of March 2025, if market recovery signals are strong, $JNJ’s stock might see a modest uptick, but don’t expect any dramatic leaps due to its historically low volatility.
Turning to the bond market, there’s an intricate tango between bond yields and $JNJ’s stock price. Typically, rising bond prices (and falling yields) signal economic downturns, making defensive stocks like $JNJ more attractive. However, if inflation continues pushing interest rates up, $JNJ could face challenges unless offset by strong earnings growth. The interplay here is critical, with $JNJ’s performance often hinging on the Federal Reserve’s interest rate decisions.
Commodities and $JNJ also share a complex relationship. Rising prices in commodities can squeeze profit margins, especially in manufacturing sectors reliant on materials like plastics and energy. Thankfully, $JNJ’s diversified portfolio and pricing power in pharmaceuticals and medical technology provide some buffer against these pressures. However, sustained high commodity prices could still spell trouble by dampening healthcare spending.
Currency fluctuations further color $JNJ’s financial narrative. With a significant portion of its revenue coming from international markets, a weaker U.S. dollar boosts its bottom line by making its exports more competitive. Conversely, a strong dollar could hurt its earnings repatriated from overseas, affecting stock valuation in the process.
Lastly, sector-specific and internal company factors such as pharmaceutical innovation, MedTech advancements, and litigation risks play pivotal roles. $JNJ’s ability to navigate patent expirations and push new drugs through its pipeline often determines its market position. Moreover, its reputation as a Dividend Aristocrat attracts investors looking for reliable income, bolstering its stock during low-yield periods.
In summary, $JNJ’s stock price is a barometer of multiple market forces. As of early 2025, the outlook is mixed with potential headwinds from rising interest rates and commodity prices, alongside possible tailwinds from a weaker dollar and strong sector-specific performances. Investors should monitor these indicators closely, as they will likely dictate $JNJ’s market trajectory in the near term.
The following graphic illustrates the 31 top drivers of $JNJ price.
Our Suggestion
Johnson & Johnson ($JNJ) just wrapped up two crucial earnings calls — Q3 and Q4 2024 — and if you’re serious about understanding where this stock is headed, here’s what matters.
The Numbers Don’t Lie. Sales grew around 5% both quarters, landing at $22.5 billion each time. That’s solid. But EPS took a hit — first from special charges, then from costly acquisitions. Full-year 2024 EPS? $9.98 — short of expectations.
Why? Because $JNJ is spending like crazy to stay ahead. They dropped $50 billion on R&D and acquisitions last year, betting big on future blockbusters in oncology, immunology, and medical devices.
$JNJ isn’t the same company you grew up with. After spinning off Kenvue, they’ve gone all-in on two things: Innovative Medicine and MedTech. That’s it. Every dollar they spend is about dominating those spaces.
What is standing in their way?
- China’s economy. It’s slowing down, and that’s bad news for MedTech sales overseas.
- Litigation hell. Talc lawsuits are still hanging over their head like a guillotine. That problem isn’t going away. Analysts are expecting them to up the ante to try and settle their class action lawsuit.
- Where’s the Upside? New products. They launched 15 in 2024. If even a few become blockbusters, $JNJ’s future looks very bright.
- MedTech dominance. They’re already a giant — and now they’re expanding into high-growth cardiovascular niches with tech nobody else has.
- Global tailwinds. Nearly half their sales come from outside the U.S., and if the dollar weakens, that’s free money for $JNJ.
2025 isn’t about smashing records — it’s about surviving the storm and positioning for the future. If $JNJ nails its product launches, handles biosimilar losses, and keeps lawyers off their back, this stock could be a sleeping giant.
If they miss? Investors get crushed.
Watch the pipeline. Watch the lawsuits. And follow the money — because $JNJ is betting billions that its next generation of products will make the old ones look like rounding errors.
Their next earnings call is scheduled for April 15, 2025.
$JNJ will provide numerous trading opportunities over the coming year. We advise placing it on your watchlist and follow the VantagePoint A.I. Daily Range forecast for guidance.
Practice good money management on all of your trades.
It’s not magic.
It’s machine learning.

Disclaimer: THERE IS A HIGH DEGREE OF RISK INVOLVED IN TRADING. IT IS NOT PRUDENT OR ADVISABLE TO MAKE TRADING DECISIONS THAT ARE BEYOND YOUR FINANCIAL MEANS OR INVOLVE TRADING CAPITAL THAT YOU ARE NOT WILLING AND CAPABLE OF LOSING.
VANTAGEPOINT’S MARKETING CAMPAIGNS, OF ANY KIND, DO NOT CONSTITUTE TRADING ADVICE OR AN ENDORSEMENT OR RECOMMENDATION BY VANTAGEPOINT AI OR ANY ASSOCIATED AFFILIATES OF ANY TRADING METHODS, PROGRAMS, SYSTEMS OR ROUTINES. VANTAGEPOINT’S PERSONNEL ARE NOT LICENSED BROKERS OR ADVISORS AND DO NOT OFFER TRADING ADVICE.


