


| This Week’s a.i. Stock Spotlight is AFLAC ($AFL) |
Aflac Incorporated, known for the iconic Aflac Duck, is a leader in the insurance industry specializing in supplemental health and life insurance. Founded in 1955 by John, Paul, and Bill Amos, Aflac has grown to become a Fortune 500 company, recognized for its innovative insurance products that provide financial protection for unexpected medical expenses. The company made a significant impact in Japan by introducing the first cancer insurance policy in 1974, a pioneering move that cemented Aflac’s reputation and leadership in the supplemental insurance market. Today, Aflac Japan accounts for about 70% of the company’s total revenue, underscoring the critical importance of this market to its overall success. Headquartered in Columbus, Georgia, Aflac’s commitment to innovation and customer care is evident in its investment in digital platforms and strong corporate culture.
Beyond its financial achievements, Aflac is deeply committed to philanthropy, having donated over $140 million to charitable causes, including significant contributions to pediatric cancer research and disaster relief efforts. The company’s dedication to shareholder value is reflected in its track record of increasing annual dividends for more than 30 consecutive years, showcasing its financial strength and stability. Despite its reliance on the Japanese market, Aflac continues to innovate, expanding its product offerings and leveraging technology to streamline operations. With its well-recognized brand, extensive market reach, and commitment to corporate responsibility, Aflac stands as a beacon of reliability and trust in the insurance industry.
Aflac’s core product offerings include:
Cancer Insurance: This remains Aflac’s most significant revenue generator, especially in Japan, where the product meets specific local demands.
Accident Insurance: Covering various unexpected medical and non-medical expenses.
Critical Illness Insurance: Providing financial protection against severe illnesses.
Life Insurance: Offering a range of life insurance policies tailored to different customer needs.
Aflac is considered a leader in the supplemental insurance market, particularly in Japan, where it holds a dominant position. In the U.S., it competes strongly in the supplemental health insurance sector, with a reputation for innovation and customer service.
AFLAC has several competitors that are competing with it for market share. Among them are MetLife ($MET), Cigna ($CI), Prudential Financial ($PRU), Unum Group ($UNM) and Lincoln National Corporation ($LNC).
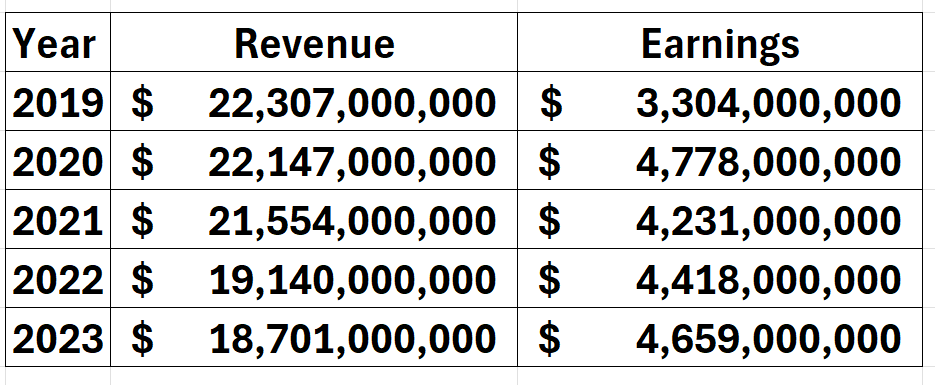
Aflac recently reported robust earnings, beating Wall Street estimates with strong premium growth and effective cost management. This was largely driven by solid performance in the Japanese market, which continues to be a key revenue driver. However, when you study $AFL Revenue and Earnings over the last 5 years you walk away with a perspective that revenue has contracted 14% but earnings on the other hand have grown 33%. Rarely do you see a revenue downturn accompanied by such a strong increase in earnings.
Warren Buffett’s Berkshire Hathaway is a significant investor in Aflac. In 2020, Berkshire Hathaway acquired a substantial stake in Aflac, making headlines as a notable investment in the insurance sector. As of the most recent filings, Berkshire Hathaway owns approximately 7% of Aflac’s outstanding shares, making it one of Aflac’s largest shareholders. Warren Buffett’s interest in Aflac aligns with his investment philosophy of choosing companies with strong fundamentals, consistent profitability, and shareholder-friendly policies such as regular dividend payments. Aflac’s dominant market position in the supplemental insurance industry, particularly in Japan and the U.S., and its financial stability, likely attracted Buffett’s attention, further cementing Aflac’s reputation as a reliable and sound investment.
In this stock study we will look at the following metrics and indicators.
- Wall Street Analysts’ Estimates
- 52-week high and low boundaries
- The Best Case – Worst Case Scenarios
- Vantagepoint A.I. Predictive Blue Line
- Neural Network Forecast
- Daily Range Forecast
- Intermarket Analysis
- Our trading suggestion
We don’t base decisions on things like earnings or fundamental cash flow valuations. However, we do look at them to better understand the financial landscape that a company is operating under.
Wall Street Analysts’ Estimates
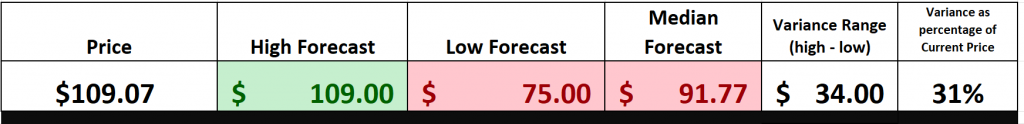
Thirteen top analysts have weighed in on Aflac’s stock, setting their 12-month price targets. The average forecast sits at $91.77, with estimates ranging from a low of $75 to a high of $109. If the analysts are right, the average target suggests a potential drop of 15.86% from the current stock price of $109.07.
We always pay close attention to the variance between the high and the low forecasts as that provides us with a very good barometer of expected volatility over the coming year. Currently this variance is 31%. We can also see that currently the stock is trading at the upper boundary of analysts’ expectations.
52-Week High/Low Boundaries
The 52-week boundaries for a stock refer to the highest and lowest prices that the stock has traded at over the past year. These metrics are closely watched by analysts and traders, serving as a kind of report card for the stock’s performance. The 52-week high shows the peak price point, indicating the maximum value investors were willing to pay during the year, while the 52-week low reveals the lowest price, highlighting the most pessimistic views on the stock’s value. By examining these boundaries, investors can gain insights into market sentiment and the stock’s price momentum over time.
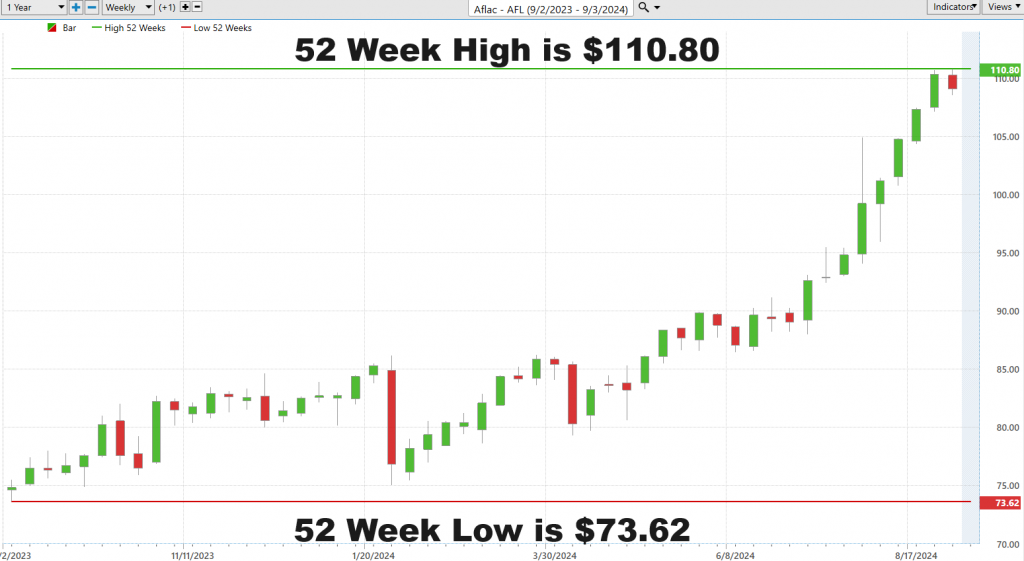
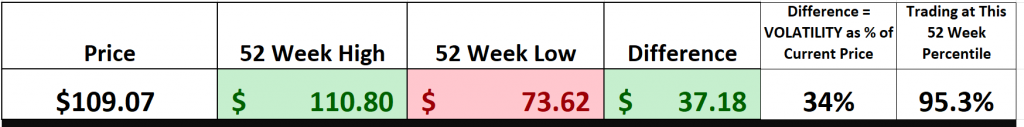
Over the last 52 weeks $AFL has traded as high as $110.80 and as low as $73.62. The annual trading range was $37.18 which tells us that the annual historic volatility of $AFL over the past 52 weeks was 34%.
Analyzing the variance between the 52-week high and low prices provides a measure of historic volatility. This is done by calculating the annual trading range and expressing it as a percentage of the current stock price. This metric helps investors understand how much the stock’s price has fluctuated over the past year. If the next 52 weeks mirror the past 52, it would be considered normal to see the stock’s price move up or down by a similar percentage. In essence, this measure of volatility helps investors anticipate potential price swings, aiding them in making informed decisions about buying, holding, or selling the stock. It provides a realistic expectation of price movement, helping investors manage risk and align their investment strategies with their risk tolerance.
We can zoom out to get a longer terms perspective by analyzing the 10-year chart. This longer-term perspective allows us to see where the stock is trading in relation to the longer-term trend.

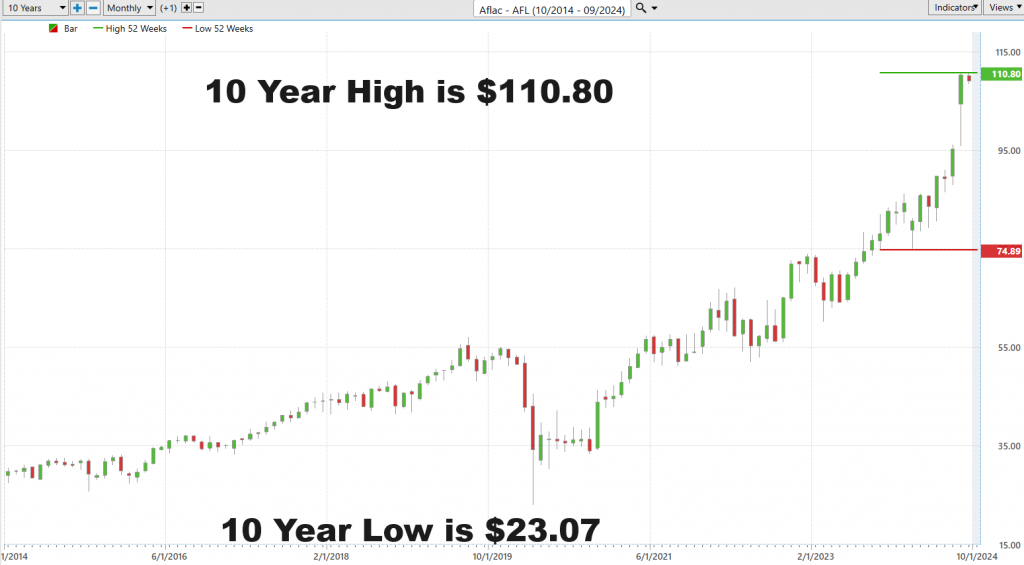
This perspective lets us conclude that $AF is making new 52-week highs and new 10-year highs. For the past year it has been setting new 10-year highs for 11 of the last 12 months. Finding assets that are continuously making new 52 week and new 10-year highs is one of our favorite trading setups. It tells us that from purely a price perspective the stock is overcoming all obstacles related to its future growth.
Best-Case/Worst-Case Analysis
In the trading arena, many novices dive headfirst into the market, driven by greed and dangerous overconfidence, failing to grasp the inherent risks at play.
Here’s a fundamental truth every trader must understand, success isn’t measured by the eye-popping profits from winning trades, but rather by how well one minimizes losses when the market turns against them. This is what separates the seasoned traders from the rookies.
Effective risk management starts with a careful analysis of market volatility, not through guesswork but by systematically examining price charts from the past year. These charts aren’t just visual aids; they’re vital tools that map out market sentiment and volatility, highlighting the peaks of investor optimism and the troughs of collective fear. They show the swings from bullish exuberance to bearish downturns, giving traders a clear, empirical view of market movements. Our goal is to quantify both the best-case and worst-case scenarios from the past year.
Breaking down these scenarios—buying low and selling high versus buying at the peak and selling at the bottom—tells us a critical story. While the declines can be steep, they often look modest compared to the preceding rallies, suggesting a risk-reward dynamic that could favor the investor who is both bold and cautious.
In other words, we can measure the worst declines against the strongest rallies.
We begin with the best-case scenario analysis:
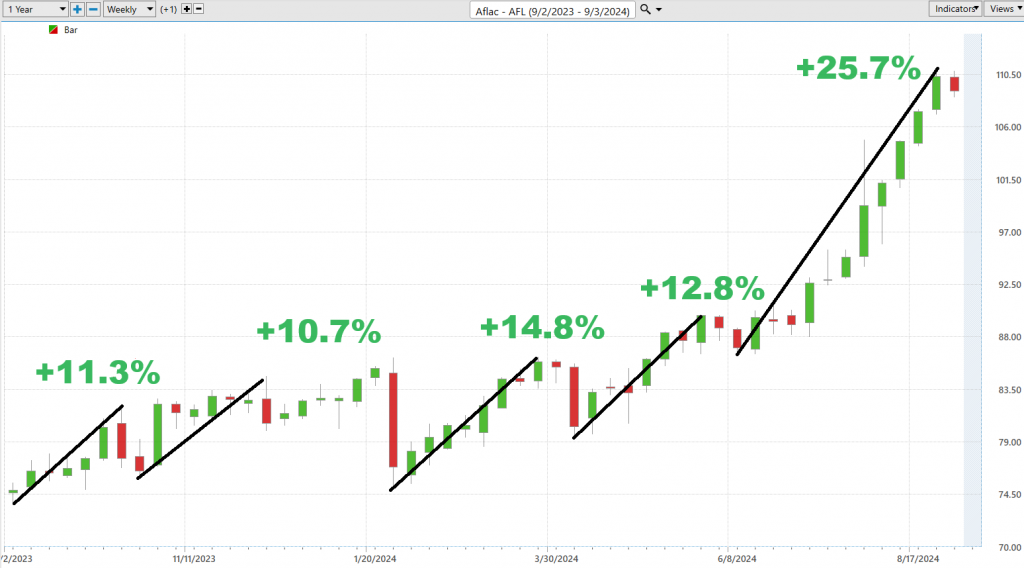
Followed by the worst-case scenario analysis:

With this practical approach to understanding market dynamics, traders can set realistic expectations and develop strategies accordingly. This knowledge equips you to navigate market volatility with clear insights, protecting your trades against the unpredictable swings of the financial markets.
We highly recommend that before you enter the market that you do this very simple exercise because the outcome is that you will know what the worst uninterrupted declines and rallies have been over the past year.
Now let’s compare $AFL to the broader stock market indexes to get a better understanding of comparative volatility and returns over multiple time frames:
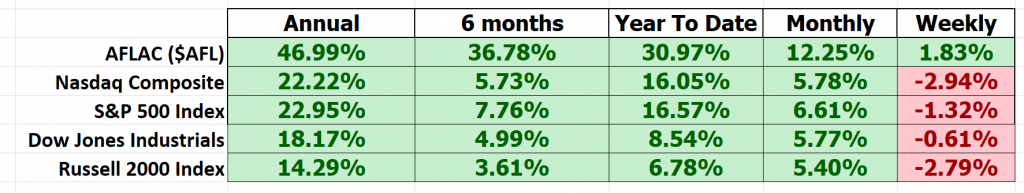
We can see that $AFL has outperformed across all time frames.
Now let’s dig deeper and get more granular to see how $AFL has performed against its main competitors:
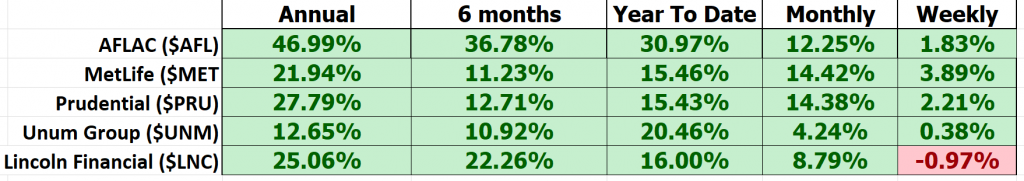
$AFL wins handily against its competitors as well across all the longer-term time frames.
Lastly, we look at BETA. The 5-year beta of Aflac ($AFL) is approximately 1.00.
Beta is a way to measure how much a stock’s price moves compared to the overall stock market. Imagine the stock market is like a big roller coaster. Some stocks move up and down a lot when the market moves, like riding in the front seat of the roller coaster. Other stocks move less, like sitting in the middle of the roller coaster.
If a stock has a beta of 1.00, like Aflac, it means that its price tends to move up and down almost exactly in line with the overall market. So, if the market goes up by 10%, Aflac’s stock is likely to go up by around 10%, and if the market goes down by 10%, Aflac’s stock might also go down by about 10%.
– Beta greater than 1: The stock is more volatile than the market (moves more).
– Beta less than 1: The stock is less volatile than the market (moves less).
– Beta of 1: The stock moves in sync with the market (like Aflac).
In simple terms, beta helps investors understand how much risk or movement they might expect from a stock compared to the overall market.
To summarize, $AFL it has outperformed its competitors, the broader market and has a volatility equal to the broader market. For these reasons $AFL should be on your trading radar as it will present numerous trading opportunities over the coming year.
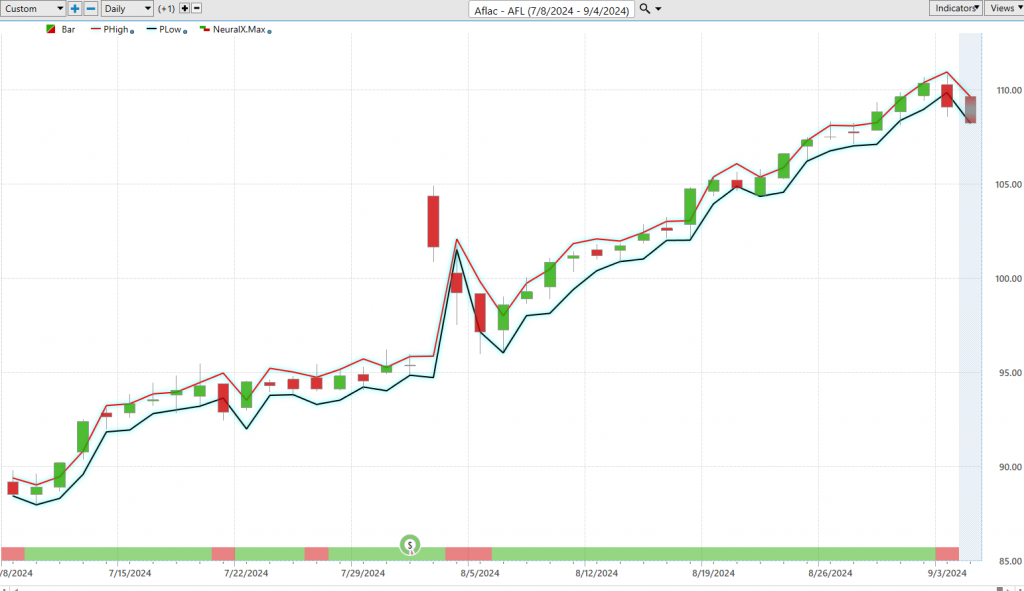
Vantagepoint A.I. Predictive Blue Line
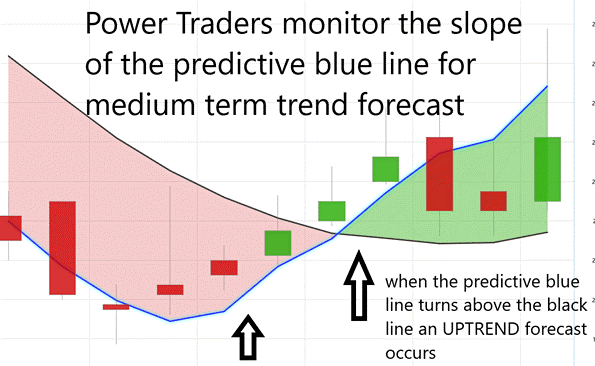
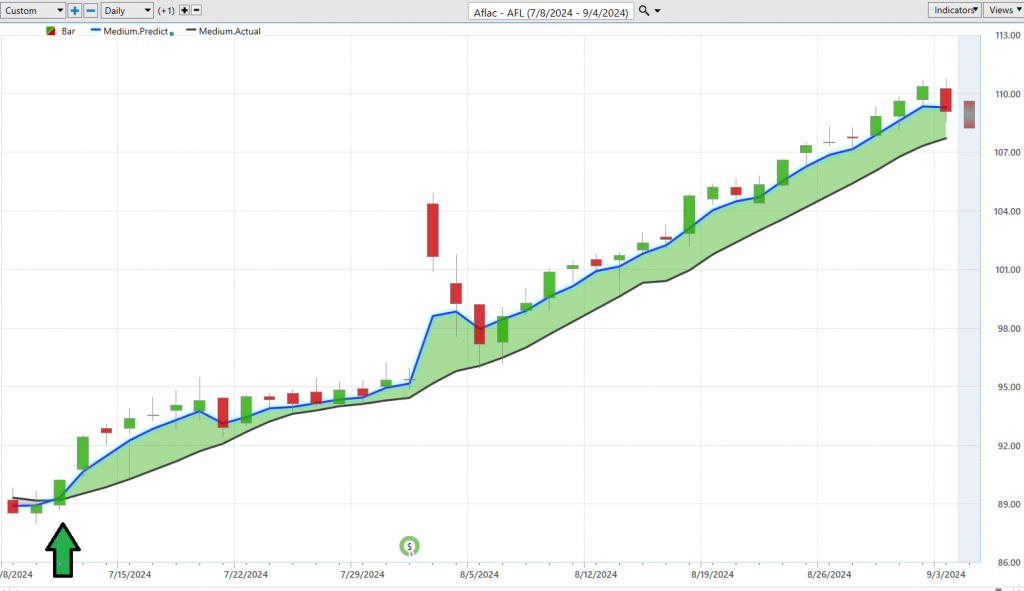
Let’s dive into the strategic framework that drives A.I. market predictions for $AFL, led by the powerful VantagePoint Software. At the heart of this analysis is the predictive blue line, which, through a cutting-edge mix of artificial intelligence and intermarket analysis, identifies underlying market trends. Think of it as your North Star, guiding you through the unpredictable waves of the financial markets.
Here’s what you need to focus on: the slope of the predictive blue line and how it interacts with the price. When this blue line closes above the black line, it signals a trend forecast.
Our guiding principles are straightforward:
– The direction of the predictive blue line sets the trend forecast and the overall path for $AFL.
– The VALUE ZONE is identified as the area to look for buying opportunities when prices are at or below the predictive blue line, and for selling opportunities above it during a downtrend.
– As the predictive blue line slopes downward, it signals to traders that lower prices may be on the horizon, prompting them to either step back or hedge their positions.
VantagePoint Software, with its advanced A.I., keeps traders informed of trend forecasts by tracking the slope of the predictive blue line.
In today’s fast-paced markets, traders are constantly searching for effective tools and strategies to navigate the financial landscape. Enter VantagePoint Software, a leader in artificial intelligence, offering traders precise insights into risk and reward. The predictive blue line acts as a financial compass—an upward slope means a bullish trend, creating buying opportunities, while a downward slope indicates a bearish trend, signaling potential selling points.
This advanced tool not only predicts trends but also helps traders align their strategies with the best moments to act, maximizing the chances for significant gains.
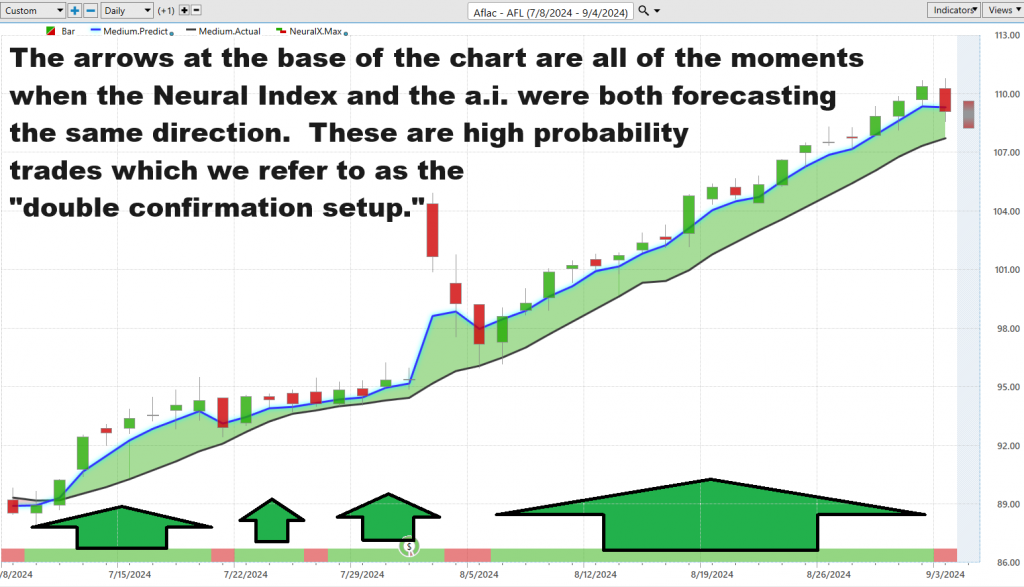
Neural Network Indicator (Machine Learning)
A neural network is a type of computer system that tries to work like the human brain. It’s made up of lots of tiny, interconnected nodes, like a web, which can learn to recognize patterns. Imagine a big group of friends all talking to each other and sharing what they know; that’s how these nodes work. They look at huge amounts of information, like stock prices, volume, correlations or earnings, and try to find patterns that might help predict what will happen next.
Neural networks are important because they can help traders make better decisions. By recognizing patterns that are too complex for humans to see, they help traders understand when to buy or sell stocks. This can lead to more accurate predictions, fewer mistakes, and a better chance of making money in the markets.
In the fast-paced world of trading, neural networks have become powerful tools that mimic the brain’s ability to analyze data. Think of them as a network of connected nodes, each playing a role in spotting complex patterns within massive datasets, giving traders advanced pattern recognition abilities.
Neural networks bring a lot to the table for traders: they reduce human error, boost prediction accuracy, and deliver real-time insights into new market trends. These smart systems are always learning and refining their predictions, making them essential in the ever-changing market environment.
VantagePoint Software Daily Price Range Prediction
Let’s dive into the cutting-edge technologies that are transforming the trading game: artificial intelligence (A.I.), machine learning, and neural networks. For traders looking to nail down the next day’s trading range with precision, these tools are indispensable. By combing through vast amounts of historical market data, A.I.-driven solutions uncover the patterns, trends, and correlations that influence price movements.
Machine learning algorithms shine at spotting these patterns, while neural networks take predictive modeling to the next level. This dynamic duo empowers traders to forecast future price shifts with impressive accuracy. Real-time analysis enables traders to stay agile, adapting to the market’s constant shifts. Being able to precisely define the trading range is crucial for managing risk and making informed decisions. Simply put, A.I. gives traders a powerful edge, elevating their ability to analyze data, spot opportunities, and optimize trading strategies in the fast-paced world of finance.
The first thing we want to do is to get a handle on real world volatility. Here are the average trading ranges on a daily weekly and monthly basis:
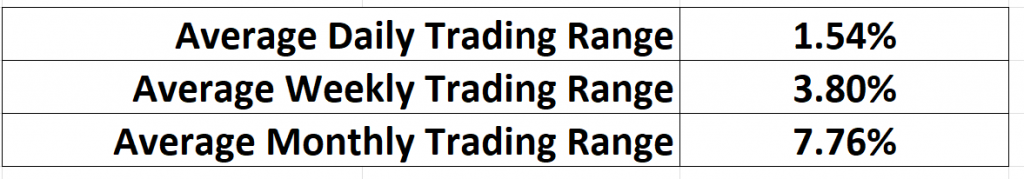
But the challenge now is how to apply this data in real time to the market. The real challenge that traders face every day is knowing in advance the ideal entry and exit points. This is where the VantagePoint’s A.I. software shines.
Now, let’s turn our attention to the Daily Range Forecast chart, a vital tool for short-term swing traders. This isn’t just any chart; it acts as a predictive oracle, mapping out the expected path for each trading day.
In the fast-paced trading arena, precision is not a luxury; it’s a must-have. That’s where VantagePoint A.I.’s Daily Range Forecast comes into play. Powered by A.I., machine learning, and neural networks, this tool goes beyond simple number-crunching—it deciphers the market’s pulse for every trading session. Picture it as your personal guide in the trading world, helping traders skillfully navigate market swings and pinpoint the best entry points. In trading, staying ahead isn’t just advantageous; it’s critical.
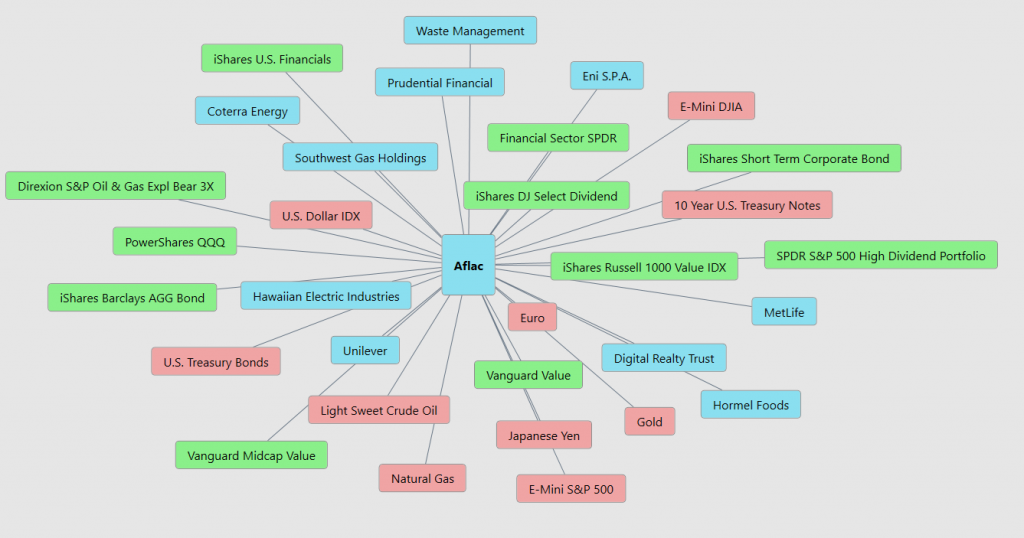
Intermarket Analysis
Intermarket analysis is like being a detective in the world of trading. Imagine you have a bunch of different puzzles, like the stock market, the bond market, the currency market, and the commodity market (things like oil and gold). Each puzzle affects the others in some way, kind of like how weather in one place can affect the weather somewhere else.
For traders, intermarket analysis means looking at all these different markets together to see how they are connected. By understanding these connections, traders can get clues about where prices might go next. For example, if oil prices go up, it might affect the stock prices of companies that use a lot of oil, like airlines. By using intermarket analysis, traders can make smarter decisions about when to buy or sell, based on how these different markets interact with each other.
In today’s connected world, knowing what causes market prices to change is important for trading success. This is where intermarket analysis helps. It looks at how different things like stocks, bonds, currencies, and commodities affect each other to find bigger market trends and trading opportunities.
The real power of intermarket analysis is that it gives traders a complete view of how markets work. By seeing how different markets are connected, traders can understand what drives price changes and predict trends. This helps them make smarter decisions and manage risk better.
Louis Mendelsohn, the founder of VantagePoint A.I., a leader in trading and technical analysis, made big contributions to intermarket analysis with his VantagePoint A.I. trading software. His work helps traders look at multiple markets at once to get valuable insights.
By studying how different assets like stocks, bonds, and commodities interact, traders can spot relationships. For instance, if stocks go up and bonds go down, or if the price of oil affects the value of certain currencies. This helps traders predict what might happen in one market by watching changes in others. If commodity prices go up, it might mean higher inflation, which can change currency values and interest rates.
Intermarket analysis also helps traders decide when to buy or sell by noticing patterns. If stock prices are rising while bond yields are falling, it could be a sign that stocks are going up.
In short, intermarket analysis gives traders a better understanding of how markets are connected. Using these insights can give them an advantage and improve their trading results.
Our Suggestion
Look out for $AFL’s next earnings release expected on November 06, 2024.
When you take a close look at $AFL’s revenue and earnings over the past five years, you’ll notice something interesting: revenue has dropped by 14%, yet earnings have shot up by 33%. It’s not often you see revenue shrinking while earnings are climbing this strongly. Recent earnings growth has been attributed to increasing insurance premiums which are most likely associated with inflationary pressures in the economy.
Given Aflac’s market capitalization of $61 billion, it’s no surprise that insiders don’t own a huge percentage of shares. However, it’s encouraging to see that they have skin in the game, with an impressive stake worth $480 million. That represents 0.8% of the company’s shares, which is a solid slice for a business of this size. This kind of investment should motivate management to keep driving shareholder value.
All eyes will be on earnings for $AFL on November 6. Earnings will be the key catalyst moving forward. We think $AFL should be on your trading radar as it will continue to present solid trading opportunities over the coming year.
Practice good money management on all your trades and follow the artificial intelligence guidance in your trading.
Let’s Be Careful Out There!
It’s Not Magic.
It’s Machine Learning.
Disclaimer: THERE IS A HIGH DEGREE OF RISK INVOLVED IN TRADING. IT IS NOT PRUDENT OR ADVISABLE TO MAKE TRADING DECISIONS THAT ARE BEYOND YOUR FINANCIAL MEANS OR INVOLVE TRADING CAPITAL THAT YOU ARE NOT WILLING AND CAPABLE OF LOSING.
VANTAGEPOINT’S MARKETING CAMPAIGNS, OF ANY KIND, DO NOT CONSTITUTE TRADING ADVICE OR AN ENDORSEMENT OR RECOMMENDATION BY VANTAGEPOINT AI OR ANY ASSOCIATED AFFILIATES OF ANY TRADING METHODS, PROGRAMS, SYSTEMS OR ROUTINES. VANTAGEPOINT’S PERSONNEL ARE NOT LICENSED BROKERS OR ADVISORS AND DO NOT OFFER TRADING ADVICE.


