


| This Week’s a.i. Stock Spotlight is Alibaba Group Inc. ($BABA) |
Founded in 1999 and headquartered in Hangzhou, China, Alibaba Group Holding Limited stands as a monumental player in the global digital economy, particularly recognized for its dominance in the Chinese e-commerce landscape. The company employs approximately 204,891 individuals, making it one of China’s largest employers and a central figure in the country’s technological advancement. Alibaba is also one of the world’s largest venture capital firms and investors, significantly impacting global tech innovation. Alibaba’s strategic support for small and medium businesses in China is crucial for the country’s economic development. The company has been pivotal in transforming digital advertising in China through its marketing platforms.
With a robust market capitalization of around $314 billion as of early 2025, Alibaba showcases its vast influence in the market. The company’s revenue primarily flows from its diverse e-commerce platforms that cater to both Chinese and international consumers. However, Alibaba is not just about e-commerce; it has expanded its revenue streams to include cloud computing and digital media, striving to match the pace of global giants like AWS and Microsoft Azure.
Alibaba’s growth strategy is multifaceted, focusing significantly on technological innovation. The company’s cloud computing sector is rapidly expanding, meeting the increasing demand for cloud solutions globally. Alibaba is also making significant strides in A.I. and logistics through its dedicated research wing, DAMO Academy, and its logistics arm, Cainiao, which utilizes advanced technology for efficient package handling and delivery.
Alibaba Group just set the tech world ablaze with the launch of its latest and greatest creation, a cutting-edge artificial intelligence assistant app. This isn’t just any A.I. app — it’s turbocharged by Alibaba’s own powerhouse, the flagship Qwen A.I. reasoning model. We’re talking top-tier, next-generation tech that’s making waves across the globe.
This strategic move is Alibaba’s battle cry in the fiercely competitive A.I. arena, especially with DeepSeek turning heads earlier this year with its blockbuster R1 model. It’s clear, Alibaba isn’t just playing the game; they’re aiming to dominate. Just last month, Alibaba threw down the gauntlet with an eye-popping announcement — they’re funneling a staggering 380 billion yuan (that’s a cool $52.5 billion for those of us stateside) into their cloud computing and A.I. infrastructure over the next three years. Why? Because their Qwen A.I. is crushing official benchmark tests, showcasing Alibaba’s escalating influence in the A.I. domain.
And let’s not gloss over the monumental gains Alibaba’s making with its A.I. cloud business, propelling a sharp profit spike in the last quarter. The magic combo of their Cloud Intelligence unit and robust e-commerce segment is fueling this financial surge.
But here’s the kicker — earlier this year, Alibaba clinched a major partnership with none other than Apple Inc. That’s right, A.I. on iPhones is about to get a serious upgrade, all thanks to Alibaba. Now, with sights set high, Alibaba is gearing up to square off against OpenAI.
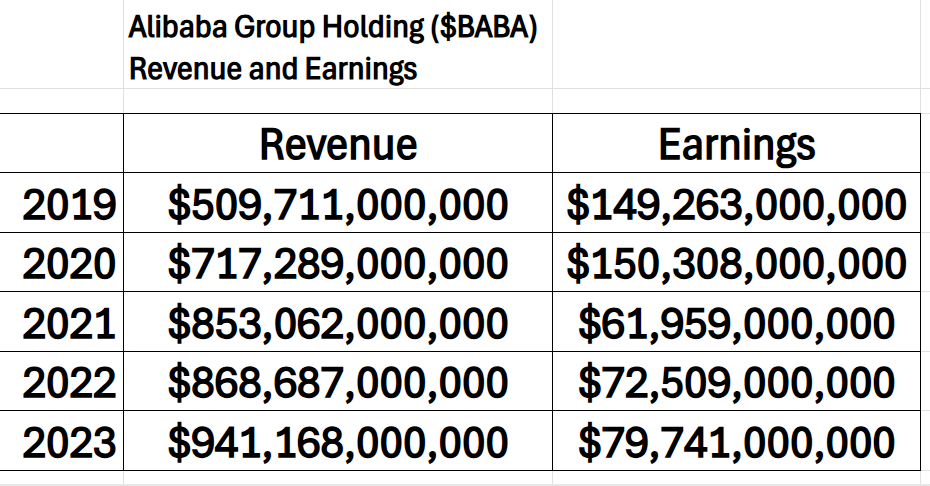
Alibaba is leading the A.I. revolution. The challenge is that while $BABA is growing revenues, its earnings are declining substantially over the last 5 years. Analysts attribute this to a massive investment in artificial intelligence development.
Alibaba’s e-commerce platforms are uniquely integrated with social media elements, particularly visible in its Taobao platform, which ranks as one of the most visited sites worldwide. The platform’s model significantly enhances user engagement and sales. Furthermore, Alibaba’s annual Singles’ Day sale has grown to become the largest shopping event globally, consistently shattering previous records and highlighting the company’s retail prowess.
Alibaba not only operates in e-commerce and technology but also ventures into digital media and healthcare. It owns Youku, one of China’s leading streaming services, like YouTube, and is exploring innovative healthcare solutions through Alibaba Health. Moreover, Alibaba’s collaboration with significant players like Volkswagen to enhance EV and smart technology infrastructure underscores its strategic alliances.
Despite its success, Alibaba faces ongoing regulatory challenges in China, which could impact its operational strategies and cost structures. The competitive landscape remains fierce, with domestic rivals like JD.com and international contenders such as Amazon vying for market share.
The stock’s performance reflects the broader tech sector’s volatility and Alibaba’s specific regulatory and market challenges. However, it remains a beacon for investors due to its substantial market presence and growth potential.
Alibaba Group’s strategic endeavors across e-commerce, technology, and global market expansion highlight its role as a leader in the digital age. As it navigates through operational challenges and leverages opportunities for growth, Alibaba remains a critical study for investors and industry observers alike, poised to continue its legacy as a pioneer in the global marketplace.
In this stock study, we will look at an analysis of the following indicators and metrics which are our guidelines, and which dictate our behavior in deciding whether to buy, sell or stand aside on a particular stock.
Wall Street Analysts Ratings and Forecasts
52 Week High and Low Boundaries
Best-Case/Worst-Case Analysis
Vantagepoint A.I. Predictive Blue Line Indicator
Neural Network Forecast (Machine Learning)
VantagePoint A.I. Daily Range Forecast
Intermarket Analysis
Our Suggestion
While we make all our decisions based upon the artificial intelligence forecasts, we do look at the fundamentals briefly, just to understand the financial landscape that $BABA is operating in.
Wall Street Analysts Forecasts
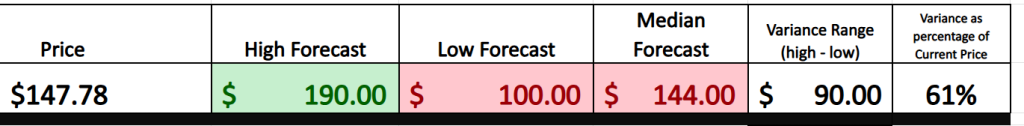
Thirteen seasoned analysts have recently provided their 12-month price forecasts for Alibaba’s stock, offering a glimpse into the anticipated trajectory of this e-commerce giant. The consensus among these financial experts places the average price target at $144, which, interestingly, suggests a modest retreat of approximately 2.56% from its current trading price of $147.78. The predictions display a broad range of outcomes, from a conservative low of $100 to an optimistic high of $190. This variance in analyst expectations not only underscores the inherent uncertainties in the market but also reflects differing perspectives on Alibaba’s future performance amid evolving industry dynamics and global economic conditions.
We always suggest traders pay attention to the variance between the most bullish and most bearish forecasts. This level is the expected volatility for the coming 12 months and it is $90 or 61% of the current price. This level of volatility is extremely high.
52 Week High and Low Boundaries
The 52-week high-low range is the lifeblood of how traders gauge a stock’s mojo. For rookies and market sharks alike, this is your frontline intel. It’s your street-smart way to score which stocks are kings and which are the court jesters.
When a stock is flirting with its 52-week high, that’s market speak for “I’m on fire!” It’s a signal that the big dogs are betting big, trust is booming, and the only way from here might just be up. That’s the kind of stock that gets investors’ hearts racing and wallets opening.
But if a stock’s sulking near its yearly low, that’s a red flag waving in the face of your portfolio. It’s often a cry for help, signaling either a slump in the game or a loss of the crowd’s faith.
Stocks breaking new highs can magnetize more cash, pushing them even higher into the stratosphere. Meanwhile, those dropping to new lows? They can spiral down fast as investors jump ship.
So, marking where a stock sits in that 52-week range? It’s not just about capturing a moment in time. For anyone looking to ride the waves of the stock market, understanding this dynamic is critical. It’s the compass you need to navigate the wild seas of Wall Street. Get this right, and you’re not just playing the market — you’re mastering it.
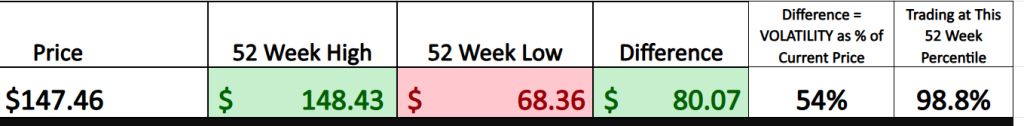
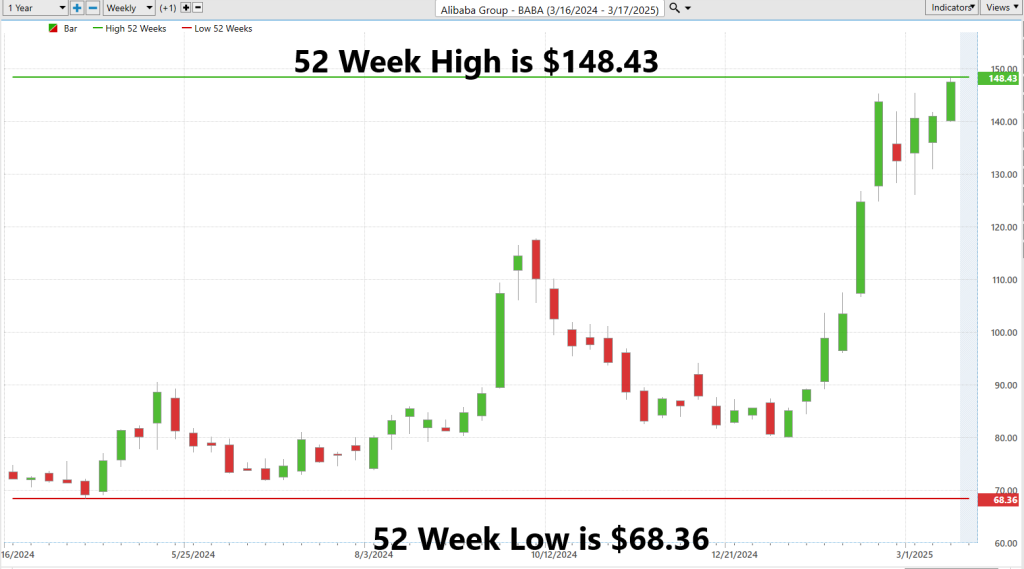
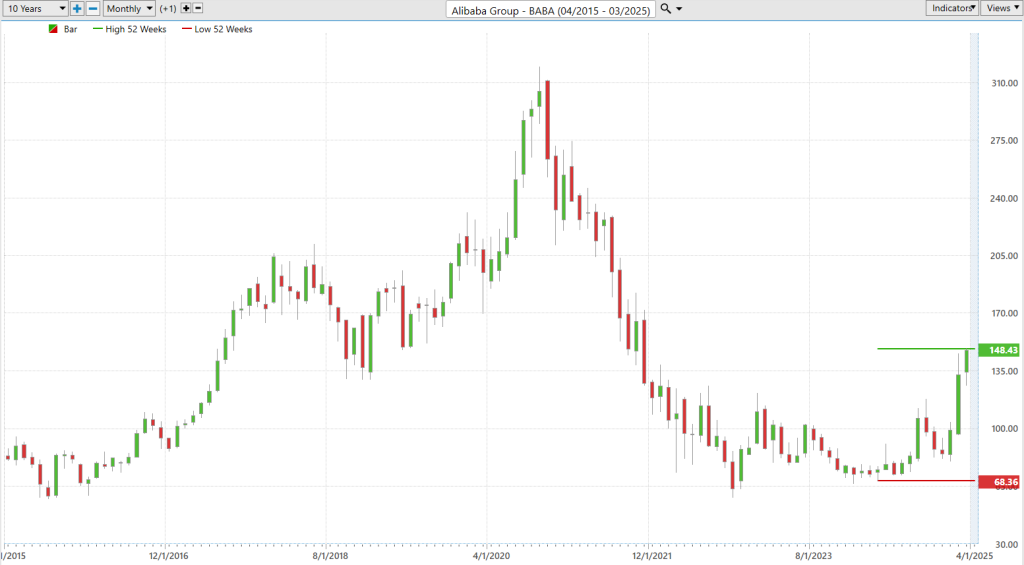
Over the last 52 weeks $BABA has traded as high as $148.43 and as low as $68.36. We suggest traders pay attention to this annual range as it is the historical volatility of the last 12 months. Currently this range is $80.07 and is equivalent to 54% of the current price.
Two important things we have learned so far is that Wall Street Analysts are expecting volatility of 61% for the coming 12 months and over the last year the annual range is 54% of the current price. These two metrics tell us that future volatility is expected to be quite high on $BABA.
For traders and investors, the importance of these annual high and low benchmarks cannot be overstressed, yet it is equally vital to adopt a broader perspective. I encourage you to expand your view — look beyond the immediate and delve into a more comprehensive, 10-year monthly chart analysis. This wider lens is instrumental in revealing the deeper, long-term trends and the overall stability of a stock like $BABA.
Best-Case/Worst-Case Analysis
Before you even consider diving into a trade, grasping the full spectrum of potential ups and downs — the risks and rewards — is crucial. This is precisely where a robust scenario analysis becomes invaluable, especially for those contemplating a position in Alibaba ($BABA). A particularly effective method involves comparing the durations of the stock’s rallies against its downturns. By mapping these movements, traders gain a vivid visual representation of Alibaba’s historical performance peaks and troughs, providing a grounded forecast of possible future price trajectories.
This exercise goes beyond simply measuring potential gains or losses; it’s about setting realistic expectations for what you’re likely to encounter in the rough-and-tumble of the market. For a stock like Alibaba, this analysis can reveal much. It essentially distills down to two clear charts: one illustrating the stock’s most significant upward trends, and the other its most severe declines. These charts are practical tools, aiding traders in setting intelligent stop-loss points and profit targets so they’re not entering the fray unprepared.
These visuals transform into essential instruments for devising a trading strategy that isn’t based on mere speculation but anchored in solid, empirical evidence. Recognizing these patterns empowers traders to execute more precise, thought-out decisions, aligning their tactics closely with what the market is likely to bear.
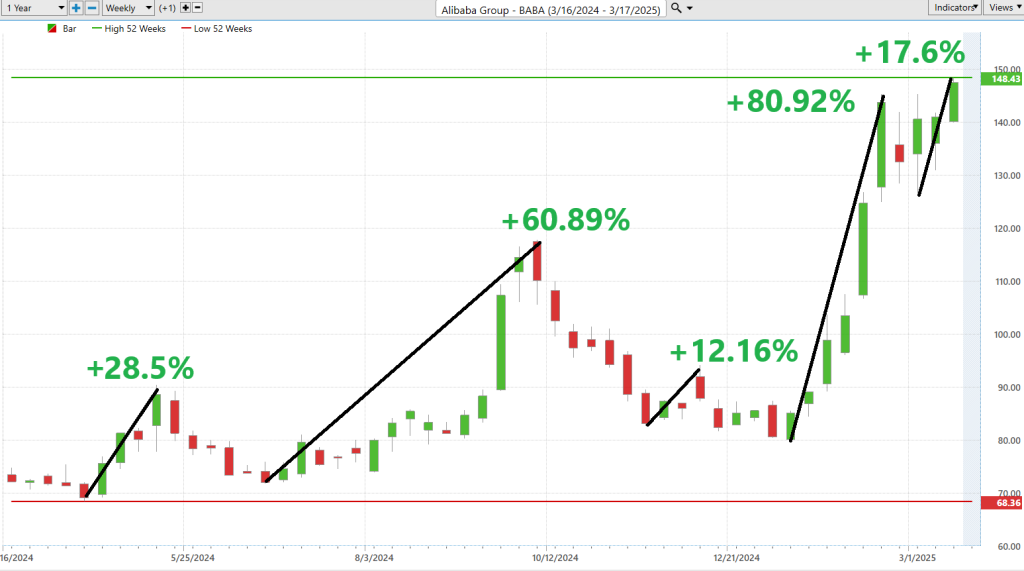
First let’s look at the best-case scenario:
Followed by the worst-case scenario:
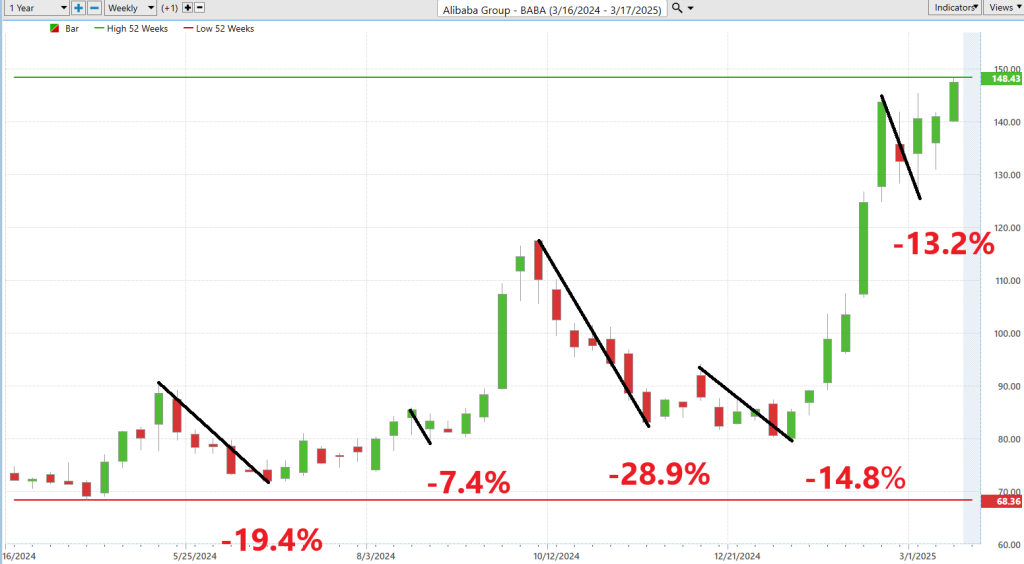
From these two charts we can clearly see the risk and reward that $BABA has offered traders over the past year. The strongest uninterrupted rally was 80.9% from bottom to peak. The magnitude of the largest uninterrupted decline was 28.9% peak to bottom.
Next, we turn our focus to comparing Alibaba ($BABA), to the broader stock market indexes. This analysis spans multiple time frames, allowing us to assess how Alibaba has fared relative to the market at large. Additionally, this comparison gives us crucial insight into the stock’s volatility compared to the overall market, helping us understand its behavior in different market conditions.
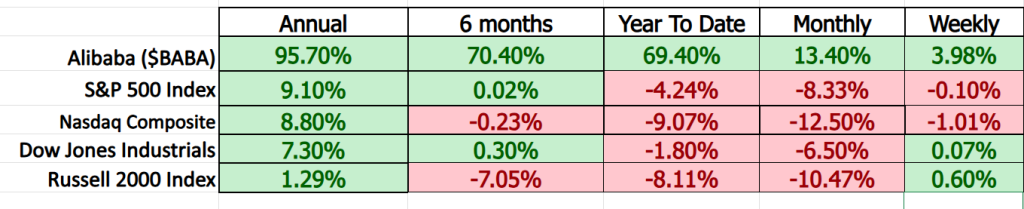
The current beta of Alibaba ($BABA) is 0.18. In simple terms, the beta value tells us how much Alibaba’s stock price moves compared to the whole stock market. A beta of 0.18 means Alibaba’s stock is 82% less volatile than the market. If the market goes up or down, Alibaba’s stock price is likely to move much less, showing it’s not as risky or reactive to market changes as other stocks might be.
Understanding beta can help investors figure out how risky a stock is compared to investing in the whole stock market.
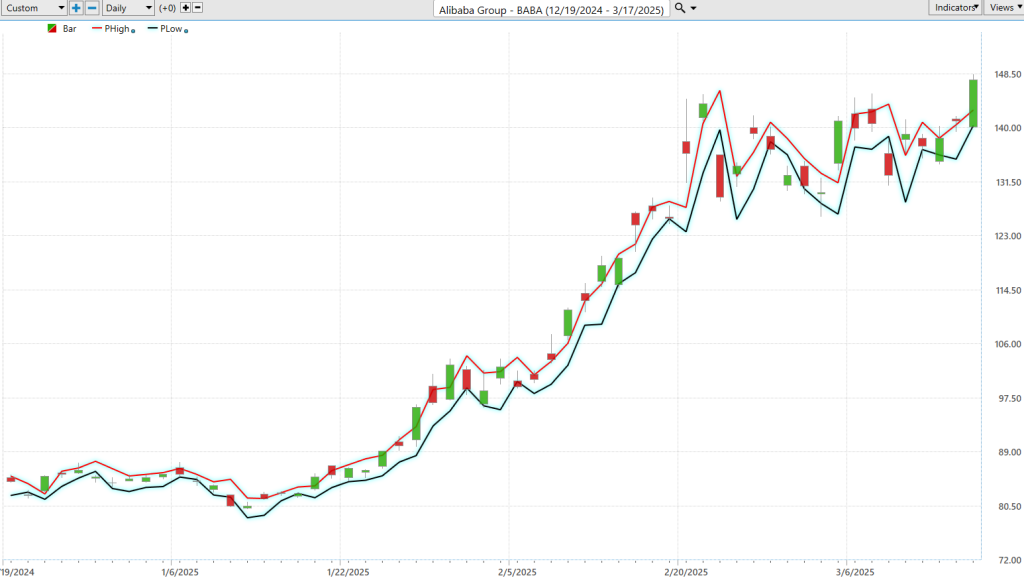
Vantagepoint A.I. Predictive Blue Line
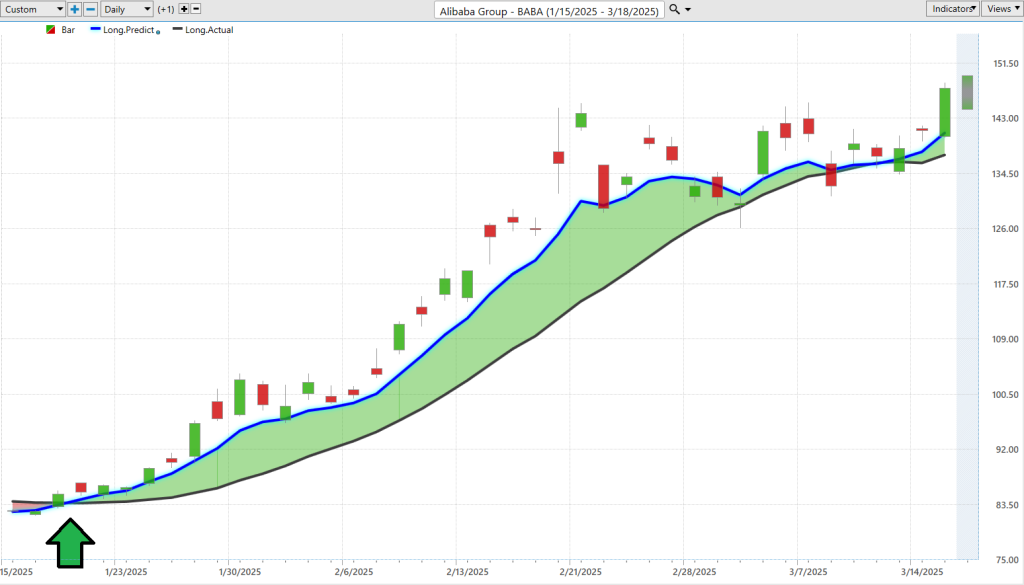
Imagine stepping into the trading arena armed with a tool that offers you a significant advantage over the competition. That’s the edge provided by VantagePoint Software’s A.I.-driven forecasts, now applied to Alibaba ($BABA). Think of it as having a high-tech trading ally. This software’s predictive blue line acts much like a seasoned coach, guiding your buy and sell decisions with uncanny precision.
This predictive line isn’t just a marker on a chart; it’s a strategic guide through the volatile landscape of stock trading. Here’s how to leverage its insights:
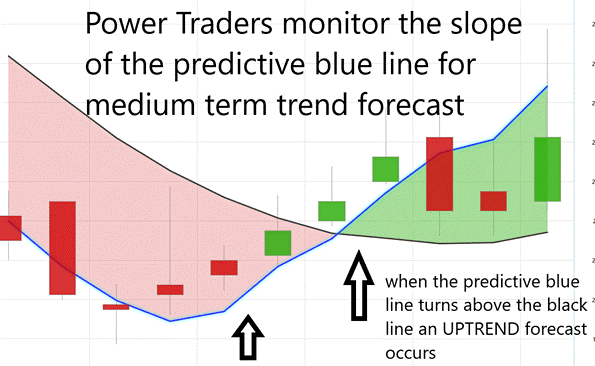
Reading the Slope: Consider this line the mood ring of the market. An upward slope suggests a potential rise in stock prices — time to scout for buying opportunities. A downward slope signals a possible decline, prompting you to prepare for selling.
Finding the Value Zone: When Alibaba’s price approaches or dips below this predictive line during its upward trajectory, it signals a buy. Conversely, a price above the line during a downturn suggests caution.
Heeding Downward Warnings: A persistent downward trend in the blue line is a strong indicator to protect your investments, akin to spotting storm clouds on the horizon.
Using this A.I. tool transforms each trading decision from guesswork into a well-calculated strategy, simplifying complex market data into actionable insights. This is about making informed, strategic moves that position you for success.
Note how recent A.I. trend forecasts have successfully predicted market movements, underscoring the effectiveness of this advanced tool in real-market scenarios.
Neural Network Forecast (Machine Learning)
A neural network is a type of artificial intelligence that mimics the human brain’s ability to recognize patterns and solve problems. It’s a key component of many modern A.I. systems used in trading. The neural index, utilized by traders, leverages this technology to analyze market data and predict the direction of a stock’s movement over a short-term period, typically 1 to 3 days. This tool enhances decision-making by providing data-driven, objective insights into potential market movements, allowing traders to make more informed and timely decisions, optimize trade entry and exit points, and reduce reliance on intuition or less reliable methods. This leads to more precise and strategic trading.
The Neural Index rests at the bottom of the chart. When it flashes green it confirms strength. When it turns red it expects a market pullback. Think of a neural network as a turbocharged brainy assistant for traders, zipping through oceans of data to advise on the best times to buy or sell stocks. This digital Einstein mimics the human brain with layers that digest and learn from data, then spit out predictions faster than any human could, steering clear of emotional biases that typically trip traders up. It’s not just fast; it’s smart, tapping into vast historical data to make pinpoint forecasts that help traders outsmart the chaotic market. With this tech, traders are armed to the teeth, making moves based on solid data, not gut feelings.
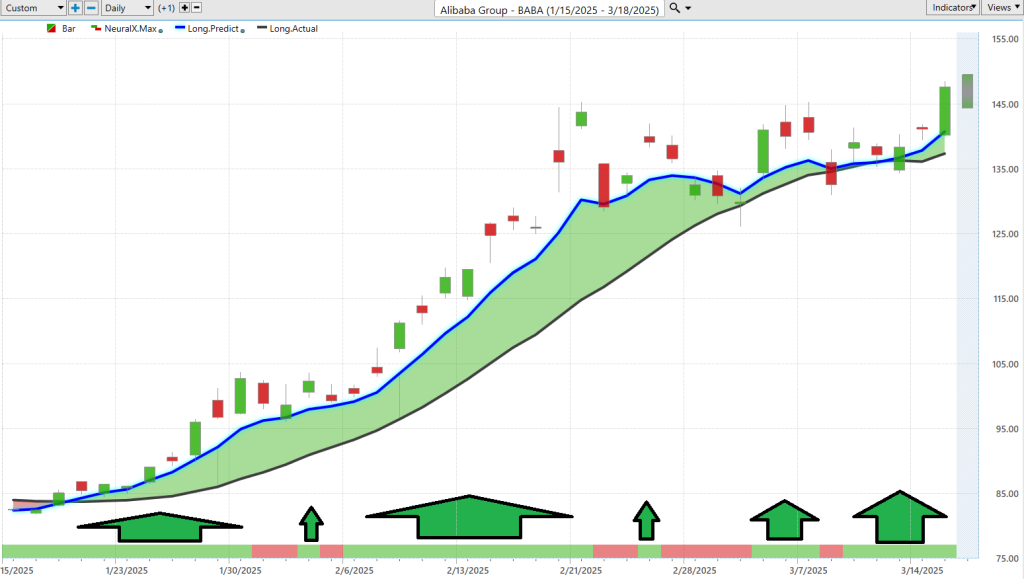
The arrows at the base of the chart are all of the moments when the Neural Index and the Predictive Blue Line were both forecasting the same direction. These are high probability opportunities which we refer to as the ”double confirmation setup.”
VantagePoint A.I. Daily Range Forecast
The Vantagepoint A.I. Daily Range Forecast for Alibaba ($BABA) transcends the status of a mere tool, becoming an essential asset in the arsenal of any trader. This advanced technology sharpens decision-making by identifying the best times to enter or exit trades — critical moves for success in the fast-paced financial markets.
The market’s volatility demands more than raw data; it requires that data be transformed into actionable insights. Here, the prowess of artificial intelligence, machine learning, and neural networks is fully realized, cutting through the market noise to provide precise, actionable forecasts.
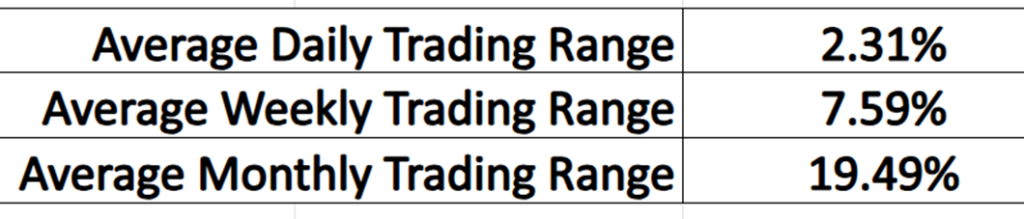
Analyzing the trading ranges of $BABA — daily, weekly, and monthly — over the past year is crucial for understanding market trends and fine-tuning trading strategies with exceptional accuracy. This in-depth analysis offers traders a clear perspective, enabling strategic maneuvers in a dynamic trading environment.
First let’s look at the average trading ranges over the past year for the daily, weekly and monthly time frames:
The Vantagepoint A.I. Daily Range Forecast tackles market unpredictability with remarkable precision, offering daily trading predictions that allow traders to stay ahead of market movements. This is about transforming overwhelming data into actionable intelligence, enabling traders to make decisions with precision and confidence. These tools don’t just assist; they empower traders to navigate the market with the acumen of a visionary, turning data into strategic advantage.
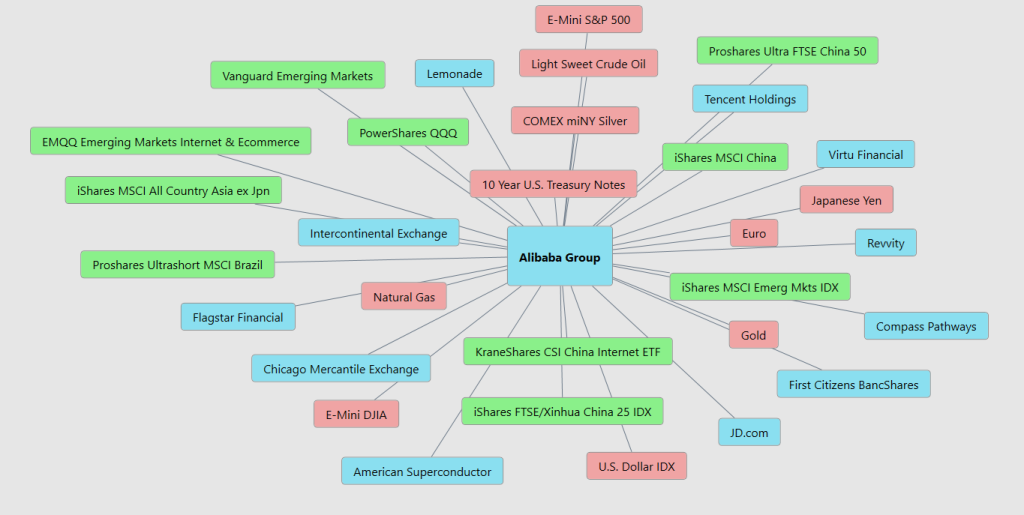
Intermarket Analysis
Imagine markets as a dynamic dance floor where stocks, bonds, currencies, and commodities interact, shaping each other’s movements. Intermarket analysis helps decode these interactions to predict price directions, acting like a financial detective identifying clues from asset behaviors.
Alibaba Group Holding Limited ($BABA) is deeply intertwined with the tech sector, especially in realms like e-commerce and cloud computing, which are vital to its revenue amidst global digital trends. Its stock is also swayed by the broader Chinese market, as seen in indices like the Hang Seng, influenced by China’s macroeconomic policies and global investor sentiment. Exchange rate variations, particularly USD/CNY, affect Alibaba’s competitiveness in international markets and the profitability of overseas earnings. Moreover, its stock is indirectly influenced by the performance of U.S. tech giants and global commodity prices, reflecting its extensive supply chain and market position.
For Alibaba ($BABA), its price is influenced by several factors. Understanding these elements provides insight into Alibaba’s stock behavior in the context of global economic dynamics.
The following graphic provides the top 31 key drivers of price action for $BABA.
Our Suggestion
Alibaba’s revving up with some strategic moves that could make the bulls dance and the bears sweat.
First up, from the tail end of 2023 and into 2025, Alibaba’s been hustling hard in A.I. and cloud innovation, driving their revenue up like a rocket. We’re talking about substantial growth, with A.I.-related products continuing to pull off triple-digit growth for several quarters in a row now. That’s not just good; that’s “write-home-to-Momma” good.
Strategic maneuvers are on the table too. Alibaba’s got their hands in a couple of cookie jars, planning IPOs for their logistics arm Cainiao and their retail outfit Freshippo. They’re multiplying their playing fields, aiming to spin these divisions off into their own entities. This is strategic proliferation that could fatten up their cash cushions significantly.
Talking numbers, their revenue is up, with international commerce getting a particular spotlight thanks to hefty growth rates. They’ve got repurchases and share buybacks that show they’re serious about adding value back to their shareholders. Plus, with cash flows staying robust, they’re in a sweet spot to keep the engines firing on all cylinders.
So, what’s the takeaway for a trader or an investor?
Alibaba is moving and shaking with the best of them, pushing into new markets and technologies while tightening up their financial game to boost shareholder value. If you’re looking at Alibaba through a telescope, these earnings calls are like star charts guiding you through the trading cosmos.
We suggest you place $BABA on your trading radar and stock watchlist as there will be numerous trading opportunities in the year ahead.
Alibaba Group ($BABA) is scheduled to release its next earnings report on May 14, 2025.
Practice good money management on all your trades.
Use the Vantagepoint A.I. Daily Range forecast for short-term trading opportunities.
Let’s Be Careful Out There.
It’s Not Magic.
It’s Machine Learning.
Disclaimer: THERE IS A HIGH DEGREE OF RISK INVOLVED IN TRADING. IT IS NOT PRUDENT OR ADVISABLE TO MAKE TRADING DECISIONS THAT ARE BEYOND YOUR FINANCIAL MEANS OR INVOLVE TRADING CAPITAL THAT YOU ARE NOT WILLING AND CAPABLE OF LOSING.
VANTAGEPOINT’S MARKETING CAMPAIGNS, OF ANY KIND, DO NOT CONSTITUTE TRADING ADVICE OR AN ENDORSEMENT OR RECOMMENDATION BY VANTAGEPOINT AI OR ANY ASSOCIATED AFFILIATES OF ANY TRADING METHODS, PROGRAMS, SYSTEMS OR ROUTINES. VANTAGEPOINT’S PERSONNEL ARE NOT LICENSED BROKERS OR ADVISORS AND DO NOT OFFER TRADING ADVICE.


