


This week’s ai stock spotlight is ProShares UltraShort BioTech ($BIS)
Fasten your seatbelt as we embark on a thrilling journey into the world of the ProShares UltraShort Nasdaq Biotechnology ETF, known among savvy traders and adrenaline junkies simply as $BIS.
This isn’t your granddad’s investment; this is a financial instrument that plays by its own rules, and here’s the scoop on why it’s the big, bad wolf of the trading world.
First off, what exactly is $BIS? Imagine if you could bet against the Biotech industry, and for every step back it takes, you move two steps forward. That’s $BIS in a nutshell. It’s a leveraged inverse ETF, which means it aims to return double the inverse of the daily performance of the NASDAQ Biotechnology Index. In plain English, if the index drops 1% today, $BIS aims to jump 2% — and vice versa. It’s like betting on the underdog in a boxing match; if the underdog knocks out the champion, the payoff can be sweet.
Yet, the leveraged effect resets daily, making $BIS suitable primarily for short-term speculation rather than long-term investment. Its structure leads to performance deviation over extended periods, heavily influenced by market volatility, which can erode returns unpredictably. Moreover, $BIS exhibits a high expense ratio relative to simpler funds, a direct consequence of the sophisticated strategies required to maintain its daily objectives. The fund’s volatility is accentuated by its focus on the Biotech sector, known for rapid swings in stock values.
Understanding $BIS demands a deep appreciation of its mechanics — leveraged, inverse exposure, daily rebalancing — and its suitability for tactical trades rather than buy-and-hold strategies. For the astute trader, it offers a sharp tool in the arsenal against market downturns but demands vigilance and a firm grasp of its underlying complexities.
Now, let’s get down to brass tacks — market capitalization. $BIS isn’t swinging at the weight of the behemoths like Apple or Amazon. It’s more agile, more niche. It’s designed for traders who aren’t just participants but are gladiators in the financial arena, those who understand the ebbs and flows of the Biotech sector and are quick on their feet with short-term investment strategies.
The five largest Biotech stocks by market capitalization are:
1. Vertex Pharmaceuticals (NASDAQ:VRTX): With a market cap of approximately $105.58 billion, Vertex Pharmaceuticals leads in developing treatments for cystic fibrosis and has a broad pipeline including genetic and cell therapies for various diseases. Over the last 52 weeks it is up 15%
2. Regeneron Pharmaceuticals (NASDAQ:REGN): This company has a market cap of around $102.47 billion and is known for its wide range of medical treatments targeting diseases from cancer to rare genetic conditions. Over the last 52 weeks it is down 43%.
3. Moderna (NASDAQ:MRNA): Moderna, renowned for its COVID-19 vaccines, has a market cap of $39.97 billion and a diverse portfolio in mRNA-based medicines. Over the last 52 weeks it is down 78%
4. Argenx (NASDAQ:ARGX): With a market cap of $23.1 billion, Argenx focuses on developing antibody-based medicines for autoimmune diseases. Over the last 52 weeks it is UP 40%
5. BioNTech (NASDAQ:BNTX): BioNTech, which partnered with Pfizer for a COVID-19 vaccine, has a market cap of $21.81 billion and is also advancing other immunotherapies for serious diseases like cancer. Over the last 52 weeks it is down 5%.
These companies represent the forefront of innovation in Biotechnology, focusing on a wide array of therapies and solutions for complex medical conditions. I share their performance metrics with you so that you can understand and appreciate the wide variances that exist for each company.
Who trades $BIS? This ETF isn’t for the faint-hearted or the green behind the ears. It’s for seasoned traders who eat market volatility for breakfast. They use $BIS to hedge against other investments, speculate on Biotech downturns, or simply love the thrill of the trade. It’s their tool for making bold moves in response to Biotech industry performances, and believe me, in the world of Biotech, boldness can pay off handsomely.
Why do they trade it? Because in the world of trading, being able to capitalize on downturns is just as crucial as riding the upswings. $BIS offers a way to make gains from negative movements in Biotech stocks without having to short stocks directly, which can involve unlimited risks. It’s like having a secret weapon in your arsenal for those days when the Biotech sector wakes up on the wrong side of the bed.
In summary, $BIS is not just any ETF; it’s a high-stakes, high-reward game changer designed for those who dare to dance with the market’s dark side. If you’ve got the guts, the knowledge, and the strategy, $BIS might just be the wild ride you’re looking for in the Biotech bear market.
Remember, with great power comes great responsibility, and trading leveraged ETFs like $BIS requires vigilance, agility, and an ironclad strategy. So, if you’re thinking about hopping on the $BIS train, make sure you’re well-equipped for the ride of your life in the Biotech battleground!
This stock study, we will look at an analysis of the following indicators and metrics which are our guidelines, and which dictate our behavior in deciding whether to buy, sell or stand aside on a particular stock:
- 52 Week High and Low Boundaries
- Best-Case/Worst-Case Analysis
- Vantagepoint A.I. Predictive Blue Line Indicator
- Neural Network Forecast (Machine Learning)
- VantagePoint A.I. Daily Range Forecast
- Intermarket Analysis
- Our Suggestion
52 Week High and Low Boundaries
Traders and investors often monitor the 52-week high and low boundaries for stocks as these markers provide valuable insights into the stock’s performance and potential future movements. Here’s how this metric serves as a useful tool in the financial markets:
1. Performance Benchmark
The 52-week high and low figures create a frame of reference for evaluating a stock’s current price relative to its performance over the past year. This comparison helps in assessing whether the stock is trading near its peak, bottom, or somewhere in between, which can influence buy or sell decisions. By looking at these extremes, traders can gauge market sentiment and potential resistance or support levels.
2. Comparison Tool
These boundaries allow investors to compare the performance of different assets. A stock hitting new 52-week highs might be seen as showing strength and momentum, possibly outperforming its peers or the broader market. Conversely, a stock near its 52-week lows might be viewed as underperforming or facing challenges.
3. Historical Volatility Indicator
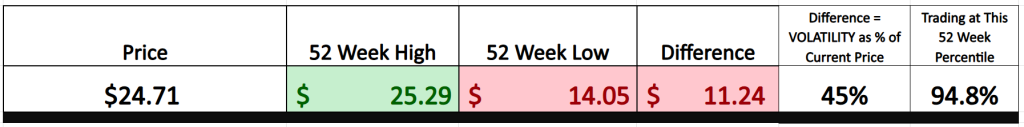
The range between the 52-week high and low gives a straightforward measure of a stock’s volatility over the past year. For example, the ETF symbolized as $BIS traded between a high of $25.29 and a low of $14.05. Subtracting the low from the high gives a difference of $11.24, which represents historical volatility. This figure can be expressed as a percentage of the recent closing price to provide context on how significant these swings were relative to the stock’s price.
4. Future Volatility and Price Movement Expectations
A higher historical volatility, like the 45% observed for $BIS based on its recent trading range and closing price, suggests that the ETF is quite volatile. This level of volatility indicates that it’s statistically normal for $BIS to trade up to 45% higher or lower than its current price over the next year. Such information is crucial for risk assessment and setting expectations for potential price movements.
Understanding and using the 52-week high and low as part of a trading strategy can provide traders with key insights into market trends, stock resilience or vulnerability, and expected price volatility. This information helps in making more informed decisions about entry and exit points and in managing risk, especially in volatile market environments.
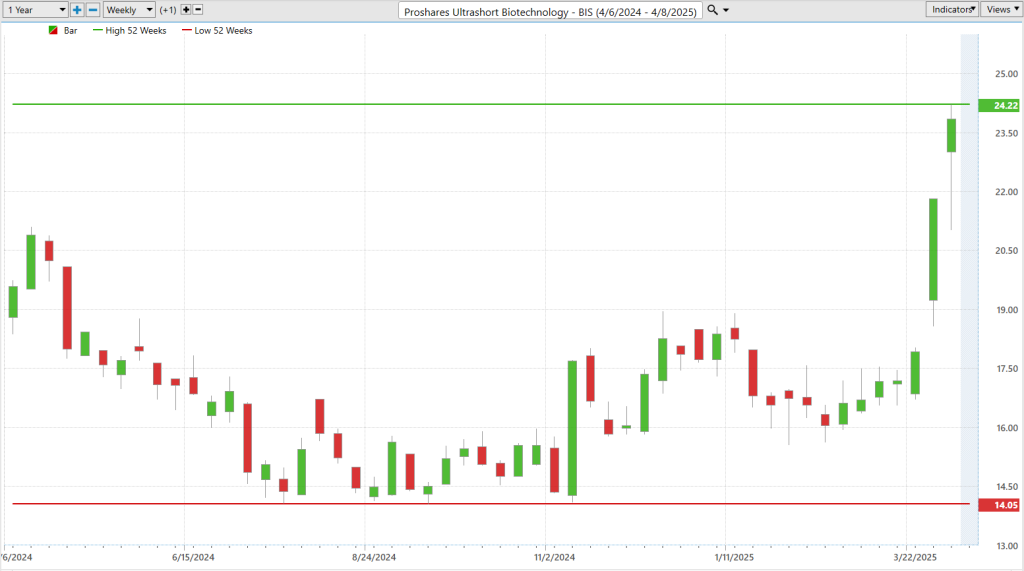
Here is the 52-week chart of $BIS which provides traders with an understanding of its longer-term trajectory:
Best-Case/Worst-Case Analysis
When you step into the world of trading, understanding volatility isn’t just a tool — it’s your fundamental compass.
In trading, every move you make is weighted with the possibility of both profit and peril. To navigate this landscape effectively, you must first discern the type of volatility a stock has exhibited. This isn’t just about knowing numbers; it’s about understanding the narrative behind those numbers. The highest rallies and deepest declines of a stock over the past year are not mere statistics — they reveal stories of investor sentiment, market reactions, and the underlying strength or fragility of a stock.
Focusing on the largest uninterrupted rallies and declines within a year gives you a clear picture of how dramatically a stock can move when the market sentiment is strongly skewed one way or the other. These are the moments when the stock was most free to show its true momentum, unimpeded by external corrections or reversals.
Knowing the extremes of past performance helps in setting realistic expectations for future price movements. This knowledge dictates how much risk you are willing to take on a trade. If a stock has historically seen high volatility, a cautious approach with tighter stop losses or smaller position sizes might be prudent.
Understanding volatility influences how much capital you allocate to a particular trade. High volatility may offer greater profit potential, but it also increases the risk of significant losses. Effective position sizing acts as a balance, ensuring that you are neither overly exposed nor insufficiently invested in the opportunities that present themselves.
The insights gained from studying past market movements allow you to develop strategies that can leverage similar future movements. For instance, if a stock tends to rally significantly after a specific type of news announcement, you might position yourself to capitalize on this pattern before the news breaks.
Analyzing these market movements isn’t just about numbers; it’s also about understanding the psychology of other traders and investors. Each price movement carries with it the hopes, fears, and expectations of the market’s participants. By decoding this collective emotional landscape, you position yourself to anticipate future movements more accurately.
In essence, mastering trading by understanding volatility is akin to mastering a language —the language of the market. It’s about more than just making educated guesses; it’s about making informed, strategic decisions that align with both market trends and human psychology. The key to success lies not just in the data, but in the stories that the data tells.
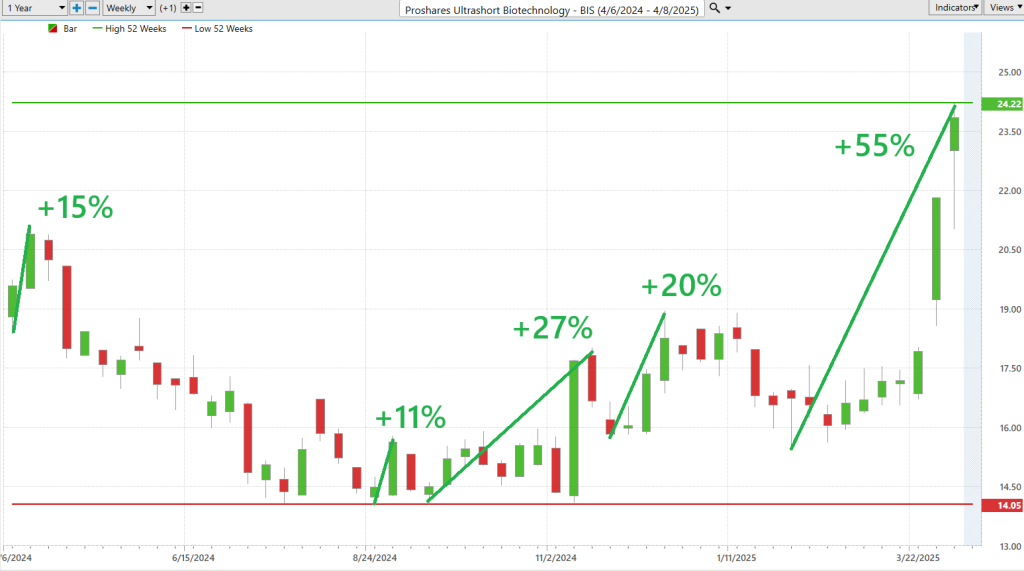
First, we measure the largest uninterrupted rallies:
Followed by the largest uninterrupted declines:
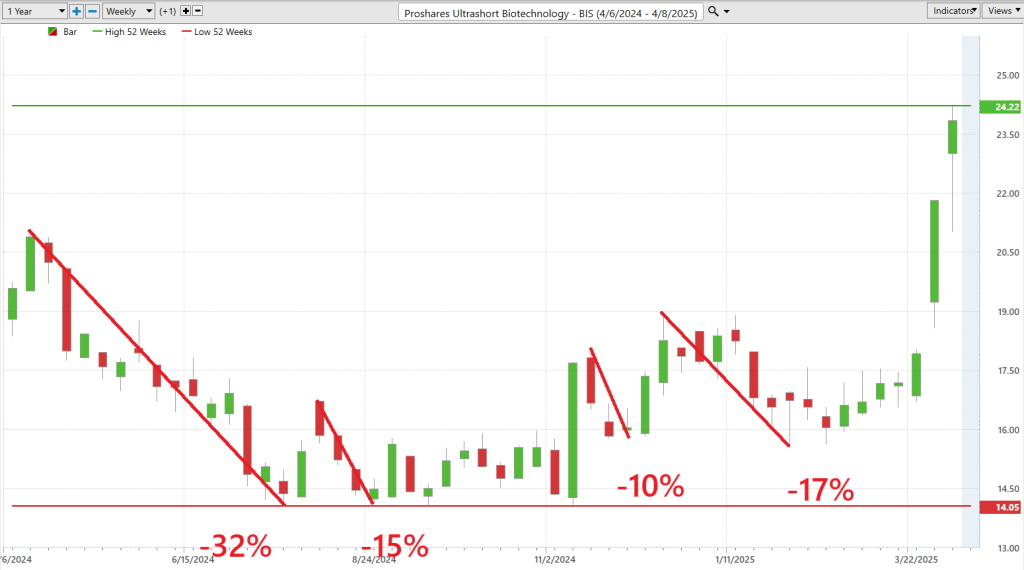
From these two charts we can quickly understand the level of volatility, opportunity and risk that exist in trading $BIS.
Next, we compare $BIS to the broader stock market indexes to compare volatility and performance against multiple time frames:
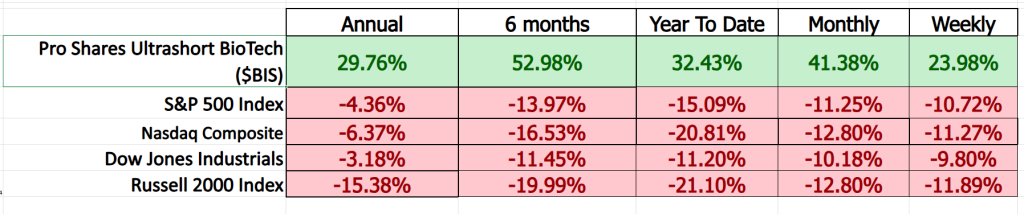
From this simple analysis we can see that while the broader stock market indexes have been in solid downtrends $BIS has massively outperformed.
The beta value of the ProShares UltraShort Nasdaq Biotechnology ETF (BIS) is -1.42. This negative beta indicates that the ETF moves inversely relative to the market. A beta of -1.42 suggests that BIS is expected to move approximately 1.42 times opposite to the market’s movements. This characteristic is typical for inverse ETFs, which are designed to increase in value when their benchmark index decreases, providing a way to hedge or profit from declines in the sectors they track.
Vantagepoint A.I. Predictive Blue Line
This ain’t your backyard penny-ante poker game; this is the high-stakes, no-mercy brawl of the stock market. As discussed earlier, the historical volatility of $BIS is 47% over the past year.
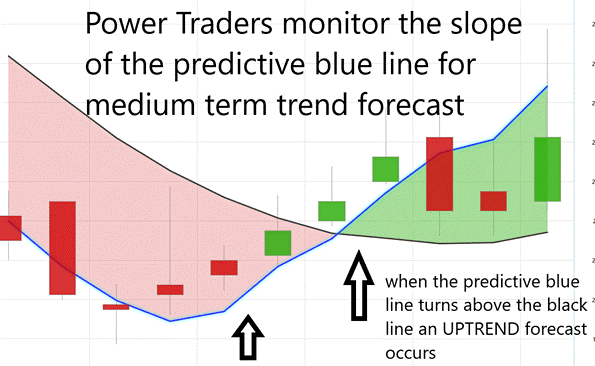
Enter stage left: VantagePoint’s A.I. Predictive Blue Line. When this line kicks up, it’s go time — hunt those buying opportunities like a lion looking for a limping gazelle. But see it nosedive? Hold your fire, soldier. That’s the market laying a minefield right in your path.
Now, let’s decode the Value Zone — where the trading elite earn their stripes. If $BIS is bucking like a bronco and dips its hooves below this sacred blue line while trending up, that’s can be your golden ticket. But if it leaps above while the trend’s heading south? Look for selling opportunities and treat it like hotcakes at a lumberjack convention. Missing these cues is like bringing a knife to a gunfight — you’re gonna get slaughtered.
Here’s the bottom line: The Predictive Blue Line isn’t just another tool — it’s your navigation ninja in the wild territory of $BIS. Follow it closely, and you’re making moves based on sniper-accurate insights. Ignore it at your peril, and you might as well be tossing your cash into a bonfire. So, choose wisely, because in this game, it’s not about having the biggest stack, it’s about playing the smartest hand.
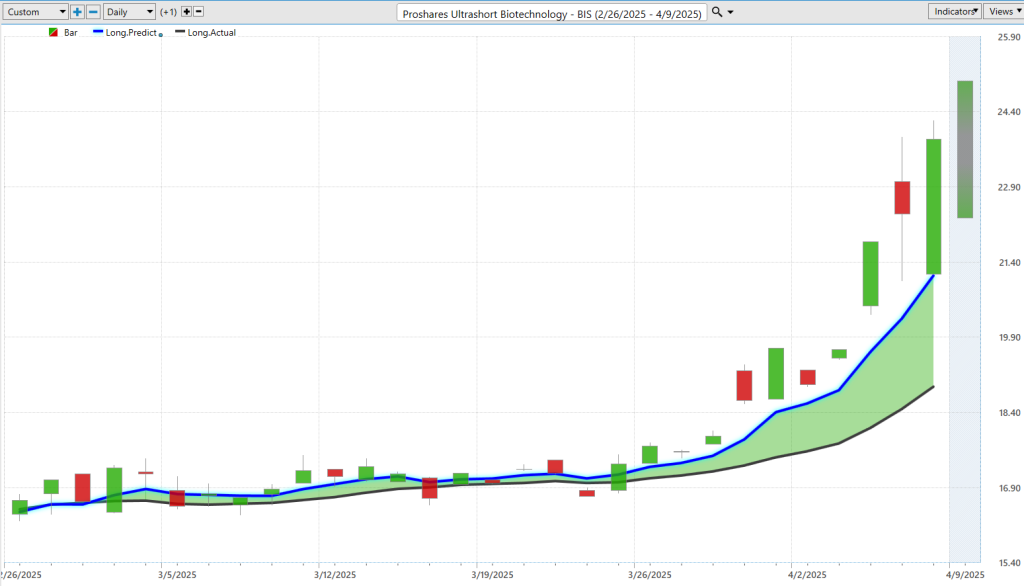
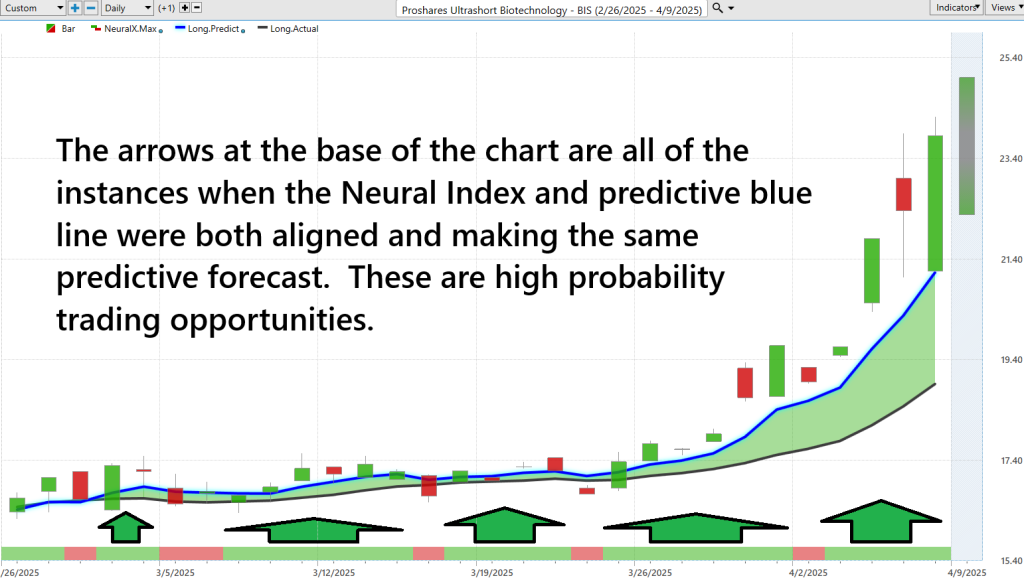
Here’s the $BIS chart equipped with the VantagePoint A.I. Predictive Blue Line. Notice that last trend forecast? It was a bullseye. Time to see if you’re up to the challenge.
Neural Network Forecast (Machine Learning)
In the fast-paced world of stock trading, the deployment of advanced technologies such as neural networks marks a significant evolution. A neural network, particularly in trading, is a sophisticated form of artificial intelligence (A.I.) designed to mimic the human brain’s capability to recognize patterns and solve complex problems.
Neural networks are composed of layers of interconnected nodes or neurons, which are akin to the neurons in the human brain. These networks are structured in three main layers: the input layer, which receives raw data; hidden layers, which process the data through computational models; and the output layer, which delivers the final decision or prediction.
The functionality of neural networks in trading revolves around their ability to process and learn from large volumes of data. They detect intricate patterns and trends in the market data that are not immediately obvious to human analysts.
Neural networks bring several key advantages to traders. Firstly, their ability to process data at speeds far surpassing human capabilities allows for real-time analysis and decision-making.
Consider the case of the Vantagepoint A.I. Neural Network system, which exemplifies the practical application of neural networks in trading. This system utilizes A.I. to predict market movements 24 – 72 hours in advance by analyzing patterns in historical data. It exemplifies how neural networks can be used not merely for reactive strategies but for proactive market engagement.
By employing such advanced analytics, traders are equipped with insights that allow them to anticipate market movements rather than merely react to them. This capability transforms trading from a gamble based on speed to a sophisticated strategy based on intellectual insight and foresight.
Neural networks in trading offer a compelling advantage by combining speed with smart analytics, allowing traders to operate on a level playing field with major market players. As technology advances, the integration of neural networks in trading platforms is likely to become more prevalent, making high-level trading strategies more accessible to the average trader and reshaping the trading landscape into one where strategic intellect prevails over mere speed.
VantagePoint A.I. Daily Range Forecast
The advent of sophisticated data-processing systems marks a transformative era in the financial markets. These systems, equipped with the capability to analyze extensive data sets at unprecedented speeds, are not merely additions to the trader’s toolkit — they are reshaping the very fabric of financial strategy. This shift from reactive to predictive trading methodologies underscores a significant evolution in market engagement, where the prowess of algorithmic precision becomes a staple.
The essence of this transformation lies not in technology alone, but in its application. Traders leveraging these advanced systems gain the upper hand not by mere speed, but through the strategic foresight they provide. This is a shift from being at the whim of market volatilities to anticipating and acting upon potential market movements before they manifest. The integration of computational intelligence with market insights is pioneering a new approach to trading — where clarity and calculated strategies replace guesswork and reactive decision-making.
Focusing specifically on $BIS, the application of machine learning tools to analyze its trading patterns across different time intervals — daily, weekly, and monthly — reveals a compelling narrative. These tools do not just aid in understanding market behavior; they empower traders with actionable insights, enabling them to harness and capitalize on the inherent volatility. With $BIS exhibiting considerable fluctuations, the scenario is ripe for traders who excel in rapid, short-term trading strategies.
In essence, the narrative of $BIS serves as a case study in how modern traders can transform data into a decisive competitive advantage, leveraging it to sculpt more effective and proactive market strategies. This strategic edge is crucial in a trading environment where precision and foresight are the linchpins of success.
Here are the average daily, weekly and monthly trading ranges for $BIS over the past year.
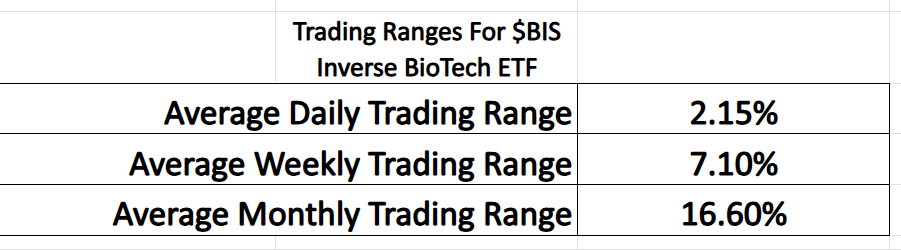
These levels demonstrate the average level of volatility that $BIX has exhibited. The challenge is learning how to apply them moving forward. Enter stage right the VantagePoint A.I. Daily Range Forecast which assists traders on anticipating the day’s trading range.
Here is a chart of how accurate the Daily Range forecast has been.
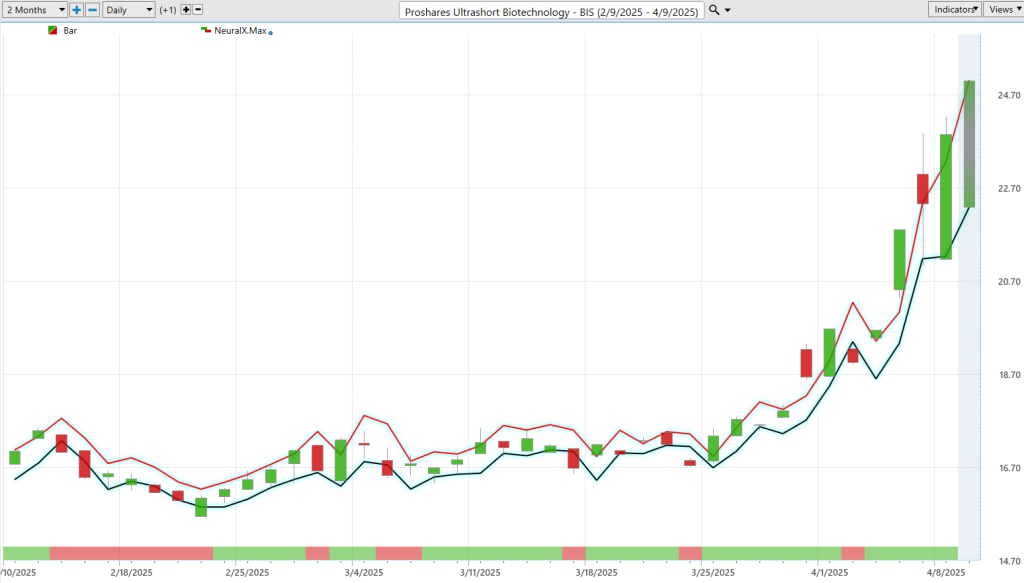
Look at how clearly the trend has been delineated.
Think of this tool as your secret weapon in the trading trenches. It’s not just showing you the ropes — it’s about grabbing tomorrow’s market insights, today. With this kind of firepower at your fingertips, you’re not just in the game, you’re dominating it. You’ve got the clarity and foresight to transform market mayhem into a well-oiled strategy. It’s like having the ultimate cheat sheet that lets you call the shots with the cool confidence of a seasoned pro. Make your moves with precision; make them count.
Intermarket Analysis
Intermarket analysis offers a nuanced approach to trading by examining the connections between different asset classes, including equities, bonds, commodities, and currencies. This method is particularly useful for traders of the ProShares UltraShort Nasdaq Biotechnology ETF (BIS), which is designed to deliver twice the inverse performance of the Nasdaq Biotechnology Index daily. The performance of this ETF is directly influenced by the Biotech sector but also responds to broader market dynamics. For instance, positive trends in the equity market could depress BIS due to its inverse relationship with the Biotech index it tracks, while a bearish market could elevate BIS’s value.
Moreover, several factors impact BIS through intermarket relationships, including equity market sentiment, interest rates, the strength of the U.S. dollar, and overall market volatility. For example, rising interest rates often lead to lower Biotech stock prices, beneficial for BIS due to its inverse nature. Similarly, a strong U.S. dollar can hurt Biotech firms with significant overseas revenue, which in turn can lift BIS. Understanding these interconnections enables traders to make more informed, strategic decisions, effectively converting market complexities into advantageous trading opportunities.
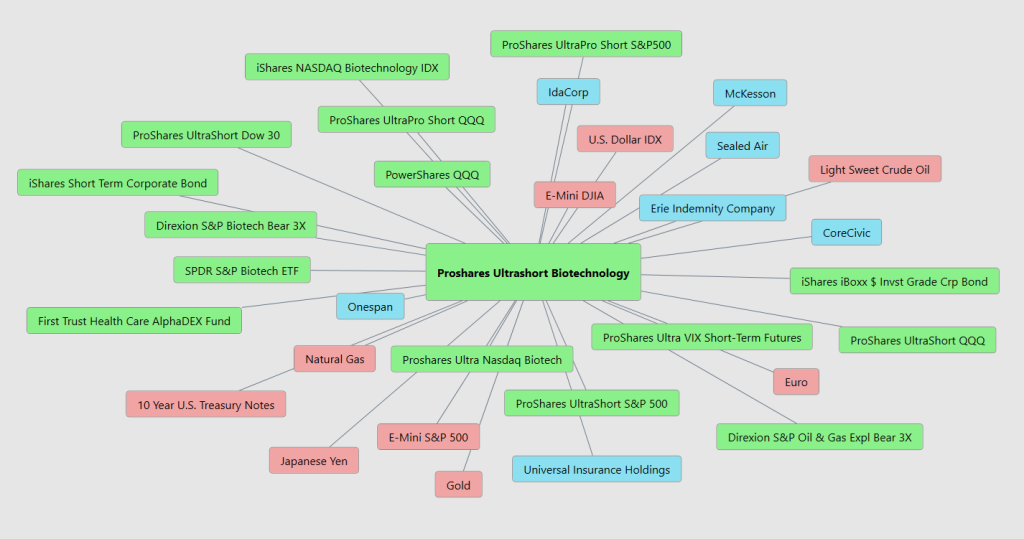
Below is a chart of the 31 top key drivers of price action for $BIS.
Our Suggestion
Picture this: $BIS, the barometer for Biotech blues, rocketed from a snooze-inducing $16.75 up to a jaw-dropping $25.081 between March 10 and April 9, 2025. That’s not just growth; that’s a staggering 49.7% explosion in just one month! What’s driving this wild ride? Well, it’s likely the big Biotech leagues like Amgen, Biogen, and Gilead didn’t quite hit their marks. Maybe some clinical mishaps, regulatory hiccups, or jittery investors pulling back from those speculative, high-flyer stocks. Not to mention the tariff crashes. During the recent tariff tantrum all Biotech stocks performed very poorly.
Now, let’s talk turkey about what else is juicing up $BIS’s numbers. Interest rates are behaving like a yo-yo lately — rising Treasury yields are bad news for the Biotech band, which thrives on cheap cash to fuel their R&D dreams. If yields are up, it’s like a cold shower for growth stocks. On the flip side, if those yields were to drop, you’d see Biotech stocks — and inversely, $BIS — heading south.
And don’t get me started on market mood swings! A shift to safer assets sends these high-beta Biotech stocks into a tailspin, lifting $BIS as investors say “no thanks” to risk. Plus, throw in some good old market chaos (thanks, VIX), and $BIS’s leveraged bets magnify every twist and turn, making even a small hiccup look like a full-blown convulsion. With $BIS’s 2x leverage, you’ve got a scenario where even minor Biotech blunders get amplified into major market moves, painting a clear picture of sustained sector weakness — minimizing the usual decay these leveraged ETFs suffer. Strap in, folks, it’s a wild market out there!
We recommend that you place $BIS on your trading radar. It can create numerous trading opportunities over the next year.
Practice good money management on all your trades and utilize the VantagePoint Daily Range forecast for trading guidance.
It’s not magic.
It’s machine learning.
Let’s be careful out there!
Disclaimer: THERE IS A HIGH DEGREE OF RISK INVOLVED IN TRADING. IT IS NOT PRUDENT OR ADVISABLE TO MAKE TRADING DECISIONS THAT ARE BEYOND YOUR FINANCIAL MEANS OR INVOLVE TRADING CAPITAL THAT YOU ARE NOT WILLING AND CAPABLE OF LOSING.
VANTAGEPOINT’S MARKETING CAMPAIGNS, OF ANY KIND, DO NOT CONSTITUTE TRADING ADVICE OR AN ENDORSEMENT OR RECOMMENDATION BY VANTAGEPOINT AI OR ANY ASSOCIATED AFFILIATES OF ANY TRADING METHODS, PROGRAMS, SYSTEMS OR ROUTINES. VANTAGEPOINT’S PERSONNEL ARE NOT LICENSED BROKERS OR ADVISORS AND DO NOT OFFER TRADING ADVICE.


