


| This Week’s a.i. Stock Spotlight is BioNTech SE ($BNTX) |
BioNTech SE ($BNTX) is a German biotechnology company focused on developing and manufacturing advanced immunotherapies for cancer and infectious diseases. The company gained global recognition for co-developing one of the first mRNA-based COVID-19 vaccines, known as Comirnaty, in partnership with Pfizer. BioNTech’s primary focus is on leveraging mRNA technology to develop personalized cancer therapies, vaccines, and other treatments. Their expertise lies in utilizing the body’s immune system to target and destroy cancer cells, along with advancements in mRNA-based drugs for various diseases.
$BNTX’s roots lie in oncology, where it initially focused on personalized cancer therapies using mRNA technology. This diversification remains a core part of its long-term strategy, as BioNTech has continued to develop its oncology pipeline alongside vaccine innovations. Despite declining COVID-19 vaccine revenues and a €808 million net loss in Q2 2024, BioNTech’s strong cash reserves of over €18.5 billion give the company strategic flexibility to invest in future growth areas like cancer treatments, mRNA manufacturing in Africa, and AI-driven drug discovery through its acquisition of InstaDeep Ltd.
In addition to its oncology and vaccine developments, BioNTech is working on a combination COVID-19 and influenza vaccine, which is currently in Phase 3 trials. The company’s diversified approach also includes its ongoing partnerships, such as the one with CEPI, to establish mRNA vaccine manufacturing capabilities in Rwanda, emphasizing its commitment to global health solutions. Investors may find the 19.2% insider ownership appealing, signaling confidence from the management team. However, increasing R&D expenses and legal provisions related to contractual disputes present potential risks. BioNTech’s significant insider and institutional ownership, combined with its strong financial foundation, position it for growth despite near-term challenges.
BioNTech generates revenue primarily from its collaborations and partnerships, including its significant deal with Pfizer for the COVID-19 vaccine, which brought in substantial revenue from vaccine sales and distribution globally. The company also earns revenue from collaborations with other pharmaceutical companies for drug development. As of 2023, BioNTech employs around 4,000 people across various locations, focusing on research, development, and commercialization of next-generation therapies in immuno-oncology, infectious diseases, and beyond.
In BioNTech’s most recent earnings call for Q2 2024, the company reported a net loss of €808 million, a significant increase from the €190 million loss in the same quarter last year. Revenues dropped to €129 million, down from €168 million, mainly due to reduced COVID-19 vaccine demand and inventory write-downs by their partner, Pfizer. Despite the losses, BioNTech continued to make progress in its oncology pipeline, with positive developments in its melanoma vaccine trials and variant-adapted COVID-19 vaccines for future seasons. The company also maintained a strong cash position of €18.5 billion, allowing them flexibility for strategic investments and ongoing research.
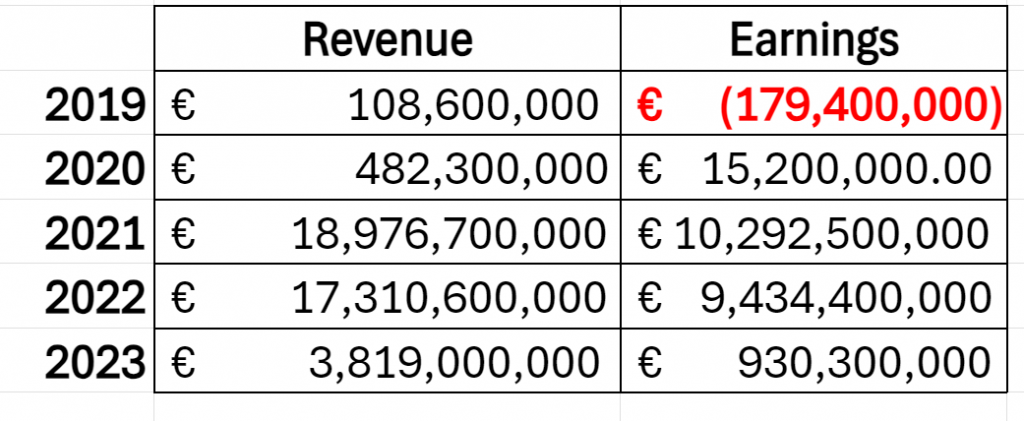
Below is a graphic of the revenue and earnings that $BNTX has generated over the last 5 years. This is the most volatile financial statement I have ever looked at. $BNTX were losing money in 2019, and they are projected to show losses in 2024. But look at the ride in between. Revenue exploded 17,374% with the introduction of the covid-19 vaccines! However, from 2021 to present revenues have declined 79.8%!
For 2024, BioNTech is projecting total revenues between €2.5 billion and €3.1 billion. This guidance primarily reflects expectations surrounding their COVID-19 vaccine franchise, which continues to be a significant driver of revenue, despite declining demand compared to previous pandemic years. Key factors influencing revenue include regulatory approvals, vaccine uptake, pricing, and potential inventory write-downs by their partner, Pfizer. Seasonal variations in COVID-19 circulation and government pandemic preparedness contracts also contribute to this outlook.
On the net income front, BioNTech expects to report a loss for the full year of 2024. This is largely due to ongoing high research and development costs, which rose significantly as the company advanced its oncology pipeline and increased administrative expenses. The net loss for Q2 2024 alone was approximately €808 million, reflecting these challenges and a shift in the company’s business model toward long-term growth strategies.
Challenges for BioNTech revolve around declining COVID-19 vaccine revenues as the pandemic demand wanes, contributing to their growing net losses. Additionally, higher research and development costs, up from €373 million to €585 million, as well as increasing administrative expenses, have pressured profitability. While the oncology pipeline shows promise, BioNTech remains largely dependent on the future success of new treatments and vaccines to regain momentum.
BioNTech is positioning itself to diversify beyond its COVID-19 vaccine success by leveraging its strong intellectual property in mRNA technology and expanding into oncology and A.I.-driven drug discovery. While its COVID-19 vaccine, Comirnaty, gave the company a dominant market share, BioNTech is now focused on building future revenue streams through personalized cancer treatments and innovative partnerships with global pharmaceutical leaders such as Pfizer and Roche. The company’s robust oncology pipeline, including mRNA cancer therapies, and advancements in AI-based drug development offer significant growth opportunities, addressing its dependence on pandemic-related revenues, which have sharply declined. However, it faces competition from companies like Moderna and CureVac, alongside potential legal risks, as it navigates this transition.
In this weekly stock study, we will look at an analysis of the following indicators and metrics which are our guidelines which dictate our behavior in deciding whether to buy, sell or stand aside on a particular stock.
- Wall Street Analysts Ratings and Forecasts
- 52 Week High and Low Boundaries
- Best-Case/Worst-Case Analysis
- Vantagepoint A.I. Forecast (Predictive Blue Line)
- Neural Network Forecast (Machine Learning)
- VantagePoint A.I. Daily Range Forecast
- Intermarket Analysis
- Our Suggestion
While we make all our decisions based upon the artificial intelligence forecasts, we do look at the fundamentals briefly, just to understand the financial landscape that $MKC is operating in.
Wall Street Analysts Ratings and Forecasts
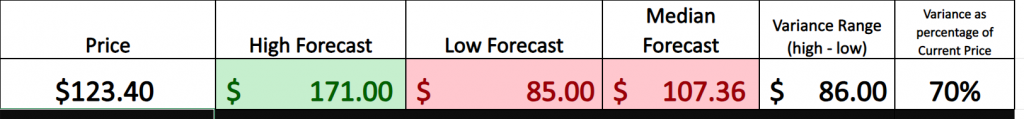
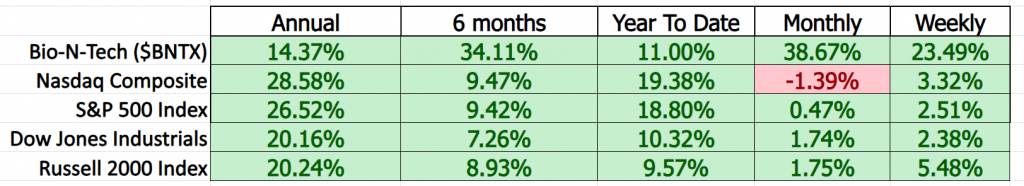
In the last three months, 13 Wall Street analysts have shared their 12-month price targets for BioNTech SE, with expectations ranging from a low of $85 to a high of $171. The consensus, however, lands at an average price target of $107.36, reflecting mixed views on the company’s post-COVID diversification efforts and future revenue streams.
These expectations from Wall Street Analysts clearly show the level of volatility that is baked in to $BNTX. What we always advise traders to do is to pay attention to the variance between the highest and lowest forecast, which is $86. This amount represents 70% of the current price and it provides us with a metric of expected volatility over the coming year.
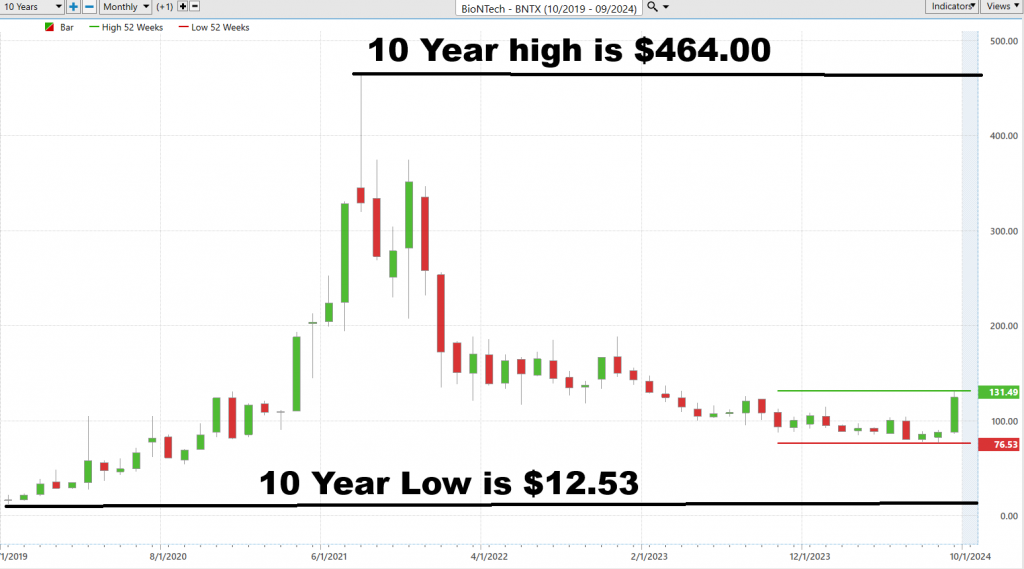
52 Week High and Low Boundaries
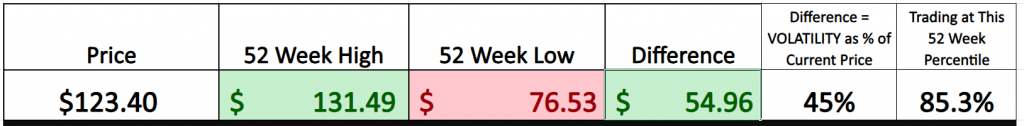
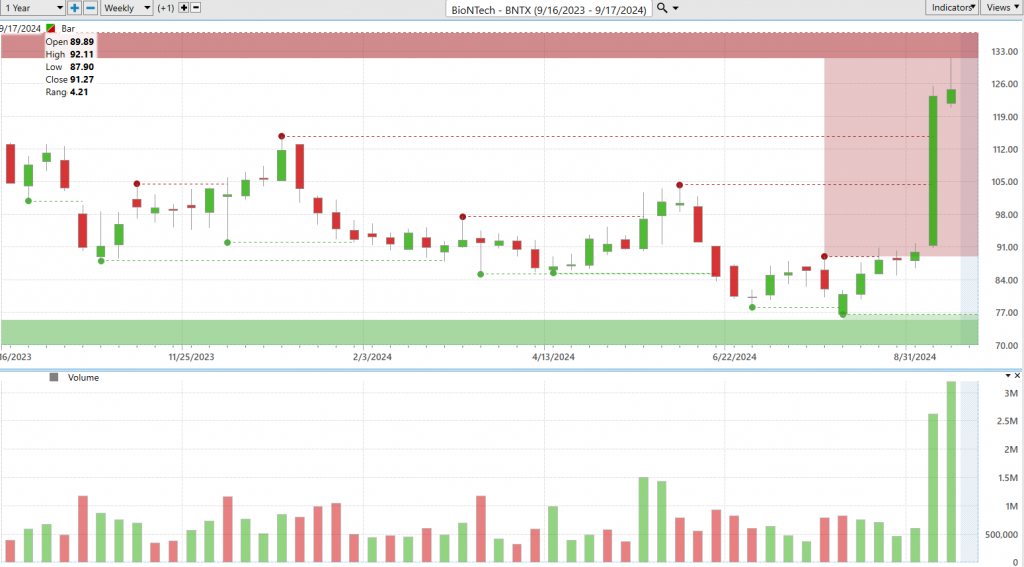
Smart traders know the importance of a stock’s 52-week high and low—these are more than just numbers; they’re critical benchmarks for understanding volatility and potential momentum. BioNTech’s trading over the last year is a perfect example of this. We’ve seen sharp pullbacks that signal just how volatile the stock has been, with the overall trend showing a slight downward bias. What’s interesting is how quickly it’s bounced back from those 52-week lows, hitting highs in just six weeks. The current momentum is upward, but it hasn’t been an easy ride for long-term holders. With a 45% volatility over the past year, this stock is anything but stable, though not as wild as some on Wall Street may have anticipated. Still, if you’re in it, you’ve been on a rocky path!
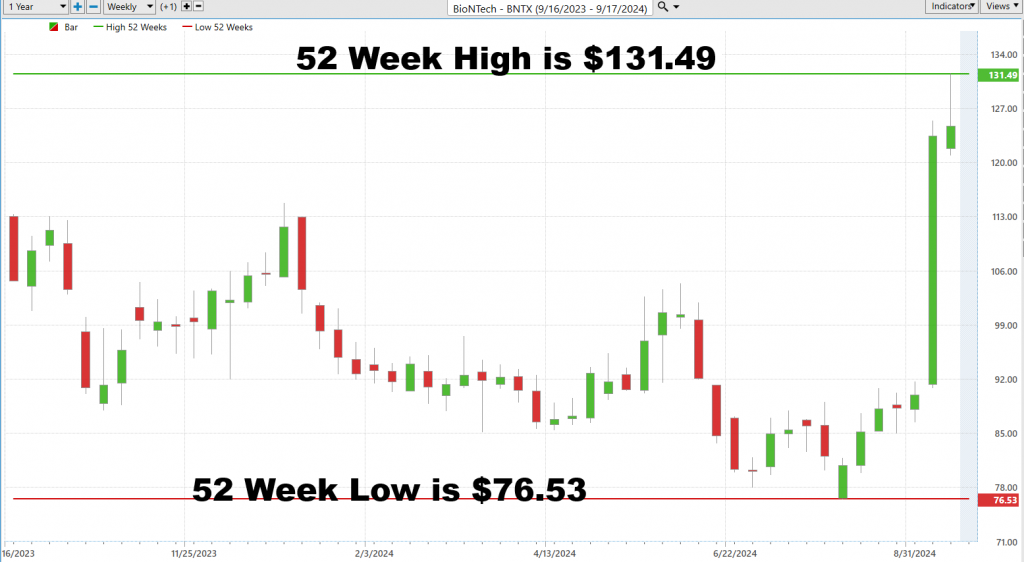
When we zoom out and study the longer term chart, we see that $BNTX as a biotech stock has been massively volatile for its entire lifespan.
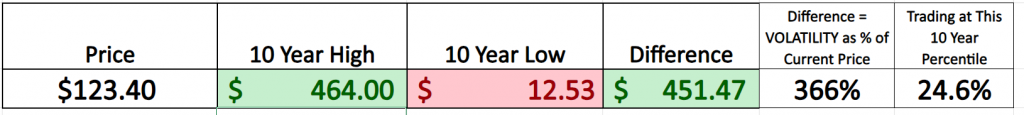
Biotech stocks are known for their inherent volatility, making them both high-risk and high-reward opportunities for traders. However, for those skilled at analyzing market trends and identifying key developments, these stocks can present incredible potential for significant gains.
Best-Case/Worst-Case Analysis
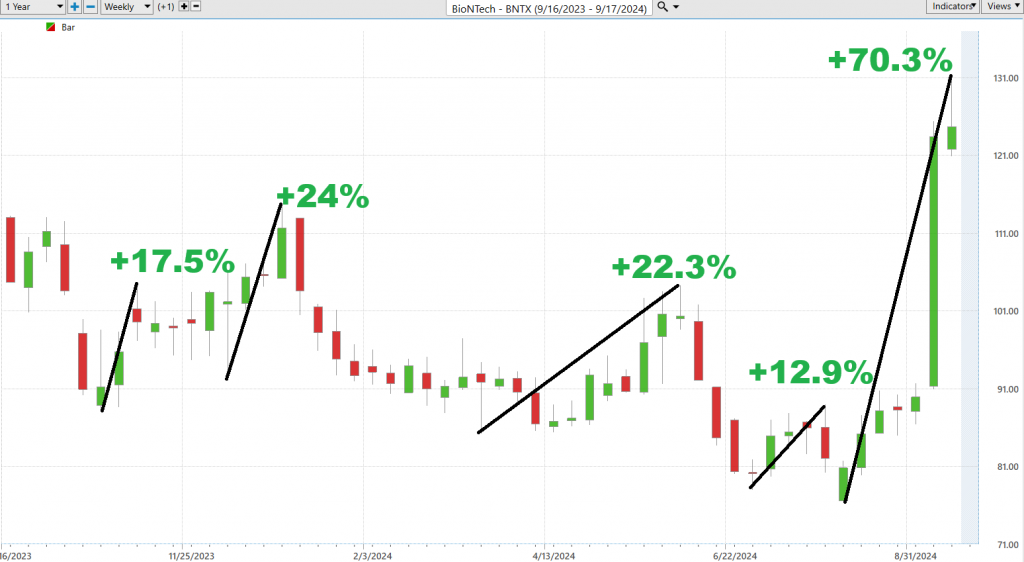
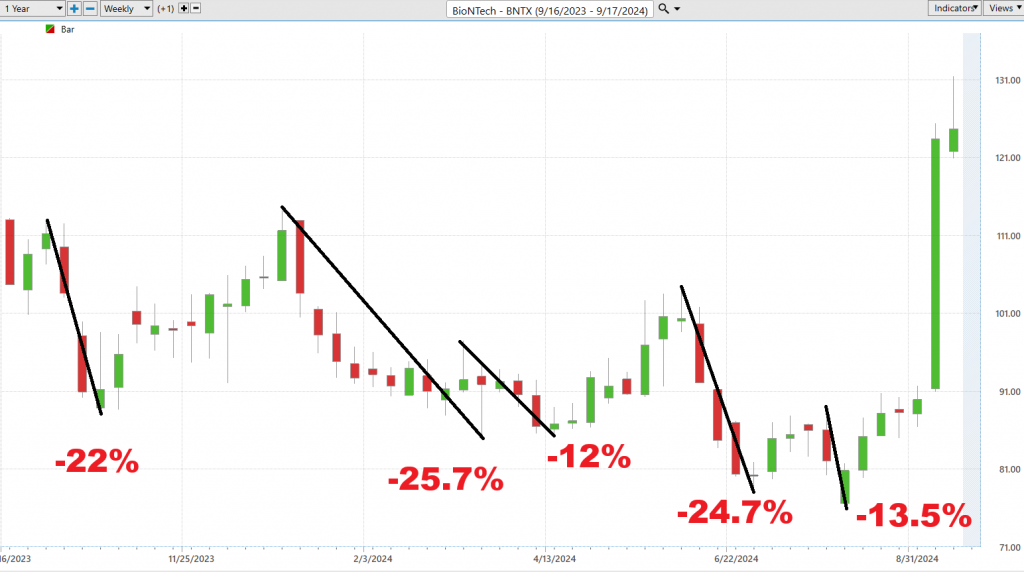
In the world of trading, it’s not the big wins that make or break your success—it’s how well you manage your losses. Risk management isn’t just a side strategy; it’s the very foundation of successful trading. I always stress to traders the importance of controlling risk, and one of the most effective ways to do this is by using a best-case/worst-case scenario approach. By mapping out uninterrupted rallies and declines over the past year, traders can better quantify the risks versus the rewards, which is crucial for navigating volatile markets like $MKC.
Understanding market volatility is about more than just eyeballing charts; it requires a deep dive into the strength of each rally and the severity of each pullback. By comparing the highs and lows, traders can get a real sense of the market’s temperament. It’s this kind of detailed analysis that separates the seasoned traders from those just gambling on hope. First, you must calculate the best-case scenario—buying at the lows and selling at the highs—and contrast that with the worst-case scenario, where a trader buys at the peak and sells at the bottom. This gives a true picture of the market’s risks and rewards, offering invaluable insights for navigating the often-rocky terrain of stock trading.
Too often, new traders jump into the market, driven by greed and an overestimation of their abilities. They fail to understand that the true measure of trading success isn’t in the grand wins but in minimizing the damage when things go south. Risk management is the golden rule, and the smart traders know this. They spend their time analyzing the volatility of the market, not making guesses but examining the actual price charts over the past year. These charts don’t just tell you where the market’s been; they give you a roadmap of its psychological swings, from euphoric highs to gut-wrenching lows.
The best traders break down these swings systematically. They don’t just hope for the best—they plan for the worst. By calculating both the size of each rally and the depth of each decline, they can accurately gauge market volatility. The key here is not just looking at the worst-case scenario but understanding the dynamics of both risk and reward. Yes, declines can be severe, but often, the rallies that precede them tell a different story. By balancing both the risks and rewards, traders can position themselves for success, no matter which way the market turns.
Here is the best-case analysis:
Followed by the worst-case analysis:
The purpose of this practical exercise, whether you are trading from the short or long side of the market, is to understand what is considered “normal” as far as $BNTX is concerned.
This methodology offers a realistic understanding of market volatility, empowering traders with the insights needed to withstand sudden and unpredictable financial swings. With clear, data-driven insights, the focus shifts from reactive decisions to proactive, calculated moves that safeguard trades in turbulent times.
Before diving into the market, it’s essential to perform this simple yet effective exercise: assess the largest uninterrupted rallies and declines from the past year. Armed with this information, you gain a comprehensive understanding of the market’s temperament, allowing for a more informed strategy. In the case of $BNTX, comparing its performance to broader stock market indices offers a valuable lens to gauge its volatility relative to market benchmarks over multiple time frames, providing crucial context for future decisions.
When we compare $BNTX to the broader market we see that on the longer term time frames the stock has struggled.
The beta for BioNTech ($BNTX) is 0.22.
Beta is a measure of a stock’s volatility compared to the overall market. A beta of 1 means the stock moves in line with the market, while a beta greater than 1 indicates higher volatility than the market, and a beta less than 1 means it’s less volatile. Since BioNTech’s beta is 0.23, this means that its stock is less volatile than the overall market. Essentially, if the market goes up or down, BioNTech’s stock tends to move much less in comparison. You can think of beta like a rollercoaster—if the market is a big, fast ride that has lots of ups and downs, BioNTech is like a smaller, slower rollercoaster that doesn’t go up or down as much as the broader market.
Vantagepoint A.I. Predictive Blue Line
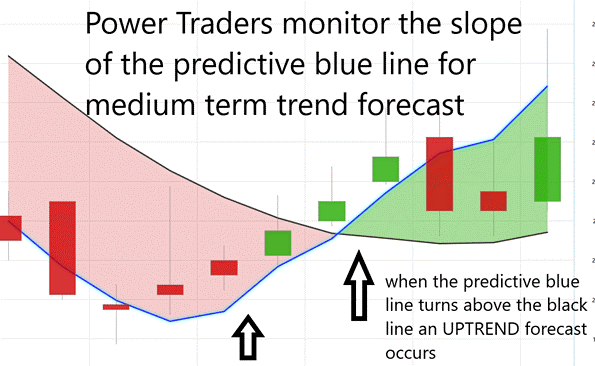
Let’s explore the strategic framework behind A.I.-driven market predictions for BioNTech ($BNTX), powered by VantagePoint Software. At the core of this analysis lies the predictive blue line—a sophisticated blend of artificial intelligence and intermarket data that helps identify emerging market trends. Think of it as your guiding compass, offering direction through the often-unpredictable currents of the financial markets.
The key here is to focus on two things: the slope of the predictive blue line and its relationship with the actual price. When this blue line crosses above the black line, it indicates a potential shift in trend. The principles are simple yet effective:
– The direction of the blue line forecasts the future trend and sets the stage for BioNTech’s market path.
– The “Value Zone” represents prime buying opportunities when prices are at or below the blue line and selling opportunities when prices are above it during a downtrend.
As the blue line slopes downward, it signals potential declines, encouraging traders to either pull back or hedge their positions accordingly. VantagePoint’s cutting-edge A.I. ensures traders stay informed, keeping a close eye on the direction of that all-important blue line.
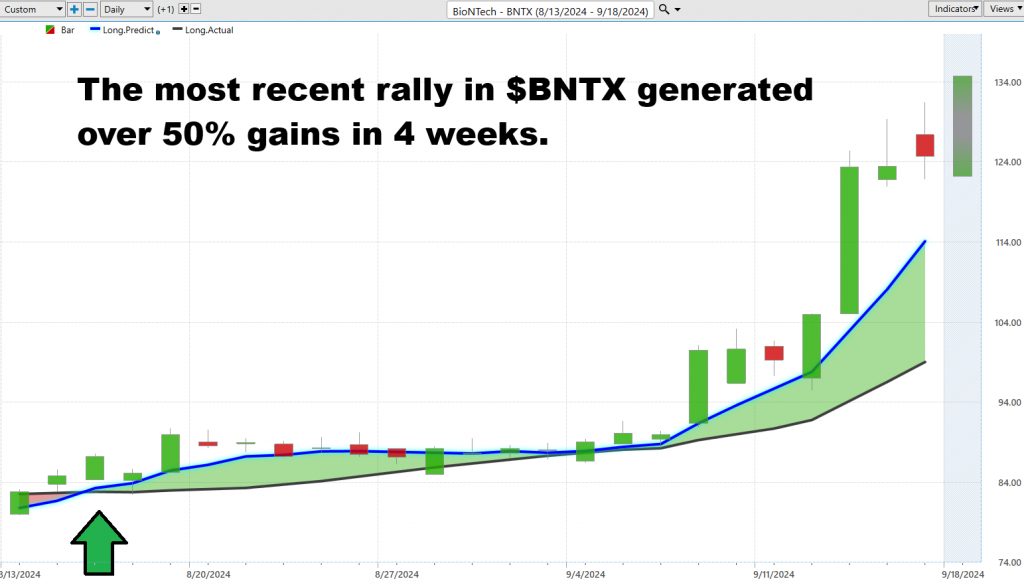
In today’s high-speed markets, traders are always on the lookout for that edge, that tool to cut through the noise and give them a clearer picture of what’s ahead. That’s where VantagePoint Software comes in—a standout in artificial intelligence that helps traders zero in on risk and reward with precision. The predictive blue line is like a financial GPS—if it’s pointing up, you’re looking at a bullish trend and potential buying opportunities. When it points down, it’s a warning that a bearish trend could be in play, signaling it may be time to sell.
But it’s not just about spotting trends. This tool gives traders the confidence to act when the moment is right, helping them lock in on the optimal times to make their moves and boost their chances of capturing those big gains.
Neural Index (Machine Learning)
Neural networks are essentially computer systems designed to mimic the way the human brain works. Picture a web of interconnected nodes, constantly communicating and sharing information—this is how neural networks function, sifting through vast amounts of data, such as stock prices, trading volume, correlations, and earnings reports, to identify hidden patterns. It’s as if you have a group of friends each bringing a unique piece of the puzzle to the table, helping you see the bigger picture that would be impossible to detect on your own.
For traders, neural networks have become invaluable. By uncovering patterns too intricate for human analysis, these systems provide critical insights into when to buy or sell, reducing human error and increasing prediction accuracy. In a world where every second counts, neural networks offer real-time insights into market trends, constantly learning and evolving to help traders stay ahead. As financial markets grow more complex, these intelligent systems are becoming indispensable tools for those looking to make smarter, faster decisions.
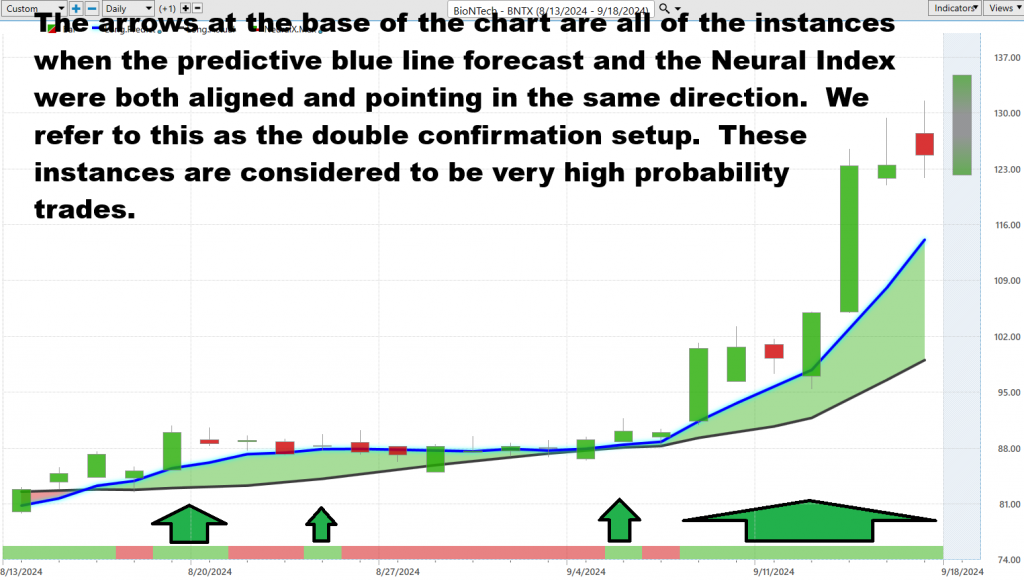
At the base of the VantagePoint chart is the Neural Index. When it flashes green it is anticipating strength for the next 48 to 72 hours. When it flashes red it is anticipating weakness for the same time frame. We advise Power Traders to wait until the Neural Index and the Predictive Blue line are both in alignment. Traditionally these are very high probability trades.
VantagePoint Software Daily Price Range Prediction
Let’s take a look at the groundbreaking technologies reshaping the landscape of trading: artificial intelligence (A.I.), machine learning, and neural networks. For traders aiming to pinpoint the next day’s trading range with precision, these tools are becoming essential. By sifting through vast troves of historical market data, A.I.-driven systems identify the key patterns, trends, and correlations that drive price movements in the markets.
Machine learning is remarkable at detecting these patterns, while neural networks elevate predictive modeling to an entirely new level. Together, they give traders the ability to forecast price shifts with striking accuracy. This real-time analysis allows traders to stay nimble, reacting quickly to the market’s ever-changing dynamics. In the fast-paced world of finance, defining trading ranges accurately is critical for managing risk and making smart decisions. A.I. provides traders with a competitive edge, enhancing their ability to analyze data, identify opportunities, and fine-tune their strategies in an increasingly complex environment.
Now, let’s break down real-world volatility by examining the average trading ranges on a daily, weekly, and monthly basis.
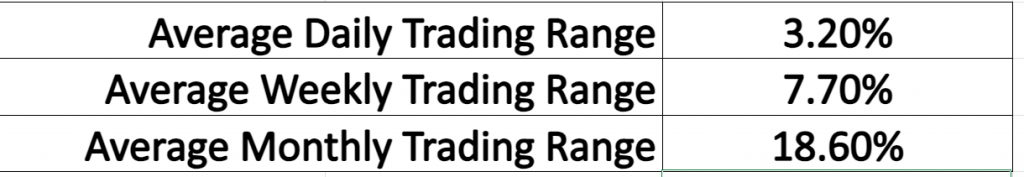
This type of volatility is what experienced traders look for because it creates incredible opportunity, but with that there is the ever-present risk of adverse price action.
The challenge now lies in how to harness this data and apply it to the market in real time. For traders, the real test is knowing the precise entry and exit points ahead of time—an elusive goal that can make or break a trade. This is where VantagePoint’s A.I. software steps in, offering a game-changing advantage.
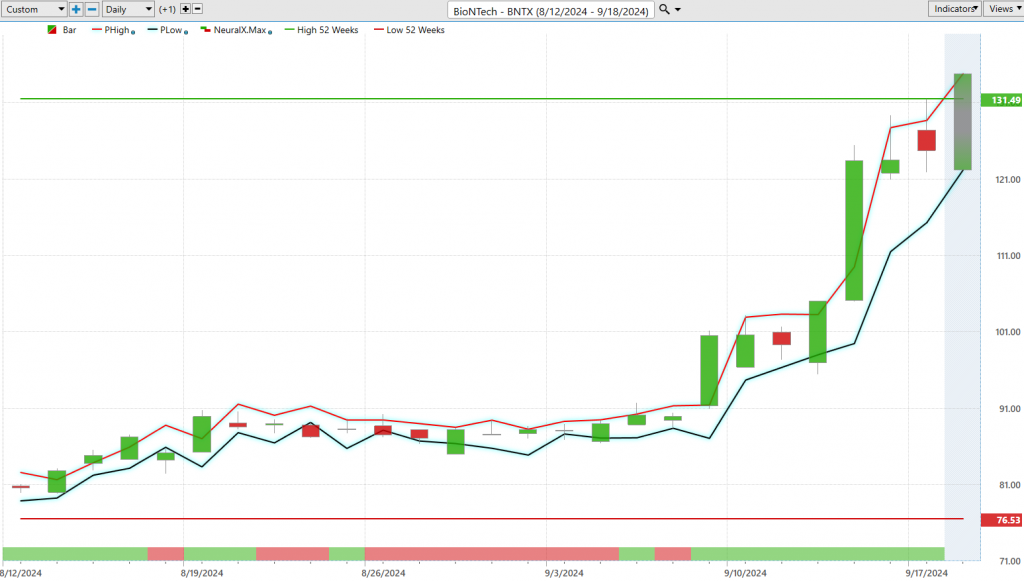
Let’s focus on the Daily Range Forecast chart, a crucial tool for short-term swing traders. This isn’t just another chart—it acts as a predictive roadmap, laying out the anticipated trajectory for each trading day. In today’s fast-moving markets, precision isn’t a luxury, it’s a necessity. VantagePoint’s A.I. technology, fueled by machine learning and neural networks, goes beyond crunching numbers. It taps into the market’s rhythm, offering real-time insights to help traders navigate volatile swings and zero in on optimal entry points. In trading, being ahead of the curve isn’t just beneficial—it’s essential.
Intermarket Analysis
In the world of trading, the ability to see how different markets are interconnected can be a game-changer. This is the essence of intermarket analysis, a method that allows traders to view markets like stocks, bonds, currencies, and commodities as pieces of a larger puzzle. By understanding how these markets influence one another, traders can get a clearer picture of future price movements. Louis Mendelsohn, the founder of VantagePoint A.I., revolutionized this approach by developing software that incorporates intermarket analysis, giving traders a critical edge.
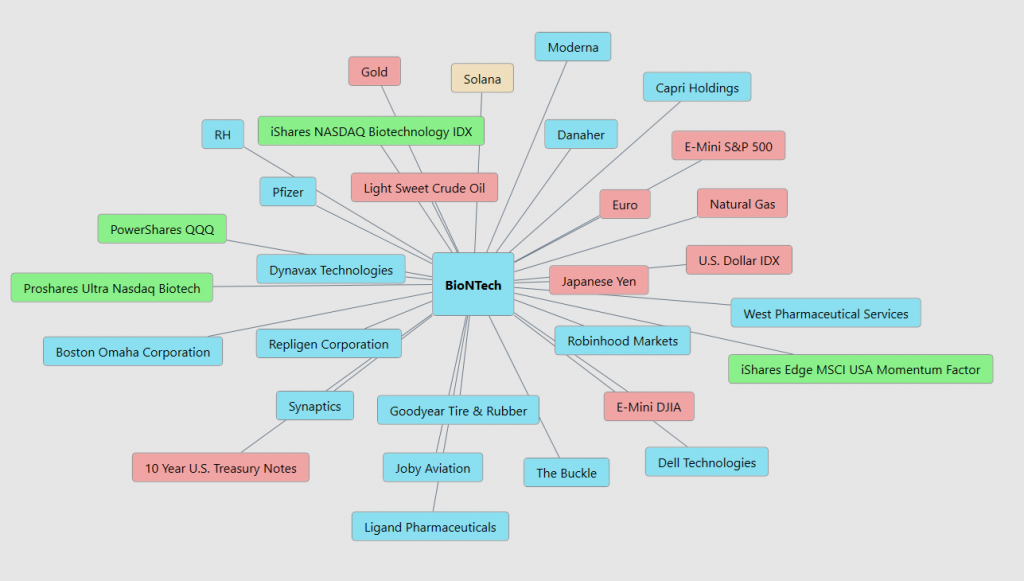
So, what exactly is intermarket analysis? At its core, it’s the study of how different financial markets affect each other. For example, if oil prices spike, that could influence the stock prices of industries heavily dependent on energy, such as airlines. Mendelsohn’s VantagePoint software goes even further, analyzing multiple markets simultaneously to uncover patterns that might go unnoticed if you were only focusing on one. By connecting the dots between markets, traders can make more informed decisions, improving their ability to predict trends and manage risk.
This approach is crucial in today’s interconnected global economy. As markets become increasingly interdependent, understanding the ripple effects of changes in one market on another has never been more important. Intermarket analysis provides a holistic view of the financial landscape, helping traders identify emerging opportunities and risks.
Our Suggestion
Let me make this clear—trading BioNTech ($BNTX) is not for the faint of heart. The volatility here is no joke, and if you’re a newbie, this stock will eat you alive. BioNTech’s Q2 2024 earnings report paints a picture of a company grappling with transition, shifting from its COVID-19 vaccine-driven revenues to a broader focus on oncology and mRNA-based therapies. Their revenue took a nosedive, dropping to €129 million, a stark 23.3% decline from the previous year, largely due to reduced demand for its COVID-19 vaccine, *Comirnaty*. On top of that, the company posted a net loss of €808 million, with soaring R&D and administrative expenses eating away at the bottom line. But here’s the kicker—they’re not backing down. R&D spending shot up to €585 million, reflecting their commitment to innovation, especially in oncology and AI-driven drug discovery.
Now, listen closely—if you’re trading $BNTX, you better have your eyes glued to the A.I. forecasts. VantagePoint’s daily guidance is a must. It’s your roadmap in this wild ride, pinpointing short-term opportunities amid the turbulence. BioNTech’s made strides in personalized cancer therapies and launched a variant-adapted COVID-19 vaccine, but don’t let the shiny new products fool you—revenues from these are expected to fall short compared to pandemic highs. And while their €18.5 billion cash position gives them a cushion, their heavy reliance on COVID-19 vaccines is still a major concern. They’re expanding globally, partnering with CEPI to establish vaccine manufacturing in Rwanda, but long-term success depends on whether their oncology pipeline delivers.
This stock is volatile, folks. So, if you’re jumping into the BioNTech fray, make sure you’re practicing good money management. You need to control your risk, and that starts with following the A.I. guidance. If you can’t handle the heat, stay out of the $BNTX kitchen.
BioNTech’s next earnings call is expected to take place on Monday, November 4, 2024. This will be the catalyst for price action moving forward. The stock has seen a recent surge with accompanying heavy volume. This is traditionally very supportive of price over the longer term, but the stock has very firm resistance overhead at present.
Use the daily forecast for shorter term trading opportunities.
Let’s Be Careful Out There!
It’s Not Magic.
It’s Machine Learning.
Disclaimer: THERE IS A HIGH DEGREE OF RISK INVOLVED IN TRADING. IT IS NOT PRUDENT OR ADVISABLE TO MAKE TRADING DECISIONS THAT ARE BEYOND YOUR FINANCIAL MEANS OR INVOLVE TRADING CAPITAL THAT YOU ARE NOT WILLING AND CAPABLE OF LOSING.
VANTAGEPOINT’S MARKETING CAMPAIGNS, OF ANY KIND, DO NOT CONSTITUTE TRADING ADVICE OR AN ENDORSEMENT OR RECOMMENDATION BY VANTAGEPOINT AI OR ANY ASSOCIATED AFFILIATES OF ANY TRADING METHODS, PROGRAMS, SYSTEMS OR ROUTINES. VANTAGEPOINT’S PERSONNEL ARE NOT LICENSED BROKERS OR ADVISORS AND DO NOT OFFER TRADING ADVICE.


