


| This Week’s a.i. Stock Spotlight is D.R. Horton ($DHI) |
D.R. Horton, Inc., ticker symbol $DHI, is the largest home construction company in the United States by volume. The company was founded in 1978 by Donald R. Horton and has since expanded to become a leading name in residential development. D.R. Horton’s headquarters is located in Arlington, Texas. The company operates multiple profit centers across its extensive portfolio, including the construction and sale of homes, providing mortgage financing, and offering title insurance services.
D.R. Horton ($DHI) stands out as a paragon of growth and innovation in the homebuilding industry, rapidly ascending to the top-10 homebuilders within just a decade of its inception and today employs over 9,500 individuals. From its first home sale priced at $38,000, DHI has consistently led the market in adopting advanced techniques, such as prefabricated construction, and has committed to sustainable practices well ahead of the curve. The company’s strategic resilience was notably displayed when it emerged stronger from the 2008 recession, smartly capitalizing on lower land prices. Moreover, DHI’s dedication to diversity in market strategy is evident in its effective multi-brand approach, catering to a varied customer base and maintaining high levels of customer satisfaction. DHI’s robust internal leadership, evidenced by having only three CEOs in over four decades, complements its commitment to strong leadership.
$DHI’s primary revenue comes from building and selling homes across a variety of market segments, from entry-level to luxury, accommodating a broad spectrum of buyers. Its largest revenue generator remains the sale of single-family homes, with an increased emphasis on affordability and energy efficiency to meet current market demands.
The company has managed to maintain a healthy balance sheet with a moderate debt-to-equity ratio, currently standing at approximately 0.30. A debt-to-equity ratio of 0.30 means that for every dollar of equity, the company has 30 cents in debt. This financial metric is used to gauge a company’s financial leverage by comparing its total liabilities to its shareholders’ equity. A ratio of 0.30 indicates a relatively low level of debt compared to the equity, suggesting that the company is not heavily reliant on debt to finance its operations. This can be seen as a sign of financial stability, as the company is potentially less vulnerable to fluctuations in its operating income and has a more conservative capital structure. This lower leverage ratio might also indicate that the company has ample room to borrow additional funds if needed, without excessively burdening its balance sheet.
It competes with other major homebuilders such as Lennar Corporation, PulteGroup, and Toll Brothers. Despite stiff competition, D.R. Horton has maintained a leading position due to its widespread geographic presence and diverse range of offerings.
Over the past 30 days, D.R. Horton has been involved in several notable activities that signal both opportunities and challenges:
Strategic Land Acquisitions: D.R. Horton has continued its aggressive land acquisition strategy, securing parcels in key growth markets. This positions the company well for future expansion but also presents risks associated with overexposure to market downturns.
Market Trends and Economic Factors: With the current volatility in interest rates and regulatory environments, there is both an opportunity and a risk. Lower interest rates can spur home buying, but increases might slow down the housing market, impacting sales.
The biggest opportunity for D.R. Horton lies in expanding into new geographic markets and further diversifying its product offerings to cater to a broader customer base. However, the risks include potential economic downturns affecting the real estate market, rising material costs, and changes in consumer preferences.
D.R. Horton’s products primarily include single-family detached homes, townhomes, condominiums, and multi-family units. Over the last decade, the company has acquired several smaller homebuilders which has allowed it to rapidly enter new markets and expand its footprint.
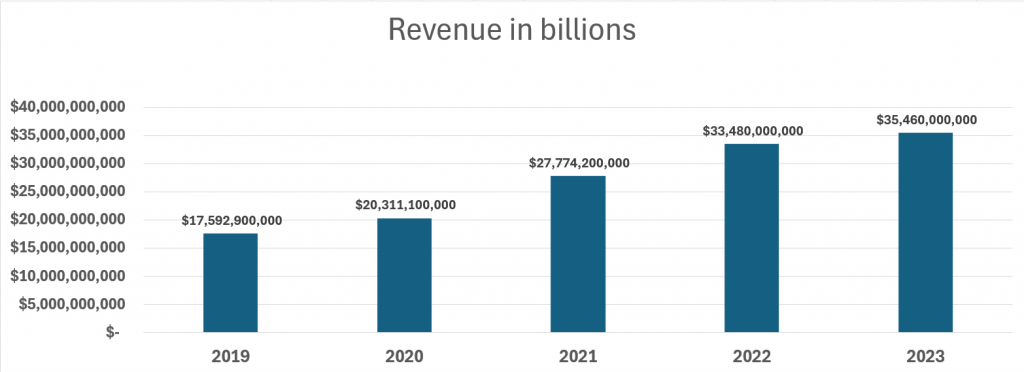
In the recent earnings calls from D.R. Horton, the company presented an impressively robust set of financial results. Despite the prevailing uncertainties in the economic landscape, D.R. Horton not only surpassed Wall Street expectations but also showcased a strategic prowess in navigating supply chain challenges and leveraging rising home demand. The firm’s profit margins expanded, underscoring efficient operations and a keen ability to capitalize on favorable market conditions. Revenue growth was particularly notable in their single-family homes segment, which remains their bread and butter in terms of sales.
Over the last 5 years $DHI has grown Revenue by 101%!
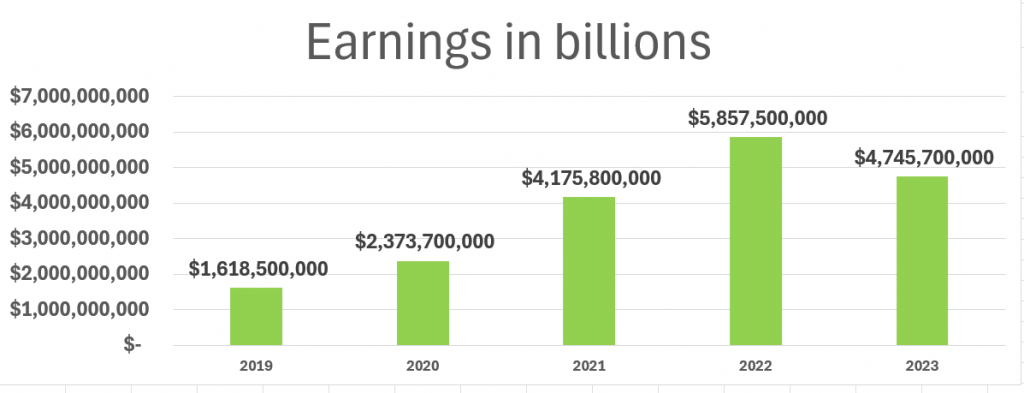
Earnings have increased 193% over the same time frame.
Further detailing their achievements, D.R. Horton’s management highlighted their aggressive land acquisition strategy, which positions them strategically for future growth. They emphasized ongoing efforts to enhance their portfolio and enter new markets, ensuring long-term sustainability. However, they also prudently acknowledged the potential headwinds of rising interest rates and the impact of inflationary pressures on material costs. The calls ended on a note of cautious optimism, with a clear message that D.R. Horton is well-prepared to face these challenges head-on, continuing to build shareholder value through strategic growth and operational excellence.
D.R. Horton stands as a testament to sustained growth and strategic market positioning in the competitive homebuilding industry. Its ability to navigate economic cycles, combined with a strategic approach to market expansion and customer satisfaction, underlines its status as a market leader. However, as with any entity tied closely to economic tides, it faces ongoing challenges that require adaptive strategies and proactive management.
In this weekly stock study, we will look at and analyze the following indicators and metrics as are our guidelines which dictate our behavior in deciding whether to buy, sell, or stand aside on a particular stock.
- Wall Street Analysts’ Estimates
- 52-Week High and Low boundaries
- Best Case – Worst Case Analysis
- Vantagepoint A.I. Forecast (Predictive Blue Line)
- Neural Network Forecast
- Daily Range Forecast
- Intermarket Analysis
- Our Suggestion
We don’t base our decisions on things like earnings or fundamental cash flow valuations. However, we do look at them to better understand the financial landscape that a company is operating under.
Wall Street Analysts’ Estimates
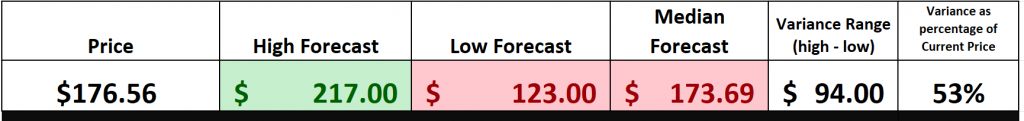
The latest Wall Street analysts’ forecasts for D.R. Horton, Inc. ($DHI) over the coming 12 months present a mixed but generally optimistic outlook. The average price target across several analyses is around $173.69, suggesting a slight downside potential of about -2.26% from the current trading price of approximately $177.70. Estimates of the highest price target reach up to $217.00, while the lowest drops to about $123.00, indicating a range of expectations regarding the company’s performance in the near future.
We always advise Power Traders to pay attention to the variance of expectations between the highest and lowest forecasts as this is usually very indicative of future volatility. This variance is $94 or roughly 53% of the current price. This level of volatility is high and warns traders of future price action.
It would be totally normal to see $DHI trade $94 $ higher and or lower from the current price over the next year. Equally are two important details, $DHI is fairly valued at the present time according to Wall Street forecasts and the variance of 53% is a level that should be monitored as this normally contains rallies and declines moving forward.
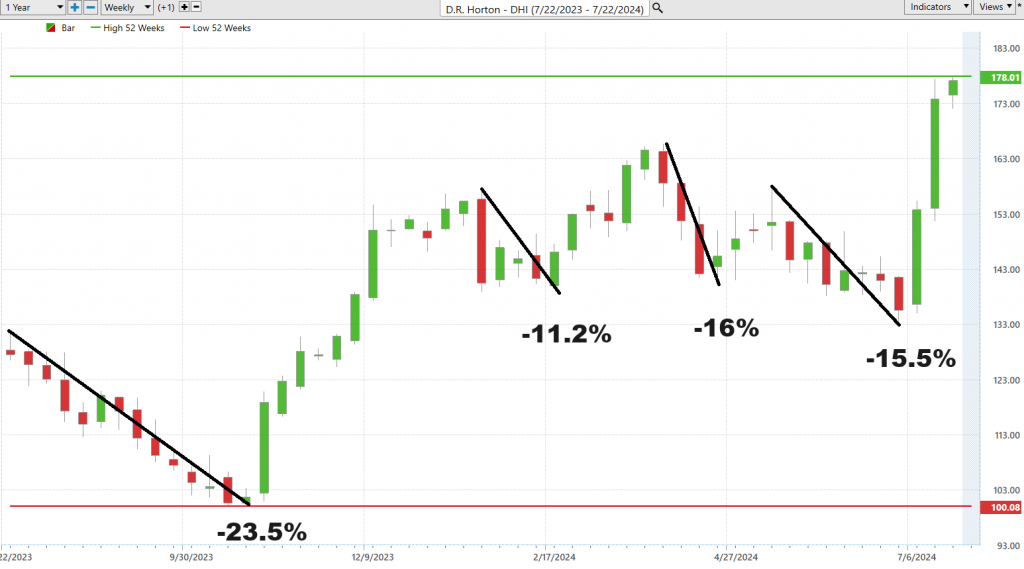
52-Week High and Low Boundaries
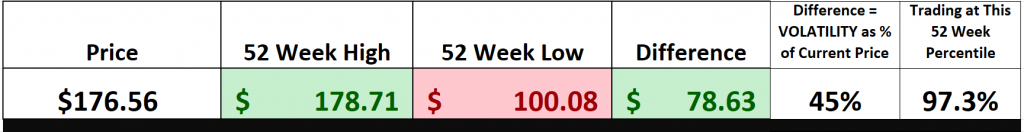
The 52-week high price for D.R. Horton, Inc. ($DHI) was $178.71, and the low was $100.08. Using the statistical volatility, which involves dividing the annual trading range ($78.63) by the current price ($176.50), we find a volatility measure of approximately 45%. This represents the proportion of the price variation relative to the current stock price. This calculation tells us that if the next 52 weeks is like the last 52 weeks we would expect $DHI to trade 45% higher and or lower than its current price level.
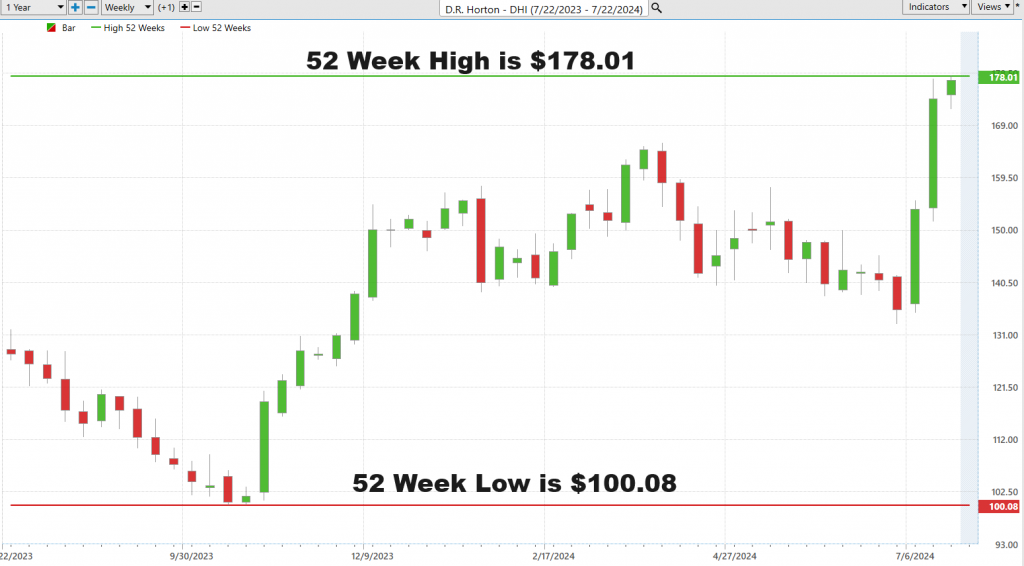
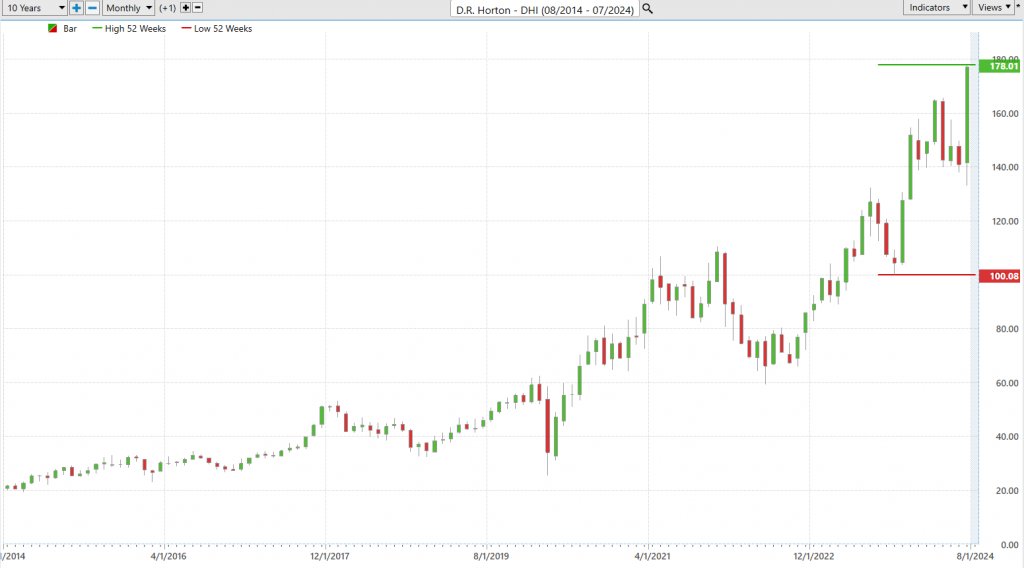
We also advise traders to pay very close attention to assets that are making new 10-year highs. This is rare whenever it occurs, but it clearly communicates that the company is overcoming all obstacles related to its success. Currently $DHI is making new 52-week highs and new 10 year high simultaneously. This is one of our all-time favorite trading setups.
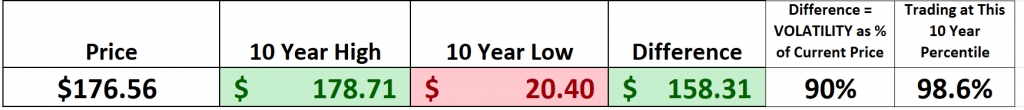
Here is what the 10-year metrics look like:
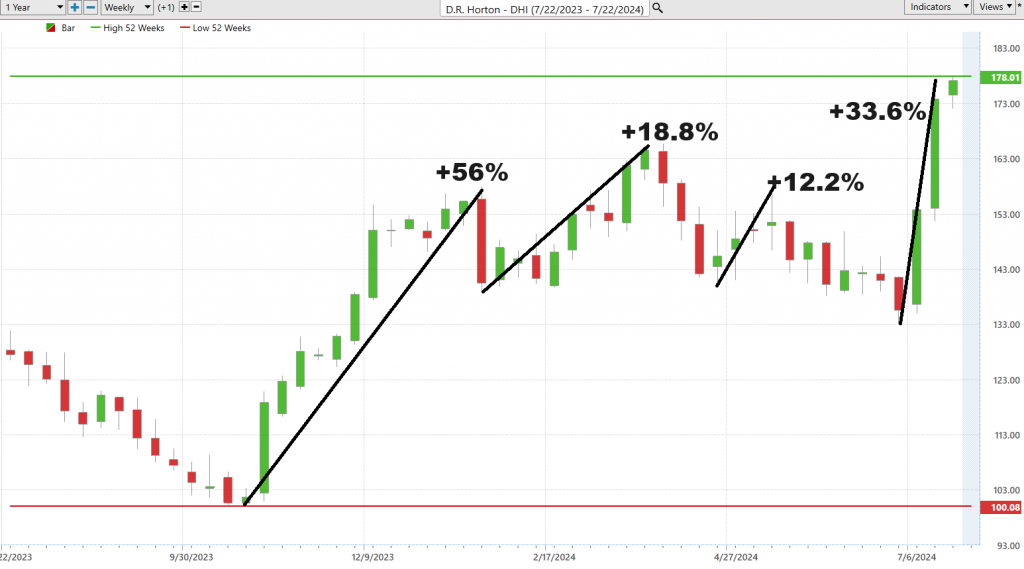
Best Case – Worst Case Analysis
In the world of trading, many inexperienced traders leap into the fray, their judgments clouded by greed and perilous overconfidence, grossly underestimating the market’s inherent risks. Herein lies a fundamental truth of trading — it’s not the dazzling sums made on successful bets, but the minimal losses sustained when the tides turn against us, marking the distinction between seasoned traders and newbies.
The art of risk management begins with an adept analysis of market volatility, gleaned not from guesswork but through the methodical examination of price charts over the previous year. Such charts serve not merely as visual aids but as stark maps of market sentiment and volatility, charting the highs of investor optimism against the troughs of collective fear. These graphical representations lay bare the swings from bullish exuberance to bearish retreat, enabling a trader to measure the pulse of the market with empirical clarity. Our purpose is to understand and easily quantify the best case and worst-case outcomes of the past year.
This quantitative dissection into the best-case scenarios—buying at lows and selling at highs—and worst-case predicaments—buying at peaks and offloading at troughs—reveals a critical narrative. The declines, though sharp, often pale against the backdrop of preceding rallies, suggesting a skewed risk-reward paradigm that might favor the bold yet cautious investor.
In other words, we can quantify the worst declines and compare them to the best rallies. We start off with the best-case analysis:
Followed by the worst-case analysis:
Thus, armed with this practical approach to understanding market dynamics, traders can set realistic expectations and strategize accordingly. This, above all, will equip you to navigate the volatility of the market with practical insights and safeguard your trades against the unpredictable whims of the financial world.
Now, let’s compare D.R. Horton ($DHI) to the broader stock market indexes and see where it stands.
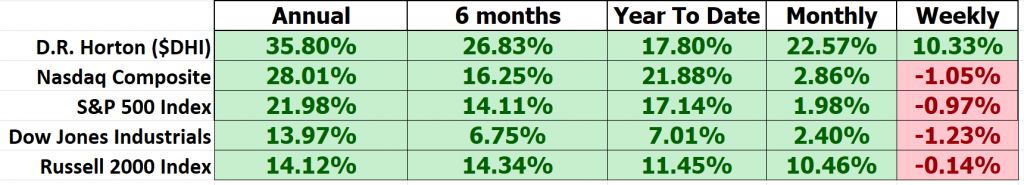
$DHI mostly outperforms over most time frames.
D.R. Horton, Inc. ($DHI) competes in the homebuilding industry with several notable publicly traded companies. Some of the key competitors include Lennar Corporation ($LEN), NVR, Inc. ($NVR), PulteGroup, Inc. ($PHM), Toll Brothers, Inc. ($TOL), and Meritage Homes Corporation ($MTH). These companies are well known in the homebuilding sector for their extensive operations across various states, offering a range of housing options from entry-level to luxury homes, like D.R. Horton’s offerings.
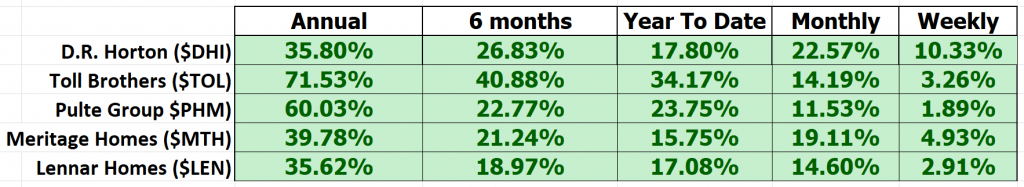
The conclusion to this analysis is the strength of the homebuilding sector. All these companies have done exceptionally well in an economic environment of higher interest rates which is counter intuitive.
The five-year beta for D.R. Horton (DHI) is 1.69.
Beta is a measure of a stock’s volatility in relation to the overall market. A beta of 1 indicates that the stock’s price moves with the market. A beta greater than 1 means the stock is more volatile than the market, while a beta less than 1 indicates it is less volatile.
With a beta of 1.69, $DHI is 69% more volatile than the market.
Vantagepoint A.I. Predictive Blue Line
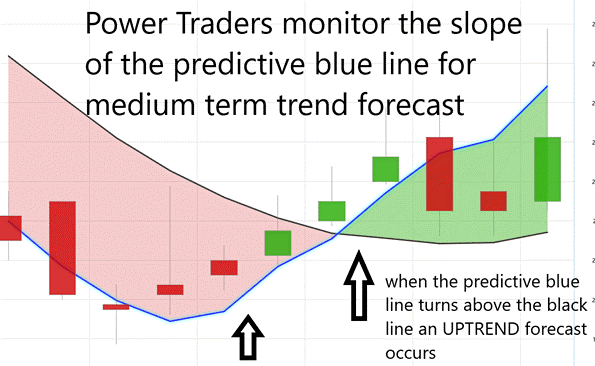
Let’s delve into the strategic framework that underpins the A.I. market predictions for D.R. Horton, guided by the adept VantagePoint Software. The pivotal element here, the predictive blue line, discerns the underlying market trends with a remarkable blend of artificial intelligence and intermarket analysis, offering traders a reliable beacon, much like the North Star, to navigate the volatile financial waters.
Pay close attention to the slope of the predictive blue line and how it interacts with price. When the predictive blue line closes above the black line a trend forecast occurs.
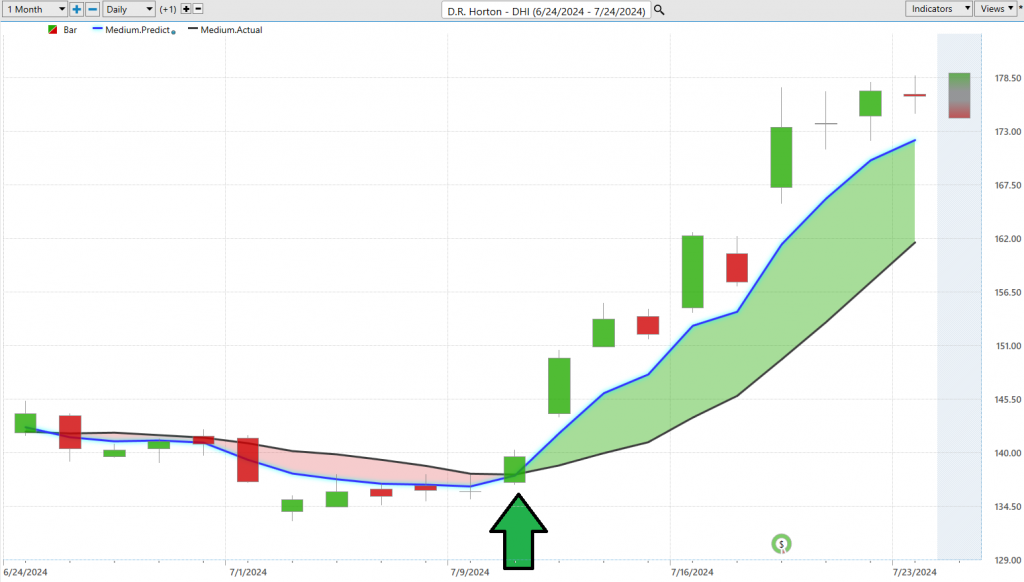
This sophisticated tool not only forecasts trends but aligns trading strategies with the most opportune moments, enhancing the potential for substantial gains. Recently, we’ve seen a pronounced uptrend in D.R. Horton’s stock, marked by a significant 27.81% surge over the last ten sessions, affirming the efficacy of this advanced analytical approach in identifying prime buying opportunities and optimal selling points, thus steering traders through the market’s ebbs and flows with unparalleled precision.
VantagePoint A.I. Neural Index (Machine Learning)
In the sophisticated world of financial trading, the Neural Network Indicator at the base of the trading chart is a cutting-edge tool that turns green to signal market strength, red to forecast weaknesses, and yellow for sideways movements. This tool uses a vast array of data to adapt and enhance its analytical power, offering traders high-probability forecasts and insights. By combining the Neural Network with the predictive blue line, traders can strategically pinpoint the most opportune moments for entry and exit, significantly leveraging their market position. This dual-confirmation approach underscores the power of AI in modern trading, providing a substantial edge by identifying subtle, non-linear relationships that traditional analysis might miss.
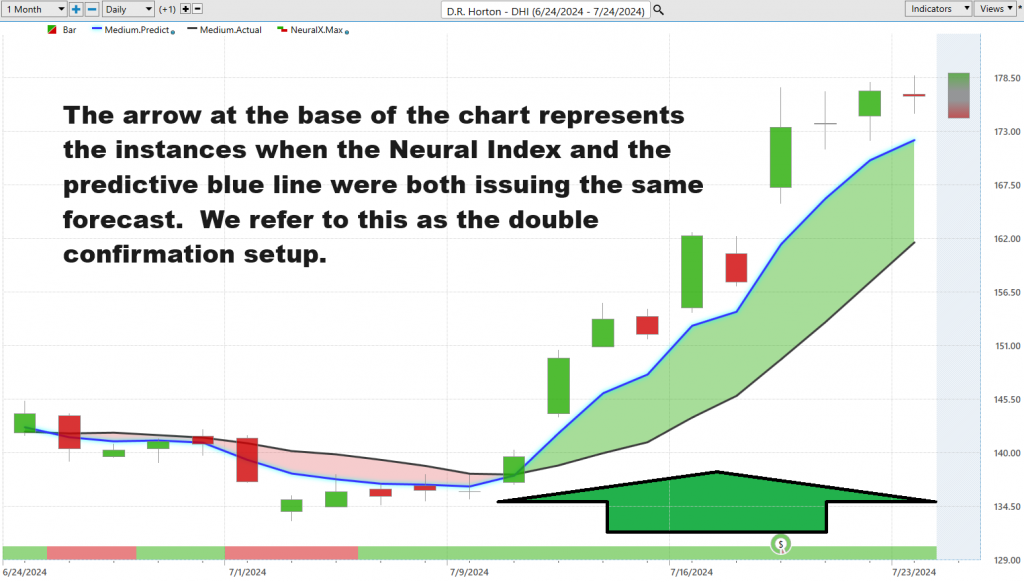
The Neural Network Indicator at the chart’s base is pivotal for financial analysts, indicating market conditions through color-coded alerts: green for strength, red for weaknesses, and yellow for neutral movements. This tool, underpinned by artificial intelligence, processes extensive data to optimize trading decisions. Neural networks, by analyzing various market signals like technical indicators and global events, provide dynamic insights that enhance risk assessment and opportunity identification. For traders, the synergy between this neural network and predictive analytics tools is crucial, especially in forming strategies for entering or exiting positions based on dual confirmations from AI-generated forecasts. This method significantly refines the trading approach, leveraging AI to outperform traditional analysis techniques.
VantagePoint A.I. Daily Range Forecast
VantagePoint Software, a staple among power traders, features a Daily Price Range prediction forecast, which sharpens the precision of market entry and exit strategies for assets like D.R. Horton ($DHI). This tool distills vast market data into actionable insights, offering predicted highs and lows that demarcate short term trading opportunities and trends. It guides traders on setting protective stops, reducing risk, and capitalizing on potential support and resistance zones. Additionally, it outlines a clear trading channel, helping swing traders to strategically pinpoint optimal buying and selling moments within predicted boundaries, thereby fostering judicious yet potentially lucrative trading maneuvers.
Here are the average trading ranges that have been over the past year on a daily, weekly, and monthly basis for $DHI.
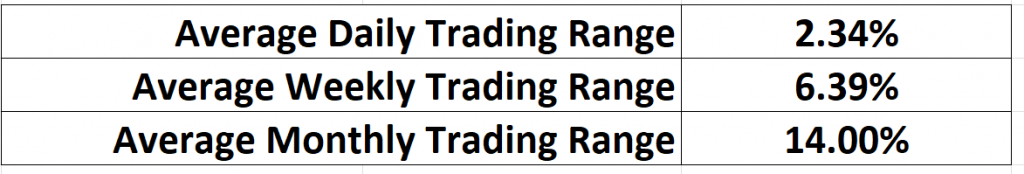
There is plenty of meat on the bone based upon short term volatility for short term traders to capture gains based upon these metrics.
Harnessing A.I., machine learning, and neural networks transforms raw data into actionable strategies for traders. These tools aren’t just modern jargon; they’re essential for navigating tumultuous financial markets with precision. They strip away the uncertainty from your trading decisions, providing clear insights and accurate trading ranges. Study the recent VantagePoint A.I. Daily Range Forecast for $DHI over the last three weeks — a crucial advantage for those looking to sharpen their trading edge.
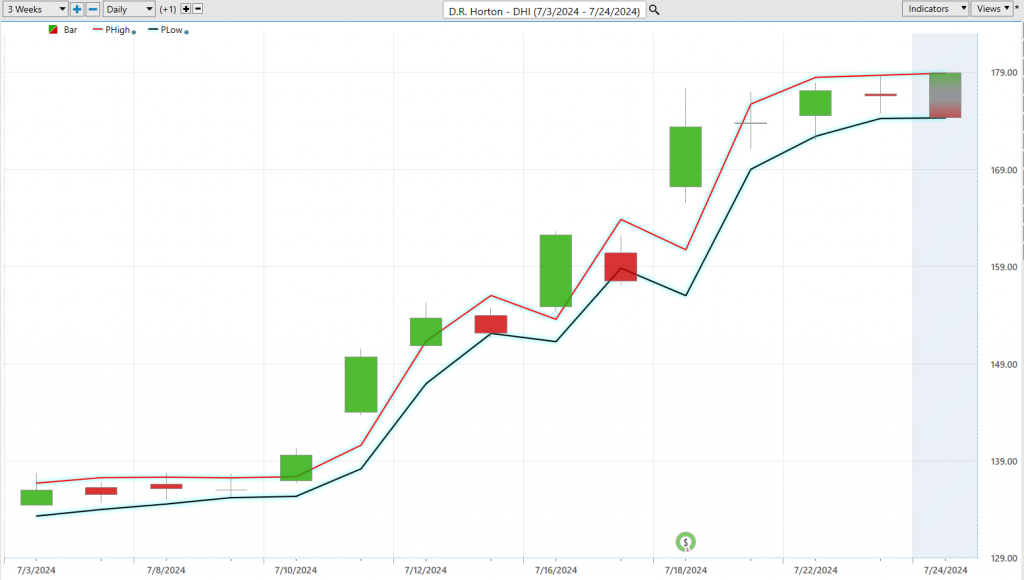
We advise VantagePoint A.I Power Traders to utilize the Daily Range forecast and to cross reference it with the Neural Index and predictive blue line to fine tune short term entries and exits.
VantagePoint A.I. Intermarket Analysis
Imagine you have a puzzle, and each piece is a different market, like a store where people buy and sell things. Intermarket analysis is like looking at all these puzzle pieces together to see how one piece affects the other. If one store starts selling lots of toys, it might mean another store will sell more batteries because toys need batteries to work. This helps people decide where to put their money, like choosing which store might sell more toys next.
Intermarket analysis is a method used in finance to examine the relationships between different sectors of financial markets, such as stocks, bonds, commodities, and currencies. By understanding how these different markets affect each other, traders can make better decisions. For example, if the price of oil rises, it might lead to higher costs for companies and affect their stock prices or influence the economy of countries that export oil.
John Murphy and Lou Mendelsohn are important figures in this field. John Murphy helped develop the idea that these markets are connected and that insights can be gained by looking at their relationships. Lou Mendelsohn, the founder of VantagePoint Software advanced this by using computers and software to analyze these market relationships more deeply and automatically, helping traders make decisions based on complex data more quickly and accurately. This kind of analysis is crucial because it helps traders anticipate market moves rather than just react to them, potentially leading to more successful trading strategies.
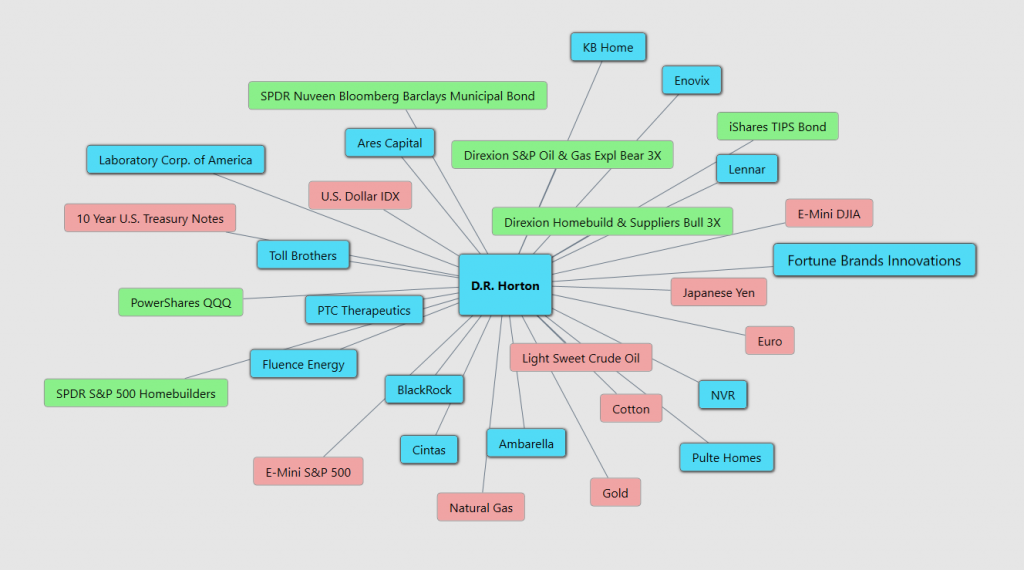
As you study the graphic below recognize that these are the 31 top drivers of $DHI:
Our Suggestion
Over the past three weeks, D.R. Horton has reported strong financial performance, surpassing quarterly earnings expectations with a significant increase in EPS and revenues. This led to their stock reaching new 52-week highs. Despite broader market challenges, the company has continued to see growth and deliver shareholder returns. However, there has been some concern over new sales orders, which did not meet expectations, reflecting potential challenges in the housing market due to elevated mortgage rates and inflation. Additionally, D.R. Horton declared a quarterly dividend, underlining their financial health and commitment to shareholder value.
In the most recent Q2 2024 earnings call, D.R. Horton demonstrated strong financial performance, with a significant increase in earnings per share and revenues, highlighting robust growth despite prevailing market challenges. Wall Street Analysts were expecting earnings per share at $3.80. $DHI crushed that estimate with actual EPS at $4.10.
The company discussed critical risks including elevated inflation and mortgage interest rates which could impact buyer affordability and sales volume. However, D.R. Horton is capitalizing on opportunities by maintaining a large inventory and efficient construction cycles to meet ongoing housing demand and gain market share. The tone of the call was optimistic, underscored by successful operational strategies and a strong market positioning, which are expected to drive continued growth and profitability in the face of external economic pressures. The outlook remained positive, focusing on strategic market consolidation and capital efficiency to navigate future uncertainties.
The company’s commitment to leveraging technology for better construction practices and customer interactions underscores its role as a leader in the homebuilding sector, poised for future success. They should be a huge beneficiary of lower interest rates so make sure you have them on your trading radar to watch closely moving forward.
The next earnings date for D.R. Horton ($DHI) is estimated to be on Tuesday, November 5th, 2024.
Practice good money management on all your trades.
Our advice is that you should follow the ai daily range forecast for daily trading guidance on $DHI. The entire homebuilding sector is remarkably strong and continues to present solid short-term trading opportunities.
Let’s Be Careful Out There!
It’s Not Magic.
It’s Machine Learning.
Disclaimer: THERE IS A HIGH DEGREE OF RISK INVOLVED IN TRADING. IT IS NOT PRUDENT OR ADVISABLE TO MAKE TRADING DECISIONS THAT ARE BEYOND YOUR FINANCIAL MEANS OR INVOLVE TRADING CAPITAL THAT YOU ARE NOT WILLING AND CAPABLE OF LOSING.
VANTAGEPOINT’S MARKETING CAMPAIGNS, OF ANY KIND, DO NOT CONSTITUTE TRADING ADVICE OR AN ENDORSEMENT OR RECOMMENDATION BY VANTAGEPOINT AI OR ANY ASSOCIATED AFFILIATES OF ANY TRADING METHODS, PROGRAMS, SYSTEMS OR ROUTINES. VANTAGEPOINT’S PERSONNEL ARE NOT LICENSED BROKERS OR ADVISORS AND DO NOT OFFER TRADING ADVICE.


