


This week’s ai stock spotlight is DraftKings ($DKNG)
DraftKings Inc. has emerged as a formidable player in the realm of digital sports entertainment and gaming, largely driven by its innovative approaches in online sports betting, daily fantasy sports (DFS), and iGaming. Since its inception in 2012 by founders Jason Robins, Matt Kalish, and Paul Liberman, the company has transformed from a fantasy sports platform to a broad-spectrum betting and gaming enterprise. With its headquarters firmly planted in Boston, Massachusetts, DraftKings not only serves the U.S. market but has also made significant inroads on the international stage.
The revenue model of DraftKings is multifaceted, primarily drawing income from sports betting — which stands as its largest revenue generator — alongside DFS and iGaming. The company has adeptly harnessed the growing legalization of sports betting across various states to enhance and diversify its revenue streams. This expansion is complemented by advertising revenues secured through strategic partnerships with sports leagues and media entities. Among its financial channels, sports betting and iGaming are predominant, with DFS continuing to contribute substantially to its profit portfolio.
DraftKings employs approximately 4,200 individuals, with its organizational structure tailored to emphasize technological innovation, marketing, and regulatory compliance — essential components that navigate the intricacies of the legal sports betting and gaming landscape. Despite its rapid growth, DraftKings has faced challenges in achieving consistent profitability, reflecting the high costs associated with customer acquisition and market expansion typical of many growth-focused companies in blossoming industries. Nevertheless, recent financial disclosures reveal signs of potential profitability on the horizon, with improvements in debt levels stemming from growth initiatives and acquisitions.
Listen up, because here’s the scoop on DraftKings ($DKNG) — the big player in the sports betting and gaming arena. Despite their aggressive growth and savvy moves snapping up key players in the market, these guys haven’t hit the jackpot just yet. Why? They’re not profitable. That’s right. They’re raking in more cash, expanding like crazy, and making smart deals, but when you peek under the hood at the numbers, they’re still playing catch-up.
Think of DraftKings like a high-roller throwing big money around in a poker game. They’re buying pots left and right, hoping their investments in technology and new markets will start paying off big time. But as of now, the earnings table tells it all — they’re boosting revenue, sure, but their bottom line? Still in the red. They’re betting big on their future, but remember, in the game of high stakes, it’s all about keeping enough chips to stay in the game until you can clean up when the cards finally fall your way.
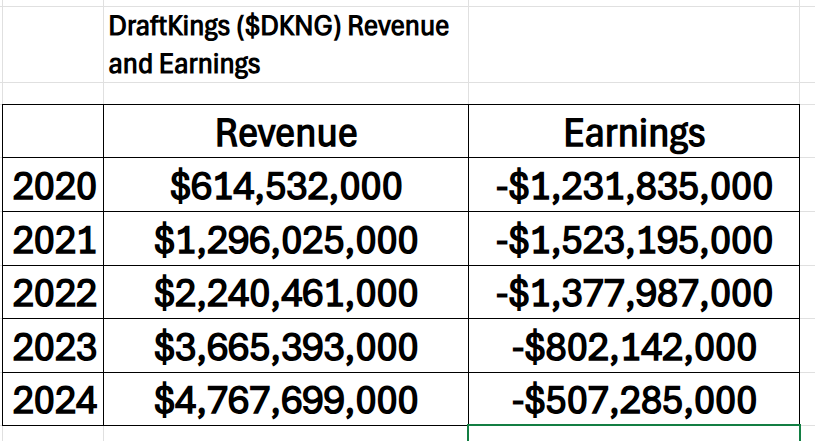
The company’s recent activities underscore its dynamic market presence and strategic agility. DraftKings has recently showcased significant strides in its fiscal performance, as evident from its latest earnings calls. In 2024, the company reported a remarkable 30% increase in revenue, totaling $4.8 billion. The momentum continued into the fourth quarter with revenue reaching $1.393 billion, a 13% uptick from the prior year. This financial growth is largely attributed to robust customer engagement and strategic customer acquisitions, which have expanded the total customer base by 42% year-over-year to 10.1 million.
On the strategic front, DraftKings is vigorously expanding its sports betting and iGaming operations across new U.S. states. The acquisition of platforms like Jackpocket underscores its commitment to diversifying and enhancing its service offerings, tapping into the burgeoning market spurred by the ongoing legalization of online gaming and sports betting nationwide.
Yet, the road ahead is not devoid of challenges. Despite its financial upturn, DraftKings grapples with high customer acquisition costs and navigates a complex regulatory environment that varies significantly across states. Additionally, fluctuations in the sportsbook hold percentage and the outcomes of major sporting events continue to pose substantial revenue risks.
Internally, DraftKings is doubling down on improving its live betting capabilities and integrating advanced technologies to elevate the user experience. The firm is leveraging its strengthened capital structure and financial discipline to fuel growth and maximize shareholder value.
As DraftKings positions itself for future expansion, it balances strategic internal initiatives with external market opportunities. However, investors and stakeholders are advised to remain cautious of the inherent risks tied to the competitive and regulatory dynamics of the online betting and gaming sectors.
Competitively, DraftKings holds a vanguard position in several markets, particularly in sports betting, where it competes with major players like FanDuel, BetMGM, and PointsBet. Its market strategy is bolstered by a series of strategic acquisitions, such as the purchase of SBTech, which enhanced its sports betting technology stack; Golden Nugget Online Gaming, which augmented its capabilities in iGaming; and Jackpocket, which expanded its footprint into the lottery domain.
In conclusion, DraftKings stands at a critical juncture where the trajectories of technological advancement, regulatory environments, and market strategies converge. Its continued focus on technological enhancements, customer engagement, and strategic acquisitions positions it well to capitalize on the expanding landscape of online sports betting and gaming. As it navigates through the complexities of profitability and regulatory frameworks, DraftKings remains a key player to watch in the evolving narrative of digital sports betting.
In this stock study, we will look at an analysis of the following indicators and metrics which are our guidelines.
- · Wall Street Analysts Forecasts
- · 52 Week High and Low Boundaries
- · Best-Case/Worst-Case Analysis
- · Vantagepoint A.I. Predictive Blue Line Indicator
- · Neural Network Forecast (Machine Learning)
- · VantagePoint A.I. Daily Range Forecast
- · Intermarket Analysis
- · Our Suggestion
While we make all our decisions based upon the artificial intelligence forecasts, we do look at the fundamentals briefly, just to understand the financial landscape that $DKNG is operating in. This overview provides insights into $DKNG’s status and future outlook.
Wall Street Analysts Forecasts
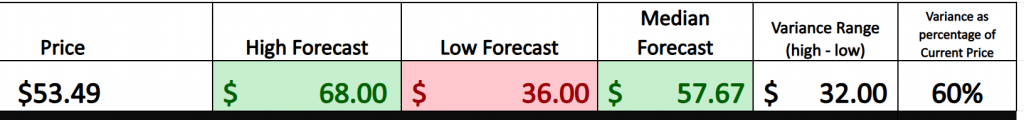
In the last quarter, 30 Wall Street analysts have scrutinized DraftKings, offering a gamut of price targets for the forthcoming 12 months. The consensus pegs the average target price at $57.67, suggesting a modest uplift of 7.81% from its current trading price of $53.49. The spectrum of targets stretches from an optimistic high of $68.00 to a more cautious low of $36.00. This spread not only underscores the varied sentiments around the company’s future performance amid its rapid expansion and strategic maneuvers but also highlights the inherent uncertainties and opportunities that lie ahead for DraftKings in a highly competitive and regulated market. As investors digest these projections, the overarching narrative remains one of cautious optimism, with a keen eye on how the company’s ongoing strategies will translate into financial metrics and market position.
We’ve got analysts tossing out numbers like dice on a craps table, ranging from a high roll of $68 to a cautious low of $36. This big spread tells us that while some are betting big on DKNG’s strategy to shoot the moon, others are hedging their bets, worried about regulatory snags and a jam-packed market.
Now, here’s the kicker: the average price target these market watchers have settled on is $57.67. That’s a bit more than a stone’s throw from today’s price of $53.49, hinting at some upside potential if DraftKings keeps playing its cards right with innovations and expanding its playground globally.
But hold your horses — this isn’t just about optimism. That whopping $32 spread between the high and low estimates? It screams volatility. In plain English, that means DKNG’s stock could swing wildly — up to 60% in either direction from its current price — within the next year. So, if you’re in the game, keep your eyes peeled on these numbers. It’s like watching the roulette wheel spin — exciting, unpredictable, and full of possibilities.
52 Week High and Low Boundaries
The 52-week range of a stock isn’t just a set of numbers — it’s the lifeblood of how traders gauge the stock. Think of this range as the ultimate stress test, revealing the highs and lows of a stock’s journey over a year. It’s like looking into the soul of the market, seeing what scares it and what makes it dance.
Now, when you see a stock flirting with its 52-week high, that’s not just good news — it’s a siren call to investors. It screams top-notch performance and the kind of trust in a stock that makes wallets open easier. This is where the magic happens, where optimism fuels the market’s fire, possibly driving the price to dizzying new heights.
On the darker side, a stock dragging its feet near its 52-week low tells a whole different tale. Here lies the battlefield of lost confidence and potential financial woes — a warning sign that could scare off the faint of heart and trigger a ruthless sell-off, pushing prices into the abyss.
But here’s the kicker: understanding where a stock sits in this range is more than just number crunching. It’s psychological warfare, a game of chess that shapes market sentiment and maneuvers investor actions. Breaching a 52-week high can set off a frenzy, attracting more eyes and more money, potentially catapulting it even higher. Meanwhile, hitting new lows might send investors running for the hills, accelerating a stock’s fall.
Navigating this range isn’t just smart; it’s essential. It’s the compass that savvy investors use to steer through the stormy seas of the stock market, predicting trends and aligning their strategies to either catch the next big wave or brace for impact. This isn’t just trading — it’s an art form, where every high and low paints the picture of a stock’s true face in the market theater.
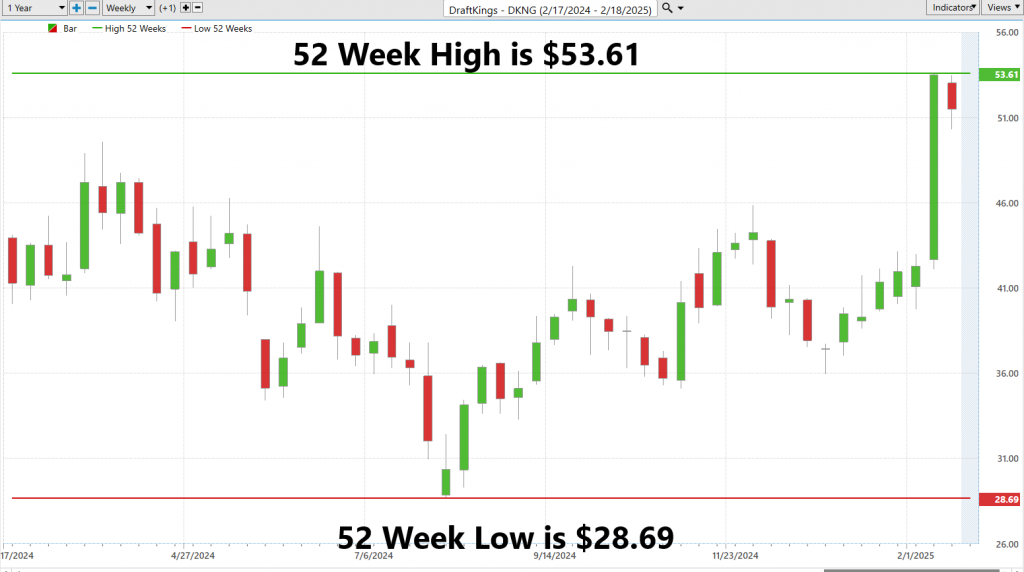
We always advise traders to look at the 52-week chart to understand the trajectory of the stock over the past year.
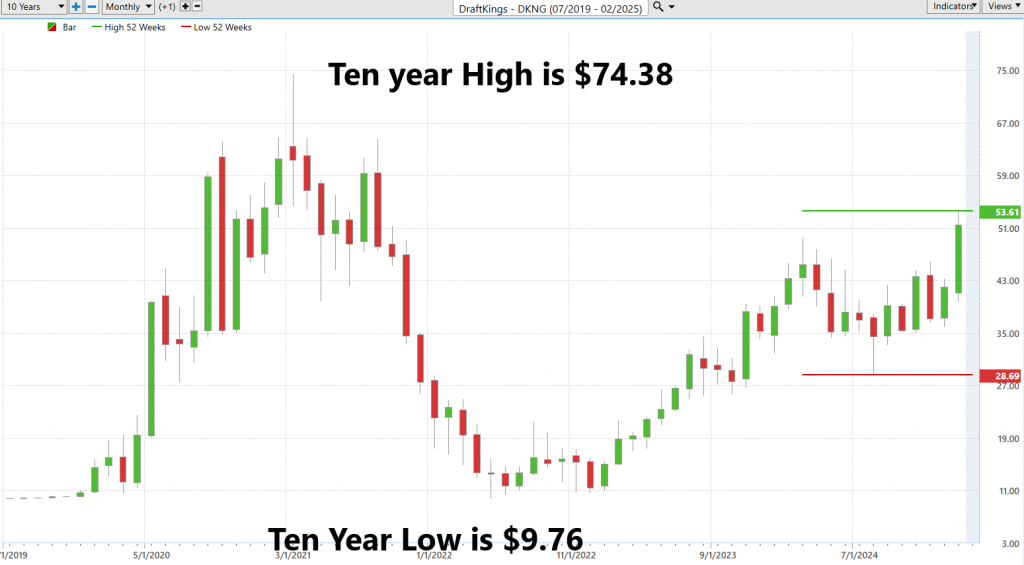
For the astute trader and investor, there’s a profound necessity to not only track the peaks and troughs of a stock over the course of a year but also to adopt a wider angle — stretching the timeline out to a decade with a 10-year monthly chart. This isn’t just about watching numbers ebb and flow; it’s about weaving these numbers into a broader narrative, revealing deeper undercurrents that shape a stock’s journey through the tumult of the market.
I strongly encourage you to step back and integrate this expansive perspective. Analyzing such a ten-year timeline for $DKNG can unearth pivotal trends and patterns that shorter frames might miss. This isn’t merely a tactic but a strategic tool, offering you a clearer vantage point from which to gauge DraftKings’ market behavior across years, not just days or months. Such insights are invaluable, providing stability and strategic foresight in navigating the financial markets. By understanding these long-term movements, you can better position yourself to make informed, judicious investment decisions that go beyond mere speculation.
Best-Case/Worst-Case Analysis
Before you dive headfirst into trading, especially with something as volatile as DraftKings ($DKNG), you absolutely must get a grip on the roller coaster ride you’re about to board. This isn’t just savvy — it’s survival. Understanding the highs and lows, the twists and turns of this beast, could be what stands between you and a wipeout.
The best case/worst case scenario analysis isn’t just some fancy financial advisor talk; it’s your bread and butter in the trading game. Take a gander at $DKNG’s historical highs and lows, map them out. This isn’t just number crunching; it’s about painting a clear picture of what kind of wild ride you might be in for. What we’re talking about here are two simple charts that could become your new best friends—one showing when $DKNG had its glory moments (its biggest rallies), and the other showing its faceplants (its steepest declines).
But this isn’t just about seeing where the stock has been. It’s strategic. These charts help you understand the magnitude of uninterrupted rallies and declines andset smart stop-loss levels and profit targets, arming you so you’re not just throwing darts blindfolded. They transform raw data into a strategic map, guiding you on when to hold tight and when to bail, making sure your trading strategy is sharp, informed, and, most importantly, based on solid ground.
So, before you jump into the fray, take a moment. Study those charts. Understand the dance of numbers and make sure your moves in the market are backed by more than just a gut feeling. This way, you’re not just surviving; you’re strategizing to win.
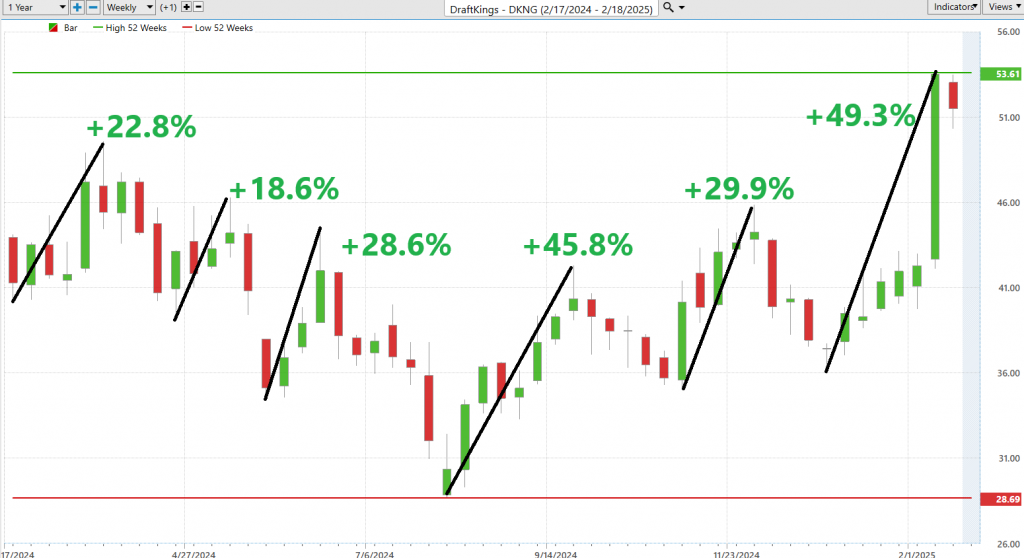
First let’s look at the best-case scenario:
Followed by the worst-case scenario:
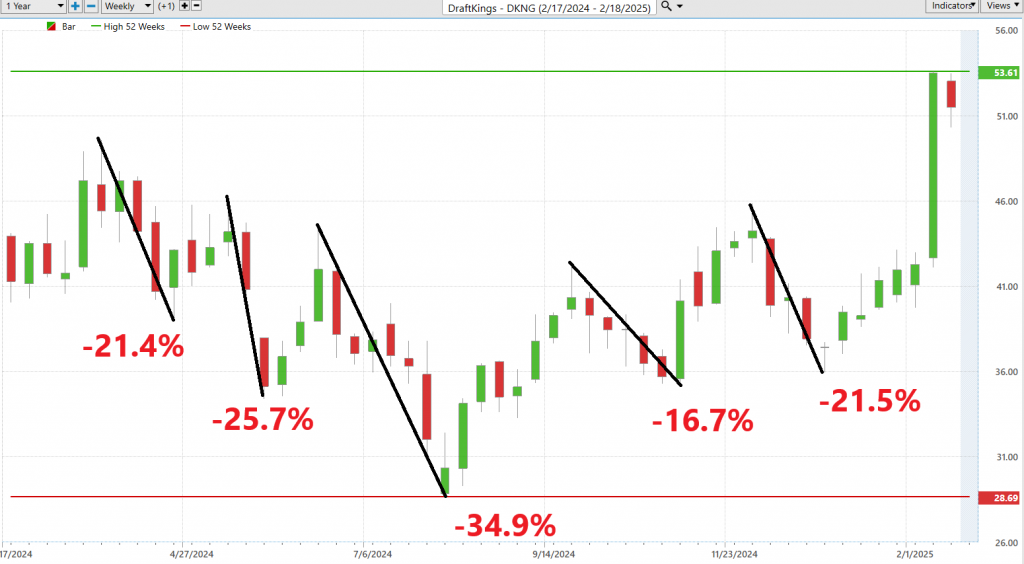
This type of analysis strips away the noise and gives you the raw truth of potential gains versus risks in a way that’s as clear as a desert sky. By comparing the heights and the depths that $DKNG has reached, you’ll get a snapshot — not just of where it’s been — but where it could be heading. This is the kind of tool that separates the sharp traders from the Sunday drivers by comparing risk and reward.
And here’s the kicker: understanding this balance between risk and reward, based on historical performance, isn’t just smart — it’s essential. If history repeats itself, knowing which end of the scale has been tipping more might just be your best guide to what’s coming down the pike. This is how you play to win, not just to play. Remember, in the fast-spinning world of stock trading, being equipped with this straightforward, yet potent analysis could mean the difference between sprinting ahead or just spinning your wheels.
In our next analysis, we scrutinize how DraftKings Inc. ($DKNG) stacks up against the broader stock market indices. This examination is crucial as it helps us understand the company’s performance over various time frames, giving us a clearer picture of its historical behavior and trends in relation to the general market. By doing so, we aim to gauge DraftKings’ volatility and stability compared to the larger market landscape, offering a perspective on whether $DKNG has swung dramatically than its market counterparts. This kind of comparative analysis is vital for traders who need to understand not just the standalone merits of DraftKings, but how it moves in the symphony — or occasionally, the cacophony — of the broader market dynamics.
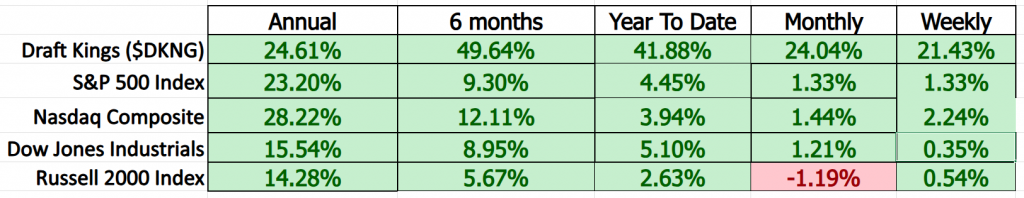
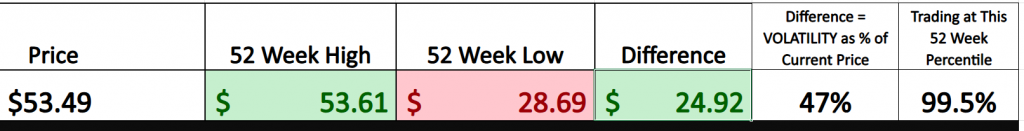
It is fair to say that $DKNG has outperformed, and the majority of that performance has come in the last 6 months.
DraftKings Inc. ($ DKNG) has a beta of approximately 1.92.
In simple terms, beta measures how much a company’s stock price moves compared to the overall market. The market itself has a beta of 1.0. If a stock has a beta higher than 1.0, it means the stock is more volatile than the market; it tends to move up and down more dramatically. Conversely, a beta less than 1.0 indicates the stock is less volatile.
So, with a beta of 1.92, DraftKings’ stock is significantly more volatile than the market. This means if the market’s value changes, DraftKings’ stock is likely to change by about 1.92 times that amount. For example, if the market goes up by 10%, DraftKings’ stock might go up by approximately 19.2%. However, if the market drops by 10%, DraftKings’ stock could decrease by about 19.2%.
Understanding beta helps investors assess the risk associated with a particular stock. A higher beta indicates higher risk but also the potential for higher returns, while a lower beta suggests lower risk and potentially more stable returns.
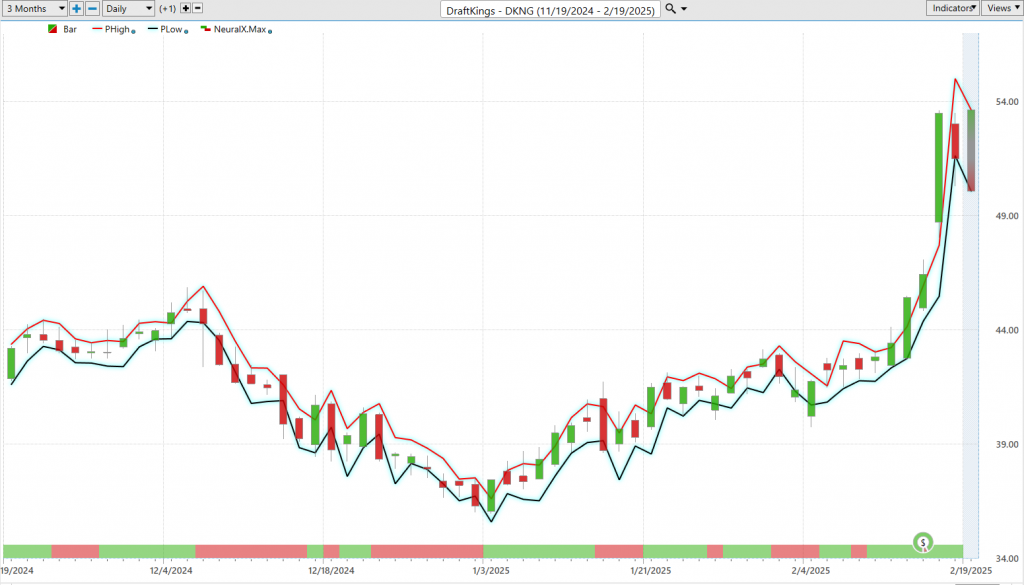
Vantagepoint A.I. Predictive Blue Line
Step into the trading arena armed with VantagePoint Software’s A.I.-driven forecasts, and you might just feel like you’ve acquired a secret weapon that sets you apart from the competition. Imagine having a high-tech trading ninja by your side. The software’s predictive blue line isn’t just any tool; it’s like your personal trading coach, discreetly guiding your every move on when to buy and sell DraftKIngs ($DKNG).
Think of this predictive blue line as more than a visual on a chart; consider it your navigator through the often-perilous journey of stock trading. Here’s how to harness its insights:
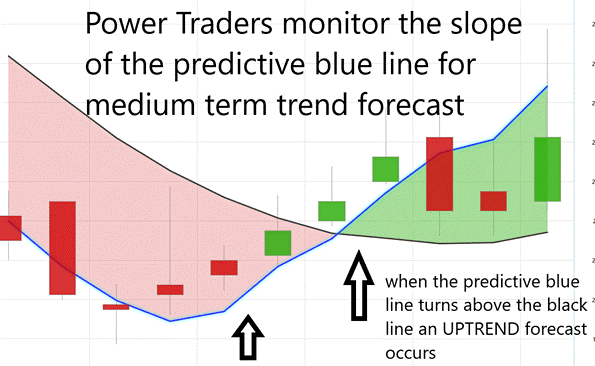
Reading the Slope: Picture the line as the market’s mood ring. An upward slope signals that the stock’s price is forecasted to climb — prepare to spot buying opportunities. Conversely, a downward tilt warns of potential drops — get ready to consider selling.
Finding the Value Zone: This is where the true strategy comes into play. When $DKNG’s stock price approaches or dips below this predictive blue line during an upward trend, it’s practically shouting at you to buy. If the stock price surges above this line during a downturn, it’s time to reassess your position.
Heeding the Downward Warnings: Think of a downward trend in the blue line as an ominous sky before a storm — an indicator suggesting it might be wise to secure your investments, either by cutting losses or hedging.
Utilizing this A.I. tool elevates your trading decisions from mere guesswork to calculated strategy. It simplifies complex market data into a clear trajectory, empowering you to navigate market volatility with the finesse of a veteran trader. This approach isn’t merely about executing trades; it’s about making informed, savvy decisions that propel you to the forefront.
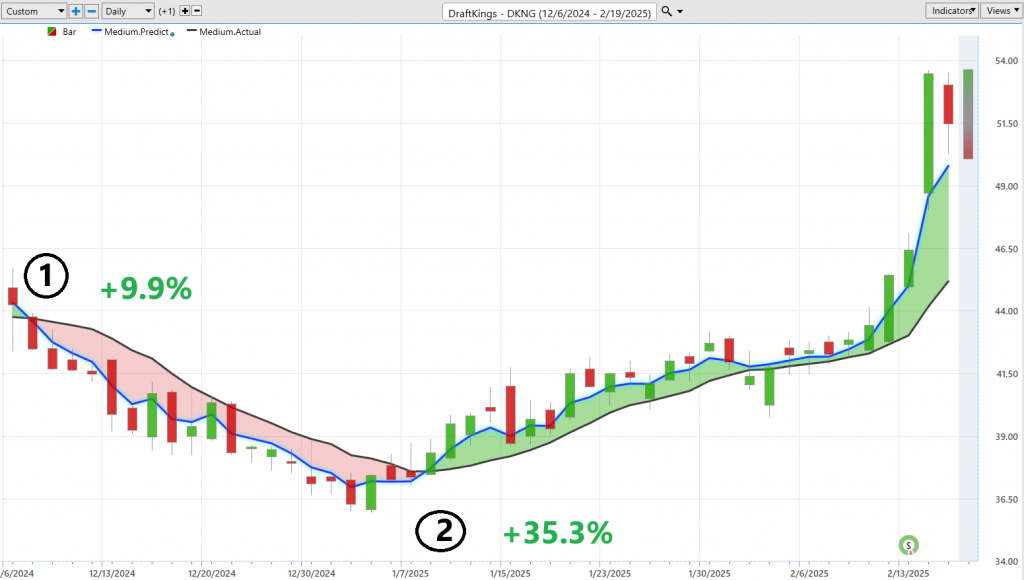
Consider this: over the past three months, two A.I. trend forecasts from VantagePoint have been spot-on, each one turning out a winner. The 1st was a 9.9% gain on the short side of the market. The second was a 35.3% gain when the Up forecast was generated on January 10th.
This is the commanding power of VantagePoint’s A.I. forecasts, a game-changing asset for any trader aiming to dominate the markets.
Neural Network Forecast (Machine Learning)
Think of a neural network as a gang of brainy algorithms mimicking the human brain, designed to recognize patterns. They learn and make decisions by sifting through layers of information, getting smarter with each pass and capable of tackling complex problems like a seasoned detective cracking a tough case.
Imagine this: A trading partner, not just powered by silicon but by blistering neural pathways. This isn’t your typical sidekick; this is a brainchild of the brightest minds, optimized for the trading pit. It chews through colossal data sets, unearths the hidden patterns, and catches the market’s whispers that even the most hawk-eyed traders might overlook.
This isn’t just smart; this A.I. learns like a seasoned Wall Street wolf. It refines its game with every trade, whether it’s a triumph or a lesson. What does that translate to for you? Laser-focused insights that slice through market noise, and a clairvoyant risk-reward vision.
This neural beast doesn’t just pore over the details; it climbs to the peak, gaining a bird’s-eye view of global shifts, sector swings, and economic tremors. It doesn’t just give you data; it hands you golden opportunities.
So, strap this turbocharged, brainy behemoth onto your trading arsenal, and propel your strategy not just into the next level, but into the stratosphere of success.
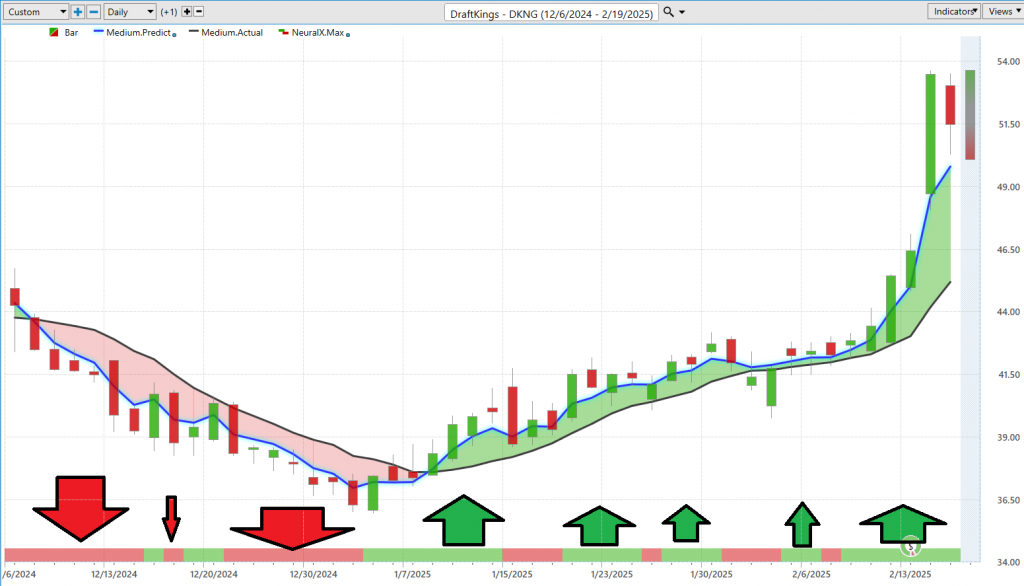
Look at the chart below: Those arrows? They’re not just marks; they’re bullseyes where our Neural Network’s forecast danced in sync with the predictive blue line. These are your high-probability trades.
Don’t just trade; dominate with the neural network by your side.
Neural networks are transforming the trading landscape by harnessing immense volumes of data with exceptional speed, accuracy, and flexibility. These sophisticated technologies are minimizing the impact of human error and delivering sharp, real-time insights into market dynamics. Consequently, traders are now consistently in sync with the market’s heartbeat, empowering them to execute more informed and timely decisions.
VantagePoint A.I. Daily Range Forecast
In the world of trading, timing isn’t just a factor — it’s the heartbeat of making serious money. That’s where the VantagePoint A.I. Daily Range Forecast for $DKNG morphs from a handy gadget into a powerhouse. This cutting-edge tech fine-tunes your decision-making chops, zeroing in on the perfect moments to jump in or bail out of trades.
With the market’s relentless ups and downs, mere numbers just don’t cut it anymore. You need a conversion of raw data into genuine strategic gold. Enter the beast mode of artificial intelligence, machine learning, and neural networks—far beyond mere buzzwords, these are the heavy artillery that slice through noise and confusion to hand you crystal-clear, actionable forecasts.
Let’s kick off by dissecting the average trading ranges for $DKNG, spanning daily, weekly, and monthly intervals over the last year. Get ready to see how the smart money plays the game.
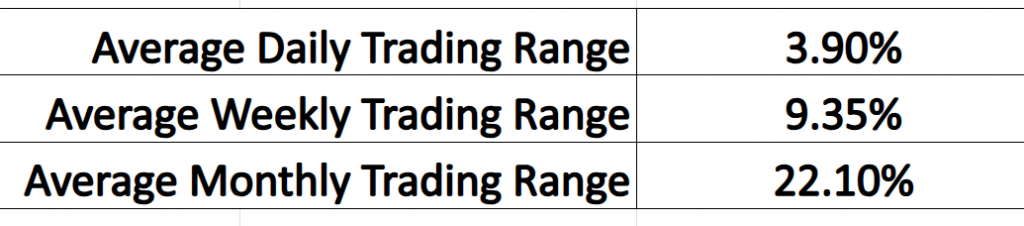
These metrics represent far more than mere numbers; they are the distilled essence of strategic insights, sharpened by the cutting edge of A.I. technology. They serve as a navigator, guiding traders with laser-like precision through the complex maze of market volatility. Understanding this volatility is crucial, but the true artistry in trading lies in the impeccable timing of market entry and exit — this is the secret sauce of trading success. The VantagePoint A.I. Daily Range Forecast elevates itself above standard charting techniques, proving indispensable for short-term swing traders. It offers the kind of meticulous precision essential for navigating the daily ebbs and flows of the market, ensuring traders are positioned to capitalize on every opportunity.
Study the VantagePoint A.I. Daily Range forecast and you will see how clearly the trend and daily forecast is clearly delineated.
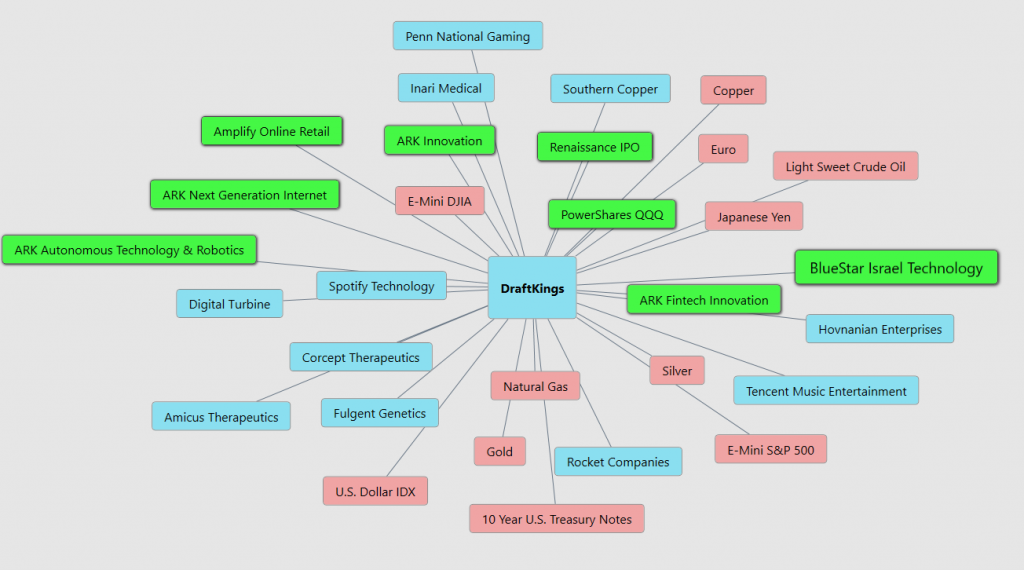
Intermarket Analysis
DraftKings Inc. ($DKNG) stock is like a high-strung racehorse, galloping along to the rhythm of the broader market, especially the tech and consumer discretionary sectors where it plays its game. Now, think about the big picture stuff — how fat are folks’ wallets? How loose are the government’s reins on online betting? These are the big macroeconomic factors that can make or break DKNG’s stock price.
Here’s where it gets juicy. DraftKings’ bread and butter come from hauling in users, keeping them happy, and betting on more states giving sports gambling the thumbs up. This isn’t just business; it’s the fuel that fires up investor vibes and gets that stock price dancing. But wait, there’s more! Toss in interest rate hikes, and you’ve got less dough for folks to blow on a Saturday night bet, tightening the screws on how much they gamble.
Don’t forget, DKNG is throwing elbows in a crowded ring, duking it out with other betting big dogs. Every deal it clinches with sports leagues or media heavyweights can send the stock soaring or sinking. And, of course, the tech sector’s mood swings, tracked by giants like NASDAQ, can drag DraftKings’ stock along for a wild ride. So, strap in, and watch these levers because in the high-stakes game of stock trading, knowing these moves is what separates the sharpies from the suckers.
Here are the 31 key drivers of $DKNG’s price action. Study the graphic and it will also help you find diamonds that you would have never discovered from traditional charting analysis.
Our Suggestion
DraftKings Inc. ($DKNG) just dropped a bombshell of an earnings call on February 13th that’s got everyone from Wall Street to Main Street buzzing. Here’s the scoop: they’ve punched the gas on their revenue, clocking in a hefty 13% jump from last year, with a grand total of $1.393 billion for Q4 alone. This isn’t just chump change; it’s the result of a killer customer acquisition frenzy that’s added a cool 3.5 million new bettors to their ranks at costs so low they’re practically stealing. Total customer base? It’s ballooned to 10.1 million, a staggering 42% spike year-over-year.
And get this: Super Bowl Sunday wasn’t just a win for the Eagles. No, sir. DraftKings smashed its own records with a whopping $436 million in bets, marking it the biggest revenue day in their history. They’re not just playing the game; they’re rewriting the rulebook.
Now, riding high on these wins, they’ve cranked their 2025 revenue targets up to between $6.3 and $6.6 billion. That’s not just optimistic; that’s strapping a rocket to their back and lighting the fuse.
But hey, let’s not gloss over the elephant in the room. Yes, the streets are paved with gold, but there are potholes, too. Those promotional dollars? They’re still burning a hole in their pocket, not quite where they want them yet. And let’s not forget the tax man cometh, especially in places like Illinois where they’re hiking rates, which could put a damper on the party.
Wall Street’s got their eyes wide open on this one, with analysts throwing around “Buy” ratings like confetti at a parade, even boosting price targets to $60, betting big on DKNG’s next moves. But, as always, caution is the name of the game, with some wary of the regulatory hurdles and stiff competition that could throw a wrench in the works.
Opportunities? They’re as ripe as low-hanging fruit. Expansion is on the horizon with states lining up to legalize sports betting, and DKNG is all over it. Innovations? They’re pouring it on thick, enhancing their platform to keep bettors hooked and coming back for more. And with the knack for roping in users without breaking the bank? That’s just icing on the cake.
But here’s the bottom line: DraftKings is a juggernaut barreling down the fast lane, but they’ve got to keep their hands steady on the wheel, especially with the market’s wild swings and those regulatory speed bumps. If they play their cards right, keep the momentum, and steer clear of any major pitfalls, they’re on track to not just hit, but shatter those big, bold targets. So, for those watching from the sidelines, strap in — it’s going to be one heck of a ride.
The next earnings call is projected to occur around April 30, 2025 and analysts are hoping to see signs of profitability due to their aggressive revenue growth.
Put Draft Kings ($DKNG) on your trading radar. It will create numerous trading opportunities in the coming year.
Our suggestion is to utilize the VantagePoint A.I. Daily Range forecast for short-term trading opportunities. Practice great money management on all of your trades.
Let’s Be Careful Out There.
It’s Not Magic.
It’s Machine Learning.
Disclaimer: THERE IS A HIGH DEGREE OF RISK INVOLVED IN TRADING. IT IS NOT PRUDENT OR ADVISABLE TO MAKE TRADING DECISIONS THAT ARE BEYOND YOUR FINANCIAL MEANS OR INVOLVE TRADING CAPITAL THAT YOU ARE NOT WILLING AND CAPABLE OF LOSING.
VANTAGEPOINT’S MARKETING CAMPAIGNS, OF ANY KIND, DO NOT CONSTITUTE TRADING ADVICE OR AN ENDORSEMENT OR RECOMMENDATION BY VANTAGEPOINT AI OR ANY ASSOCIATED AFFILIATES OF ANY TRADING METHODS, PROGRAMS, SYSTEMS OR ROUTINES. VANTAGEPOINT’S PERSONNEL ARE NOT LICENSED BROKERS OR ADVISORS AND DO NOT OFFER TRADING ADVICE.


