


| This Week’s a.i. Stock Spotlight is Fiserv ($FI) |
Today, we delve into the financial fortress that is Fiserv, Inc. ($FI), a stalwart in the bustling field of financial services technology.
$FI is a prominent global provider of payments and financial services technology solutions. Fiserv offers a wide range of financial services, including transaction processing, digital banking solutions, and card issuer services. The company focuses on facilitating electronic payments and automating processes for financial institutions and businesses worldwide.
Founded in 1984 and rooted firmly in Wisconsin, Fiserv has expanded its reach far beyond its humble beginnings Today, Fiserv stands tall with a market capitalization of approximately $102.7 billion, showcasing its substantial impact on the industry.
Fiserv generates revenue primarily through processing services and technology platforms that support various financial transactions and services. The company has consistently shown robust financial performance and is recognized in the industry for its contributions to Financial Technology. Additionally, Fiserv has expanded its capabilities and customer base through strategic acquisitions and partnerships, which have further solidified its position in the financial services technology sector.
Fiserv, Inc. ($FI) has experienced several notable developments and opportunities in the last 30 days, reflecting both its ongoing growth and potential challenges. Recently, Fiserv’s stock reached an all-time high of $203.00, underscoring a strong period of growth with the stock value increasing significantly over the past year. This surge in stock price
reflects investor confidence in Fiserv’s strategic initiatives and robust market position within the financial services technology sector.
However, Fiserv is also anticipating a non-cash impairment charge of between $400 million and $600 million related to the upcoming expiration of its joint venture with Wells Fargo. This charge is significant, but the company has indicated it will not impact its 2024 adjusted earnings per share. Furthermore, Fiserv has secured a multiyear agreement to continue providing processing services for Wells Fargo’s current and future merchant customers, ensuring the continuation of their relationship beyond the joint venture’s expiration .
Fiserv is seizing the bull by the horns with its aggressive management tactics and a dominant presence in the payment processing industry. The strategic acquisition of First Data back in 2019 catapulted Fiserv past its competitors, fueling stable revenue growth and robust free cash flows. The company isn’t just resting on its laurels; it’s pushing into Latin American markets, expanding its reach and enhancing the potential for long-term growth. With earnings expected to surge by 13.85% annually and a whopping 37.5% growth over the past year alone, Fiserv is on a clear upward trajectory. The cherry on top? The small business segment is driving this revenue growth, poised to be a game-changer for Fiserv’s future. This company is a beacon for savvy investors looking for dynamic growth in a solid firm.
In terms of strategic moves, Fiserv has expanded its partnership with PayPal to enhance the checkout processes for U.S. merchants. This collaboration aims to streamline the integration of PayPal and Venmo services, facilitating easier transactions for Fiserv’s client base.
Financially, Fiserv reported a 7% year-over-year increase in second-quarter 2024 revenue, reaching a record $5.11 billion, and a 31% increase in earnings for the same period. The firm also successfully completed a public offering and issuance of senior notes totaling $1.75 billion. These financial maneuvers have been well received by analysts from prominent financial institutions.
Here is a revenue and earnings table for $FI going back to 2019.
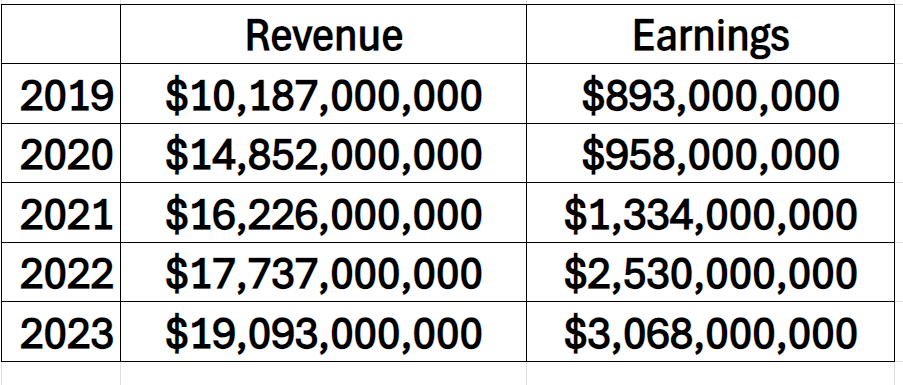
What is notable is that revenue has grown 87% over the last 5 years. But what has Wall Street buzzing with enthusiasm is that earnings have grown by 244% over the same time frame. When earnings grow almost 3 times faster than revenue it is impressive and spells huge growth and value.
Overall, Fiserv appears well-positioned in the fintech landscape with strong financial performance and strategic partnerships that bolster its market standing.
Investors should note the company’s prudent financial management, evidenced by a debt-to-equity ratio of 0.89, signaling a balanced approach to growth and financial stability.
Fiserv’s competitive edge is sharpened by its comprehensive suite of services that covers everything from electronic funds transfer to innovative payment solutions. Despite fierce competition from the likes of PayPal and Square, Fiserv’s diverse offerings and strategic market positioning ensure it remains a step ahead.
Recent months have seen Fiserv not resting on its laurels but rather forging significant partnerships. Notably, its collaboration with PayPal to enhance U.S. merchant checkout processes stands out as a testament to its strategic foresight. Furthermore, being ranked No. 1 in the IDC FinTech Rankings underscores its industry dominance.
What Wall Street Analysts are most concerned about is susceptibility to economic downturns due to reliance on the financial sector along with rapid technological changes and intense sector competition.
In this weekly stock study, we will look at an analysis of the following indicators and metrics which are our guidelines which dictate our behavior in deciding whether to buy, sell or stand aside on a particular stock.
· Wall Street Analysts Ratings and Forecasts
· 52 Week High and Low Boundaries
· Best-Case/Worst-Case Analysis
· Vantagepoint A.I. Triple Cross Indicator
· Neural Network Forecast (Machine Learning)
· VantagePoint A.I. Daily Range Forecast
· Intermarket Analysis
· Our Suggestion
While we make all our decisions based upon the artificial intelligence forecasts, we do look at the fundamentals briefly, just to understand the financial landscape that $FI is operating in.
Wall Street Analysts Ratings and Forecasts
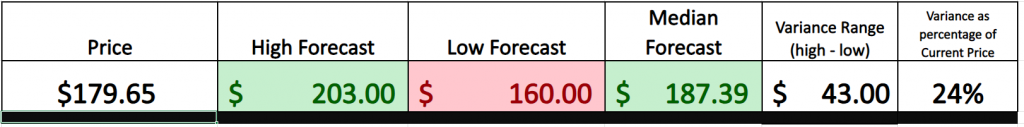
Here’s what the street is saying, folks—24 Wall Street wizards have been busy crunching numbers on Fiserv, and here’s the scoop: they peg the average target at $187.39. But hold on, it gets juicier. The most bullish of the bunch are aiming high at $203.00, while the cautious lot are hedging their bets and stating that their most bearish forecast is around $160.00.
What we always advise traders to do is to pay very close attention to the variance between the most bullish and most bearish forecasts as this is how the future volatility gets baked into price. Currently this variance is $43 or 24% of the most recent close. This percentage is noteworthy as in many cases uninterrupted rallies or declines will be within this percentage when measured from bottom to peak.
This level of volatility is moderate and very comparable to anticipated price action in the broader stock market indexes as well.
52 Week High and Low Boundaries
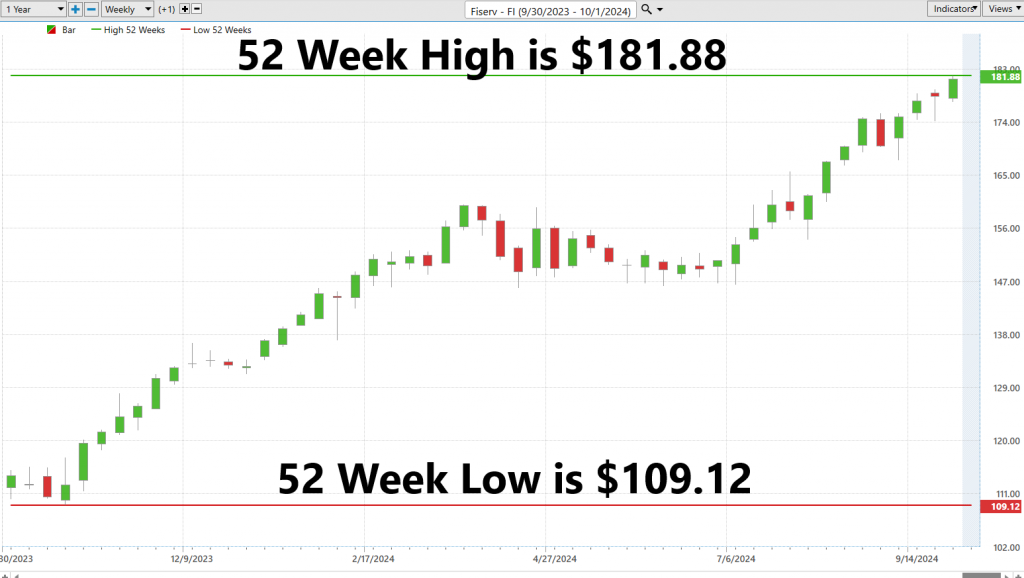
Over the last 52 weeks $FI has traded as high as 181.88 and as low as 109.12.
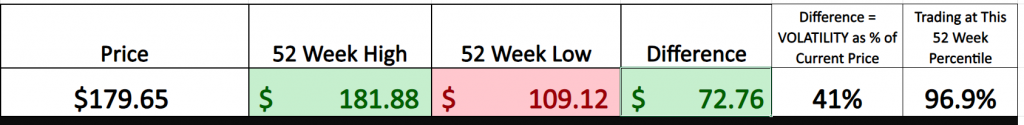
In our analysis we find it very valuable to look at the variance between the 52-week high price and the 52-week low price. We consider this metric to be a good guide of expected future volatility because it is based upon the most recent year’s price action.
The 52-week boundaries of a stock, marking the highest and lowest prices at which a stock has traded over the past year, are significant indicators for investors, especially for professional traders. These boundaries provide a clear snapshot of a stock’s historical high and low, serving as crucial benchmarks for assessing current price levels relative to past performance. Traders often focus on stocks that continually set new 52-week highs, viewing them as exhibiting sustained strength. This is because a stock that frequently breaks its previous highs is seen as having robust investor confidence and market momentum, qualities that suggest the potential for ongoing upward movement. Buying into these stocks can be a strategic move, as it rides the wave of positive sentiment and market strength, often leading to substantial gains as the stock continues to surge beyond its established boundaries.
You can prove this to yourself by simply studying the chart of $FI over the last year.
For 10 of the last 12 weeks $FI has consistently made new 52-week highs and in the process increased price by 12%.
One of our all-time favorite trading setups is to place assets on our watchlist that are in the process of making new 52-week highs and new 10-year highs simultaneously. $FI meets these criteria as demonstrated on the following 10-year chart.
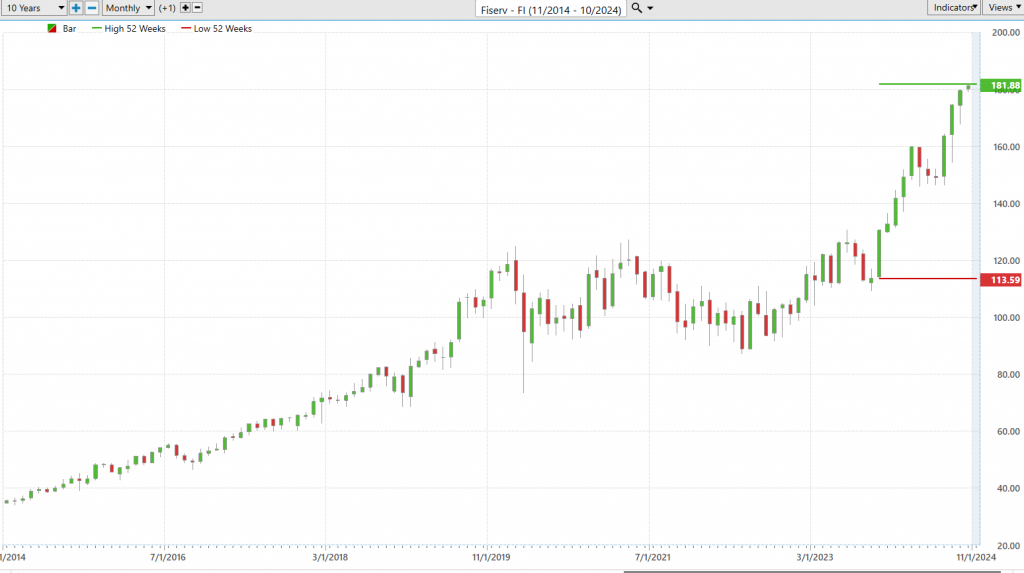
In 9 of the last 12 months $FI has made new 10-year highs. This metric by itself is very indicative of a stock that is breaking new barriers.
Best-Case/Worst-Case Analysis
One of the most practical and simple ways that a trader can understand the risk versus reward of a potential trade is to measure the rallies and declines of an asset over the past year. By doing so you begin to understand that if the future is anything like the recent past you will comprehend what volatility is and how it manifests in the price action.
To truly grasp market volatility, traders should not just skim but deeply analyze the historical price movements of stocks over the past year. This simple analysis involves mapping out the best and worst scenarios—capturing the best and worst—to visualize and understand the market dynamics thoroughly. This method allows traders to see beyond mere numbers and understand the real-world implications of market swings and their potential impact on investments and trading.
By examining both the strong rallies and the sharp declines, traders can gain a nuanced view of risk and reward. This isn’t just about making tactical moves; it’s about developing a comprehensive strategy that prepares one to handle market uncertainties effectively. The contrast between the heights of market optimism and the depth of pessimism reveals much about potential future movements and prepares traders to make informed, strategic decisions.
Such preparedness is crucial in navigating the often-tumultuous financial markets with confidence and strategic foresight. This methodical approach to understanding price actions—balancing the allure of potential gains against the sobering potential for losses—equips traders with the tools necessary for making prudent, well-informed trading choices.
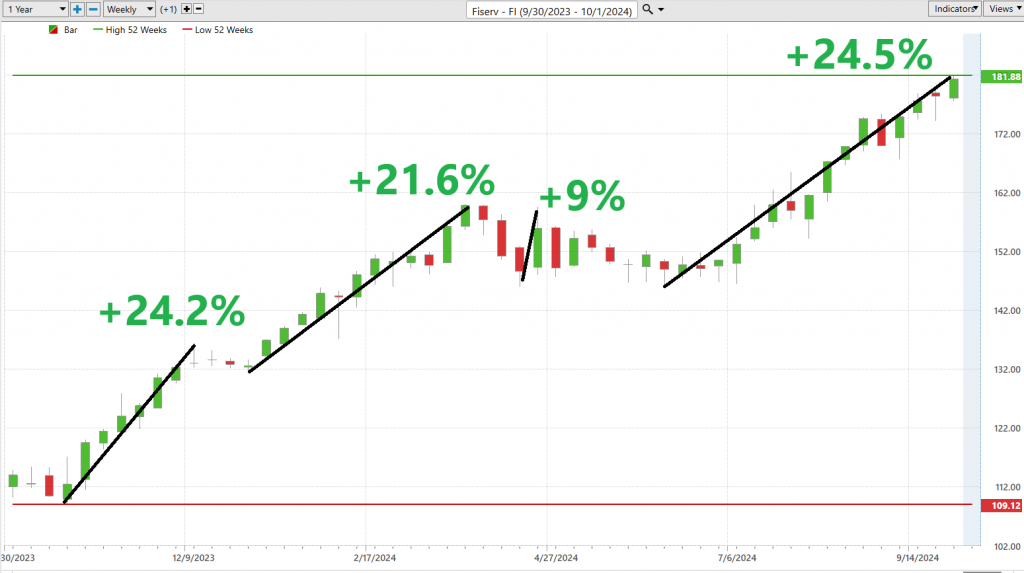
First, we evaluate the best-case scenario by measuring the strongest uninterrupted rallies.
Next, we look at the worst-case scenario which measures the magnitude of the largest uninterrupted declines.
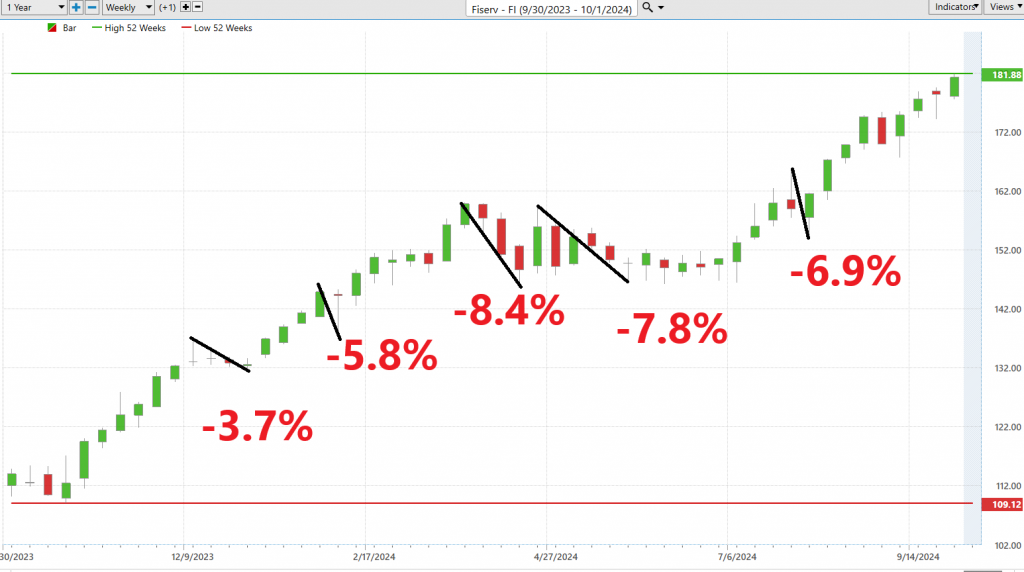
The bulls have clearly been in control all year in $FI. The declines have been quite moderate in comparison to the rallies.
Next, we like to compare $FI to the broader stock market indexes across multiple time frames. This exercise allows us to comprehend $FI’s performance to the different stock market indexes.
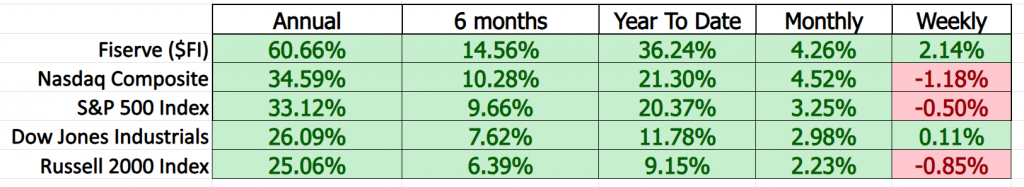
$FI outperformed the broader market decisively.
To get a better understanding of this we can dig down deeper and look at $FI in relation to its main competitors. By doing this following analysis we can see how $FI is positioned in its niche and determine whether it is a leader or laggard.
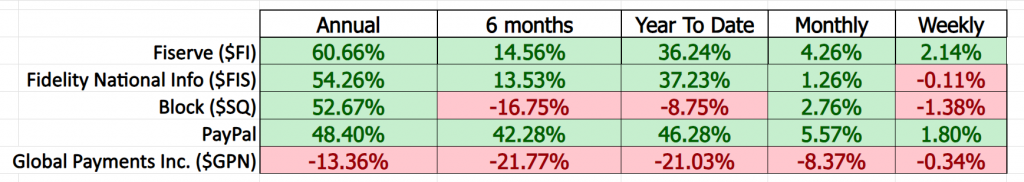
Out of all its main competitors $FI is clearly the dominant force.
This analysis provides a crystal-clear picture of $FI’s performance over the past year, highlighting how the stock’s gains have measured up against its losses, and the speed with which these changes have taken place. This insight is incredibly powerful—something no trader should overlook. It’s not just about observing the numbers; it’s about understanding the dynamics at play, which can significantly inform our trading strategies moving forward.
The 5-year beta for Fiserv ($FI) is 0.93. In simple terms, beta is a measure of how much a stock’s price moves compared to the whole stock market. For example, if the stock market goes up by 1%, a stock with a beta of 0.93 would typically go up by 0.93%. A beta less than 1 means the stock is less volatile than the market, so Fiserv is slightly less risky compared to the market average. This makes it potentially a safer but still responsive investment option relative to more volatile stocks.
Vantagepoint A.I. Triple Cross
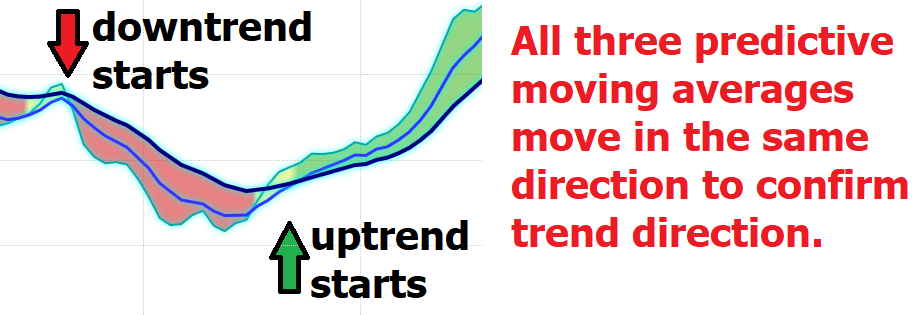
In the dynamic world of stock trading, identifying trends is crucial, especially for stocks like Fiserv ($FI). This is where the “Triple Cross” strategy, an innovative tool developed by VantagePoint A.I., becomes indispensable. By utilizing three predictive moving averages over short, medium, and long-term periods—specifically 3-day, 8-day, and 18-day—this strategy offers traders early warnings of trend shifts, providing an almost precognitive insight into market movements.
The strength of the Triple Cross lies in its precision and patience. It does not react to the initial signs of a trend shift but waits for confirmation from all three averages. This methodical approach helps sift through the market’s noise, pinpointing solid, actionable signals. This reduces the risk of premature trades based on misleading data, ensuring that every decision is well-grounded.
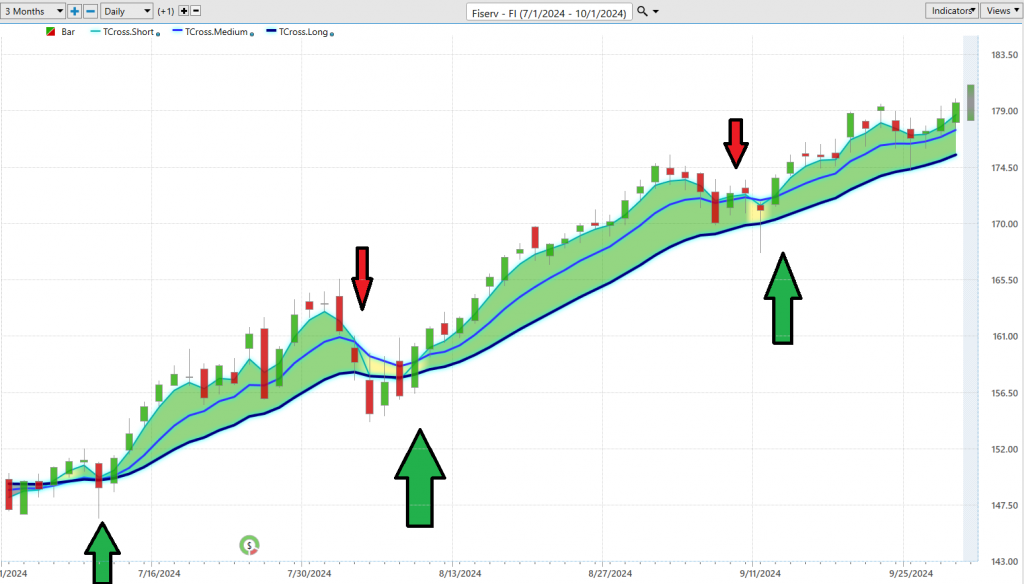
Ultimately, the Triple Cross isn’t just another trading indicator; it acts as a strategic market sentinel. It meticulously confirms each potential trend shift three times, enhancing the trader’s confidence and readiness to engage in high-quality trades. It’s meticulous in its execution, requiring alignment across all three timeframes before signaling a move, thus filtering out market noise and reducing the risk of premature entries. This disciplined approach ensures that only the most reliable signals guide trading decisions, marking the Triple Cross not merely as an indicator, but as a strategic ally in the volatile trading landscape. This triple validation ensures that traders are making informed, strategic decisions, backed by a robust analytical framework.
Neural Index (Machine Learning)
Neural networks in trading are a form of artificial intelligence designed to simulate the human brain’s information processing capabilities. By analyzing extensive market data, these networks predict future price movements. Each network consists of layers of “neurons” that process parts of the data, enhancing their connections as they learn, which improves prediction accuracy over time.
Traders build these networks by training them with large datasets, such as historical price movements and market indicators. Through repeated analysis and adjustments in neuron connections, the neural network refines its ability to forecast market trends, aligning its internal structure to better recognize data patterns.
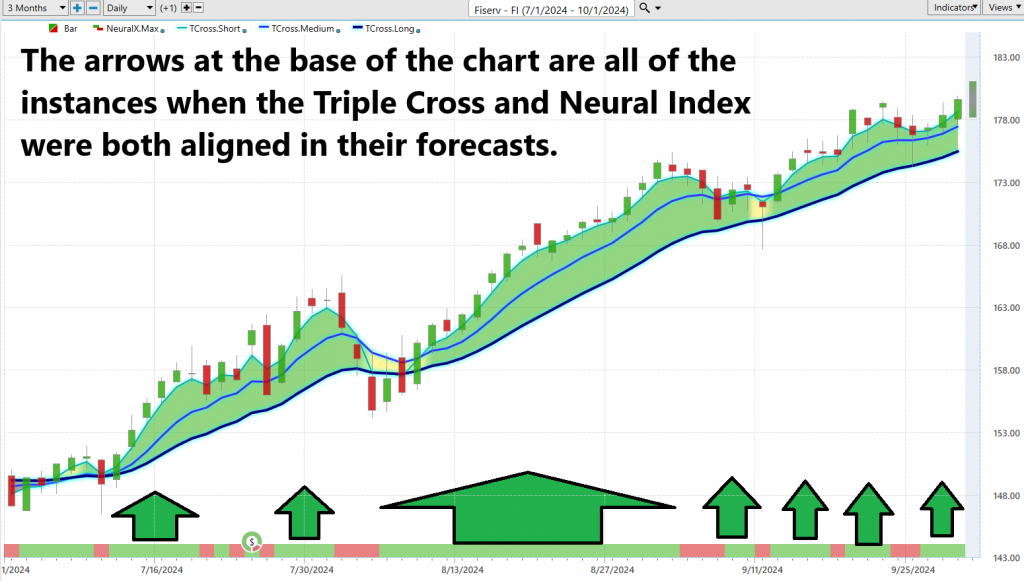
In practical terms, traders utilize tools like the Neural Index Indicator on trading charts, which works somewhat like a traffic light, signaling when the market conditions appear strong or weak. This indicator, when used alongside others such as the Triple Cross Indicator, helps traders pinpoint optimal trading times. This combination of advanced analytical tools enables traders to execute trades with greater precision, emphasizing accuracy over speed, and aiding them in making well-informed trading decisions.
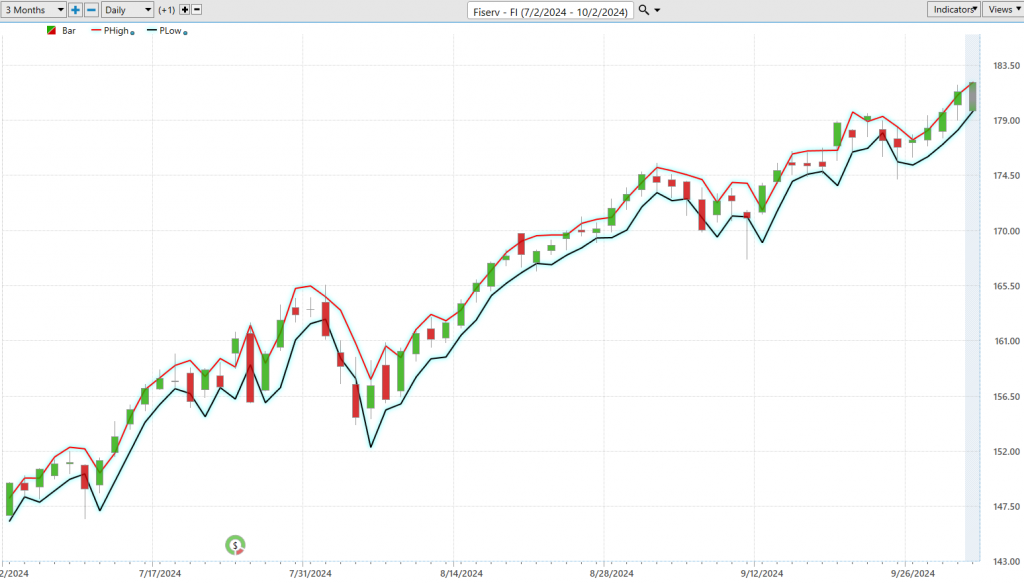
VantagePoint Software Daily Price Range Prediction
Alright folks let’s cut to the chase. In the trading game, timing isn’t just a nice-to-have, it’s the whole game. For those Power Traders out there, the VantagePoint A.I. Daily Range Forecast isn’t just a tool, it’s their secret weapon. It’s all about nailing those precise moments to jump in or bow out, making or breaking a trade.
Now, volatility is a constant shadow, always there, but simply having data isn’t enough anymore. You’ve got to leverage it—turn it into actionable insights with the big guns: A.I., machine learning, neural networks. These aren’t just tech buzzwords, they are essential tools that sharpen your edge, slicing through the noise with clear, precise forecasts.
Here are the daily, weekly, monthly average trading ranges for $FI over the past year.
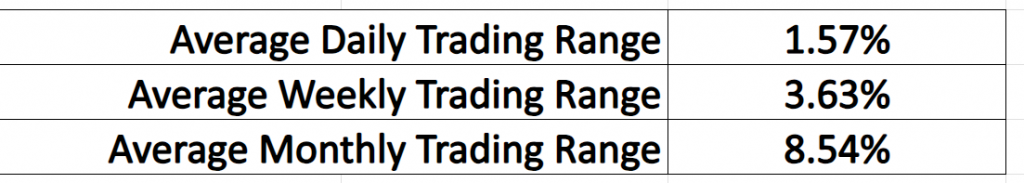
But what counts in the trading world is identifying those perfect moments for entry and exit.
You want to know precisely when to jump in and when to step out, right? Well, the Daily Range Forecast chart is like your personal navigation system in the bustling world of trading. It sets the course for short-term trades with the kind of precision you need to maneuver through the market’s twists and turns effectively. No guesswork is involved as the forecast provides an exact trading range for the following day and the trend is clearly delineated.
Here’s the bottom line: in the fast-paced arena of trading, precision isn’t just useful—it’s crucial. Armed with VantagePoint A.I.’s Daily Range Forecast, you’re equipped not just to survive but to excel. This tool uses artificial intelligence to predict the market’s next moves with remarkable accuracy, offering you the insights to time your trades expertly. Remember, staying ahead of the curve in trading isn’t just beneficial—it’s imperative.
Intermarket Analysis
Intermarket analysis provides a sophisticated framework for understanding how various financial markets—such as stocks, bonds, commodities, and currencies—are interconnected, shedding light on the potential ripple effects across these sectors. Pioneers like John Murphy have illustrated how movements in one market can presage changes in another, helping traders to predict trends and refine strategies. Lou Mendelsohn’s application of AI through tools like VantagePoint leverages these insights, enabling traders to navigate market dynamics with greater precision.
For companies like Fiserv ($FI), understanding these connections is crucial. For instance, the relationship between stock prices and interest rates is typically inverse; as interest rates climb, borrowing costs rise, potentially dampening corporate profits and investor enthusiasm for stocks. Additionally, the strength of the U.S. dollar can influence sectors relevant to Fiserv’s operations, including technology and financial services, as well as impact commodity prices, thereby affecting broader economic conditions.
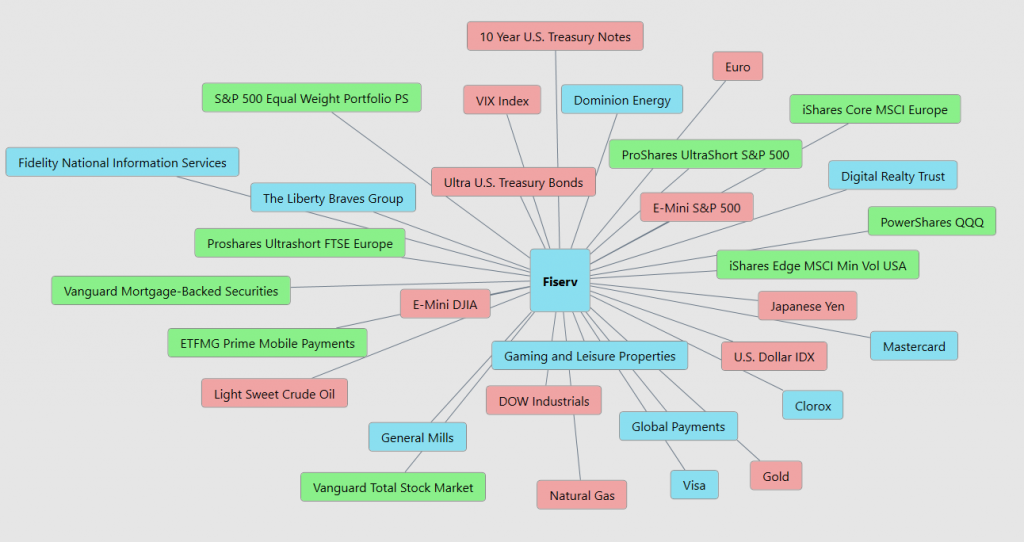
Moreover, for a global entity like Fiserv, currency market fluctuations play a significant role. The company’s international revenues can be heavily influenced by currency swings, impacting overall financial performance. By integrating intermarket analysis, companies and traders can gain a more holistic view of the market forces at play, better positioning themselves to anticipate shifts and devise robust strategic responses to complex global market dynamics.
Our Suggestion
Fiserv has demonstrated a strong financial performance over the past year, with its stock appreciating by 60%. This surge can be attributed to several key factors highlighted in their recent earnings calls. The company has seen significant organic revenue growth, particularly from its Merchant Solutions and Financial Solutions segments, which have been central to their strategic realignment and growth initiatives.
Financially, Fiserv has been focusing on enhancing operational performance and expanding its integrated portfolio of products and solutions. This approach has led to notable increases in adjusted revenue and earnings per share, which have consistently exceeded market expectations. Their strategy includes leveraging advanced technologies like A.I. to refine their service offerings, which has evidently paid off given their strong financial outcomes.
However, trading or investing in Fiserv ($FI) does come with risks. The company operates in a highly competitive and rapidly evolving industry, where technological advancements and market dynamics can shift quickly. Regulatory changes, economic fluctuations, and potential security breaches are additional risks that could impact their operations and financial standing. Despite these challenges, Fiserv’s continued focus on innovation and strategic market positioning provides them with significant growth opportunities, particularly in digital banking and e-commerce solutions.
$FI deserves to be on your trading radar.
The next earnings call for $FI is 10/22/2024 and analysts are particularly interested in growth in the international markets.
Use the daily forecast for shorter term trading opportunities.
Practice good money management on all your trades.
Let’s Be Careful Out There!
It’s Not Magic.
It’s Machine Learning.
Disclaimer: THERE IS A HIGH DEGREE OF RISK INVOLVED IN TRADING. IT IS NOT PRUDENT OR ADVISABLE TO MAKE TRADING DECISIONS THAT ARE BEYOND YOUR FINANCIAL MEANS OR INVOLVE TRADING CAPITAL THAT YOU ARE NOT WILLING AND CAPABLE OF LOSING.
VANTAGEPOINT’S MARKETING CAMPAIGNS, OF ANY KIND, DO NOT CONSTITUTE TRADING ADVICE OR AN ENDORSEMENT OR RECOMMENDATION BY VANTAGEPOINT AI OR ANY ASSOCIATED AFFILIATES OF ANY TRADING METHODS, PROGRAMS, SYSTEMS OR ROUTINES. VANTAGEPOINT’S PERSONNEL ARE NOT LICENSED BROKERS OR ADVISORS AND DO NOT OFFER TRADING ADVICE.


