


| This week’s stock analysis is Frontline PLC ($FRO) |
.
Frontline ($FRO) is a shipping company primarily involved in the transportation of crude oil and oil products through its fleet of vessels.
Frontline Plc ($FRO), a global powerhouse in the shipping world, sails the high seas transporting the lifeblood of industry: crude oil and its derivatives. Their fleet? A robust collection of crude oil tankers and product vessels, navigating key routes from the Arabian Gulf to the Caribbean, the bustling West African ports to the challenging waters of the North Sea. Now, how does Frontline chart its course to profitability? A mix of voyage charters, time-sensitive charters, and a touch of finance lease magic. And let’s talk numbers: a hefty market cap of $4.09 billion, sales ringing in at $1.92 billion, and an impressive operating margin of 42.82%. They’re not just in the business of shipping; they’re also wheeling and dealing in the charter, purchase, and sale of these maritime giants.
Frontline had approximately 2,300 employees. Frontline was founded by Norwegian shipping magnate John Fredriksen. It was established in 1985. It’s headquartered in Hamilton, Bermuda.
– **Competitors**: Frontline faces competition from various other shipping companies in the tanker industry:
1. **Teekay Corporation**: Teekay is a leading provider of international crude oil and gas marine transportation services.
2. **Euronav NV**: Euronav is a Belgium-based shipping company specializing in the transportation and storage of crude oil.
3. **DHT Holdings, Inc.**: DHT Holdings is engaged in the transportation of crude oil through its fleet of VLCCs (Very Large Crude Carriers).
4. **Nordic American Tankers Limited**: Nordic American Tankers operates a fleet of Suezmax tankers, primarily engaged in the transportation of crude oil.
5. **Tsakos Energy Navigation Ltd.**: TEN Ltd. is a Greek-based shipping company that operates a diverse fleet of crude oil and product tankers.
6. **Scorpio Tankers Inc.**: Scorpio Tankers specializes in the transportation of refined petroleum products, including gasoline and diesel.
7. **Navios Maritime Holdings Inc.**: Navios Maritime is involved in the transportation of bulk commodities, including iron ore, coal, and grains, in addition to tanker operations.
8. **Ardmore Shipping Corporation**: Ardmore Shipping primarily focuses on the transportation of petroleum products and chemicals.
9. **Okeanis Eco Tankers Corp.**: Okeanis Eco Tankers operates a fleet of modern eco-friendly tankers for the transportation of crude oil and petroleum products.
10. **AET Tankers**: AET Tankers, a subsidiary of MISC Berhad, is a leading provider of petroleum shipping services, including crude oil and refined products.
The shipping industry can be highly dynamic, with changes in market conditions, regulatory environments, and economic factors impacting the competitive landscape. Frontline’s business model benefits from the global demand for oil and oil products, making it well-positioned to profit from fluctuations in energy markets. Expansion into new markets or fleet optimization could also be growth opportunities. The shipping industry is exposed to factors such as volatile oil prices, regulatory changes, and geopolitical tensions. Additionally, environmental regulations and the shift towards cleaner energy sources pose long-term challenges/risks to the entire industry.
Their biggest revenue generator is the fees they charge for transporting these commodities via their fleet of vessels.
Here are the following revenue figures for $FRO:
2021: $449.76 million
2022: $1.164 billion
2023: only having reported Q1 and Q2 they have generated 874.94 million. The company is well on pace to surpass last year’s revenue #’s by substantial amounts.
The next earnings call is scheduled for November 30th, 2023.
In this weekly stock study, we will look at and analyze the following indicators and metrics as are our guidelines which dictate our behavior in deciding whether to buy, sell, or stand aside on a particular stock.
- Wall Street Analysts’ Estimates
- 52-week high and low boundaries
- Best Case – Worst Case Analysis and Takeaways
- Vantagepoint A.I. Forecast (Predictive Blue Line)
- Neural Network Forecast
- Bollinger Band Analysis
- Intermarket Analysis
- Our trading suggestion
We don’t base our decisions on things like earnings or fundamental cash flow valuations. However, we do look at them to better understand the financial landscape that a company is operating under.
Wall Street Analysts’ Estimates
The 14 analysts offering 12-month price forecasts for Frontline Plc have a median target of 22.40, with a high estimate of 30.00 and a low estimate of 17.00.
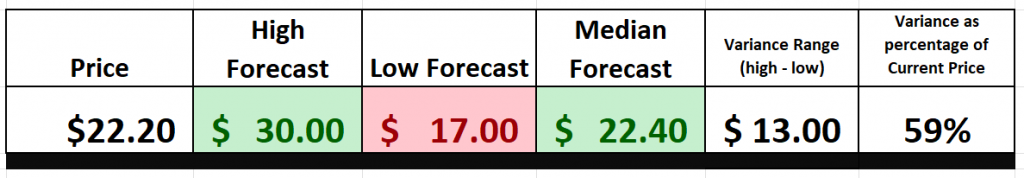
What I find interesting is the 59% variance between the most bullish analyst and the most bearish. Keep in mind that these are Wall Street Analysts who monitor the stock 24/7. The greater the variance between the bulls and bears the greater the opportunity for volatility which ideally is what we are looking for when guided by the artificial intelligence.
52-Week High and Low Boundaries
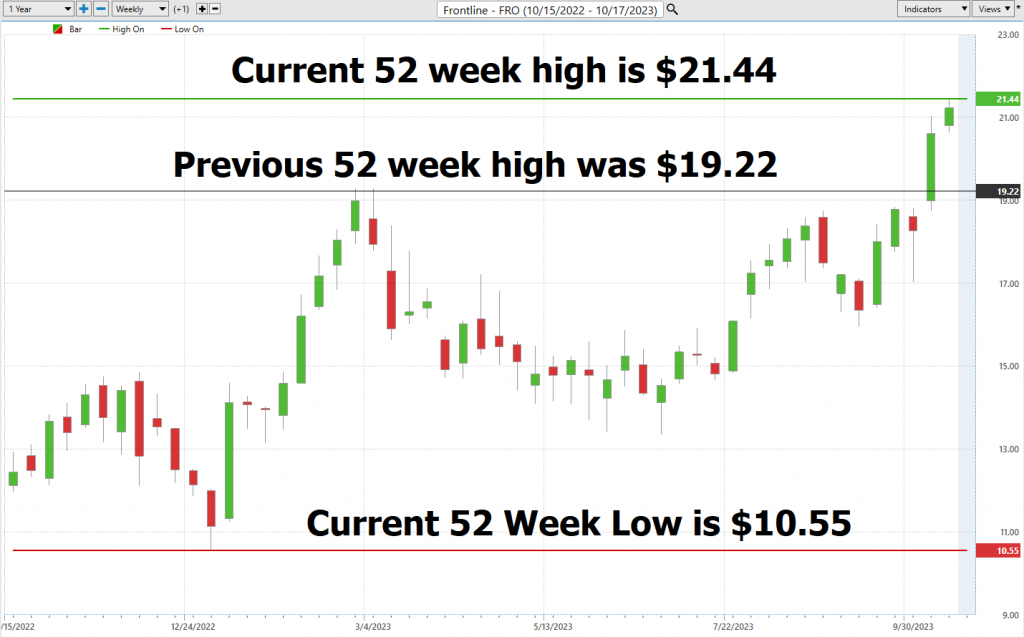
Looking at the Long-Term chart of $FRO provides us with the 52-week high and low boundaries. Over the past year $FRO has traded as high as $21.44 and as low as $10.55. The annual trading range was $10.89. When we divide the annual range into the current price, we can determine the annualized statistical volatility. Currently, the annualized statistical volatility on $FRO is 51.8%. This tells us that it would be completely normal to see $FRO trade 51.8% higher and or lower over the next 12 months.
$FRO is currently trading at its 96th percentile of the last 52 weeks and you can quickly see on the chart that it has been making new 52-week highs over the past two weeks.
When we delve into the world of stocks, there’s one number that stands tall, one number that can be the difference between riding high or hitting rock bottom. I’m talking’ about that 52-week range. This isn’t just any old number; it’s a litmus test of value, a yardstick of how the market’s been sizing up a stock for a whole year.
Now, what’s the story here, you ask? It’s like watching’ a racehorse galloping towards that 52-week high mark once again. It’s like that horse giving it everything it’s got in that final stretch.
But don’t think these 52-week high and low marks are just lines on a chart! They’re the lifeblood of the market, the very pulse of investor sentiment. When a stock’s flirting with its 52-week high, it’s like a siren call, beckoning the bulls. On the flip side, when it’s lurking near that 52-week low, it’s a stark reminder of bearish vibes in the air.
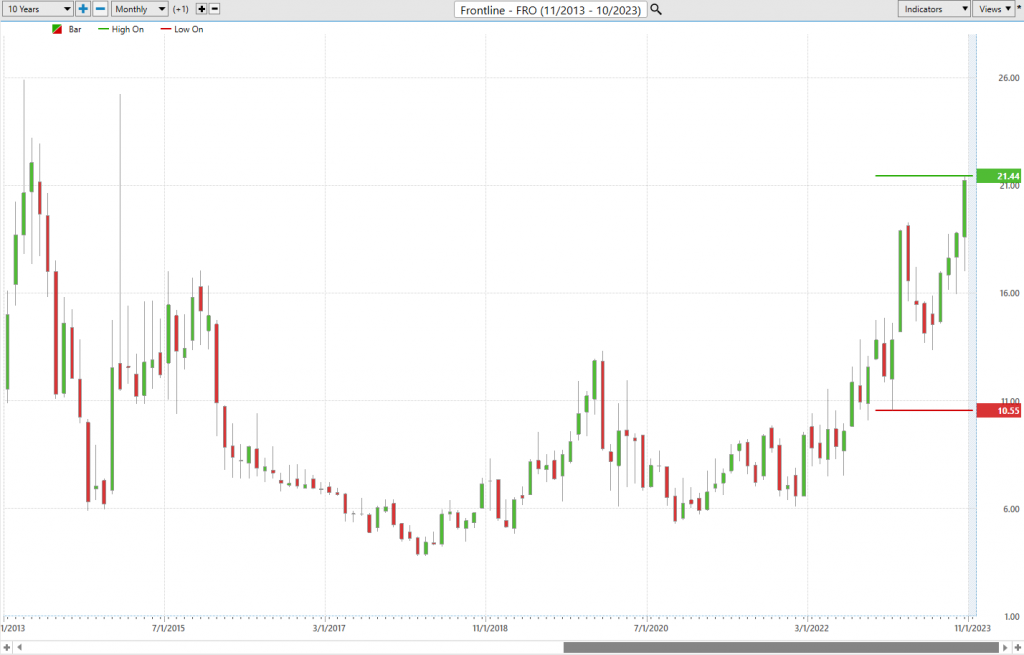
Let’s take a deep dive into the long-term chart of the iconic $FRO. What we’ve got here is a real adrenaline-pumping roller-coaster, a vivid testament to the wild, unpredictable dance of the markets. Keep in mind, these aren’t just ordinary numbers; they’re the captivating chapters in the epic saga of a stock’s odyssey within this grand tapestry that we call the market.
Now, if we turn our attention to the 10-year chart, you’ll notice that $FRO is currently trading comfortably in the 79th percentile. That’s right, it’s within striking distance of revisiting those highs we witnessed on its decade-long journey. This is where the excitement really ramps up!
Best Case – Worst Case Scenario
When we step foot into the world of trading, it’s like entering a battle, a struggle for financial comprehension and victory. And just like a seasoned general wouldn’t go into battle without a battle plan, traders and investors should never enter the market without a strategy. One of our most powerful weapons in this financial landscape is what I like to call “best-case and worst-case analysis.” Picture it as peering through two distinct sets of binoculars, each offering a unique view of the same terrain.
Now, why is this tactic vital? Well, by examining both the sunlit, clear-sky scenarios and the turbulent stormy ones, you equip yourself with a comprehensive 360-degree perspective of a stock’s potential. It’s not just about the sunny days and the potential profits; it’s equally about those looming storm clouds and the dangers lurking on the horizon. This dual-lens approach forms the very foundation of understanding the volatility of an asset. It’s akin to having a trusty compass guiding you through the unpredictable seas of the stock market.
By carefully assessing both the possible windfalls and pitfalls, you’re not just winging it; you’re navigating with intention. It empowers you to quantify your exposure, to discern when to hold your ground and when to adjust your course. It’s about evaluating the true, underlying value of a stock, not just being dazzled by its glittering promises.
In the grand scheme of things, this isn’t just a method; it’s a philosophy, a way of life in the world of trading. It’s about weighing the scales of risk against reward, ensuring that your trading portfolio isn’t just a flash in the pan but a strategic blueprint for long-term financial success. The endgame? To measure the stock’s summits against its valleys, ensuring that you’re not merely riding the waves, but mastering them. Always remember, my friends, in the realm of trading, knowledge isn’t just power; it’s the compass that points the way to prosperity.
What we want to always do is to weigh the risk versus the reward. The simplest and fastest way to accomplish this is to look at the past 52 weeks and measure the best trough-to-peak rallies, against the worst uninterrupted declines.
First, we do the Best-Case analysis:

Followed by the WORST-CASE Analysis:
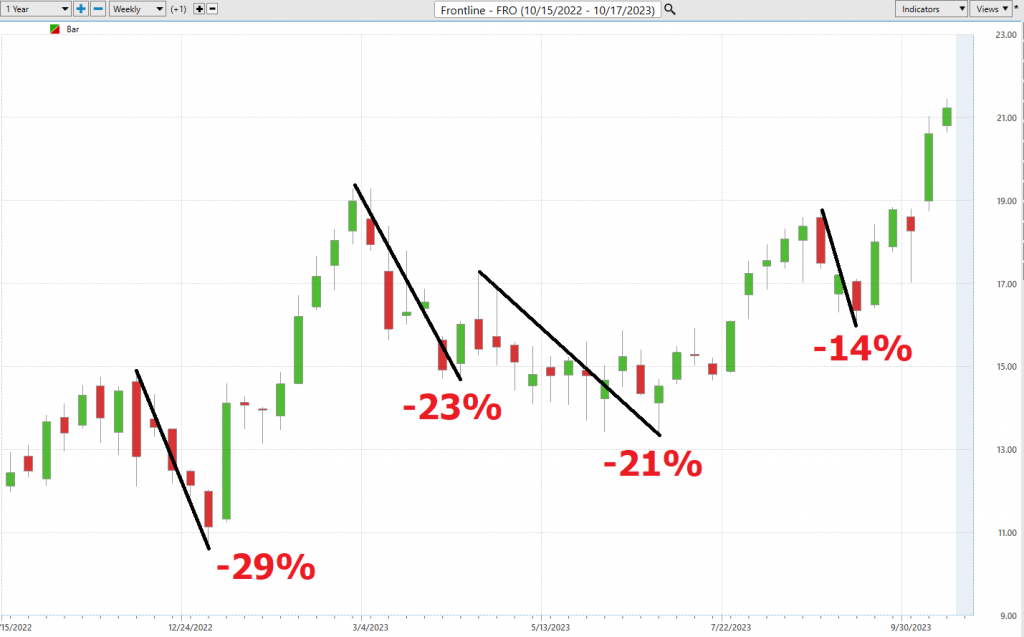
This initial analysis lets us see how quickly $FRO falls in comparison to its rallies.
Next, we want to compare the performance of $FRO to the major broad market indexes.

Frontline PLC, with the ticker symbol $FRO, has been nothing short of a market standout, consistently outperforming major market indices across various time frames. Its remarkable track record warrants closer examination, especially concerning its volatility and its comparison with market heavyweights. In the realm of finance, this is often encapsulated by a metric known as “BETA.”
Beta (β) serves as the Richter scale of the stock universe, providing us with valuable insights into how much a stock shakes and trembles in response to the broader market’s movements, typically benchmarked against a major index like the S&P 500. In simpler terms, beta quantifies a stock’s sensitivity to the ebbs and flows of the market.
Now, let’s delve into the nuances of beta, a critical gauge for deciphering a stock’s relationship with the broader market. Here’s the breakdown:
– **Beta = 1:** A stock with a beta of 1 signifies that its price movements closely mimic those of the overall market. If the market experiences a 5% surge, a stock with a beta of 1 should follow suit with a 5% increase.
– **Beta > 1:** Imagine this as the stock market’s thrilling rollercoaster ride. A beta exceeding 1, let’s say 1.5, implies that the stock is 50% more volatile than the market itself. When the market enjoys a 5% ascent, this high-beta stock might embark on a heart-pounding 7.5% climb (or descent, for that matter).
– **Beta < 1:** Here’s where stability enters the picture. A beta below 1, such as 0.5, suggests that the stock is only half as volatile as the market. In a 5% market upswing, this stock might experience a more measured 2.5% rise.
Now, let’s apply this wisdom to $FRO, Frontline. Over the 5-year horizon, $FRO exhibits a beta of 0.96. It’s essential to note that beta is rooted in historical data and doesn’t necessarily foretell future performance. A high beta doesn’t guarantee high returns; instead, it underscores the stock’s propensity for price fluctuations, signaling an elevated level of risk. What makes Frontline PLC’s ($FRO) performance so incredible is that it has a beta less than the broader market and yet on an annualized basis it performed 3.5x better than the S&P 500 Index.
Vantagepoint A.I. Predictive Blue Line Forecast
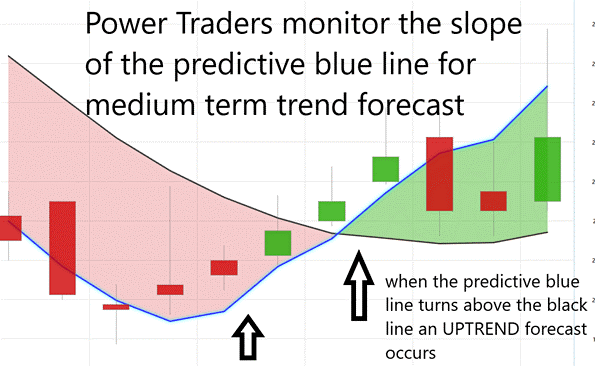
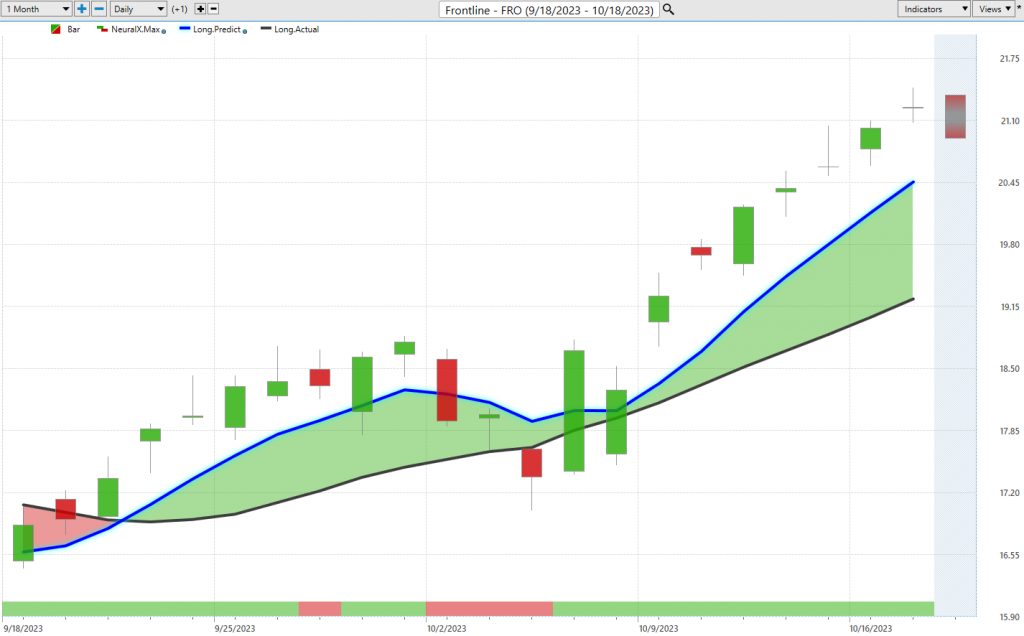
On the following chart you will see the power of the VantagePoint Predictive blue line which determines the medium-term trend price forecast.
The guidelines we abide by are as follows:
- The slope of the predictive blue line determines the trend forecast and general direction of $FRO
- Ideally, the VALUE ZONE is determined to try and find buy opportunities at or below the predictive blue line, or to sell opportunities above the predictive blue line during a downtrend.
In the world of trading, where precision is paramount, the blue line reigns supreme as the harbinger of forecasts and the optimal path forward. In this dynamic landscape of innovation, VantagePoint Software emerges as a formidable player, harnessing its remarkable artificial intelligence capabilities. Think of it as your very own forecasting ninja, affording traders an exclusive preview of trend projections, all made possible through the meticulous monitoring of that pivotal predictive blue line.
Now, you may be wondering about the unassuming black line. It may appear straightforward, but it serves as our rearview mirror, a 10-day moving average of prices, offering a glimpse into the market’s recent history.
Yet, let’s direct our attention to the true star of the show: the predictive blue line. This is no ordinary line; it’s the epicenter, the zone of value where astute traders engaged in an uptrend seek to seize assets at or slightly below this defining blue benchmark. The magic behind this blue line? It owes its prowess to the groundbreaking technology of VantagePoint—a fusion of artificial intelligence, neural networks, and intermarket analysis, all working in harmonious concert to pave the way for the best move forward.
As you immerse yourself in the chart, consider the delicate interplay between the black line and the predictive blue line. Rest assured; this blue line isn’t conjured through mere guesswork. Rather, it’s the result of VantagePoint’s cutting-edge neural network and intermarket analysis, meticulously scrutinizing the most influential price drivers of an asset. It’s about leveraging the power of AI and data correlations to unravel the intrinsic value of an asset.
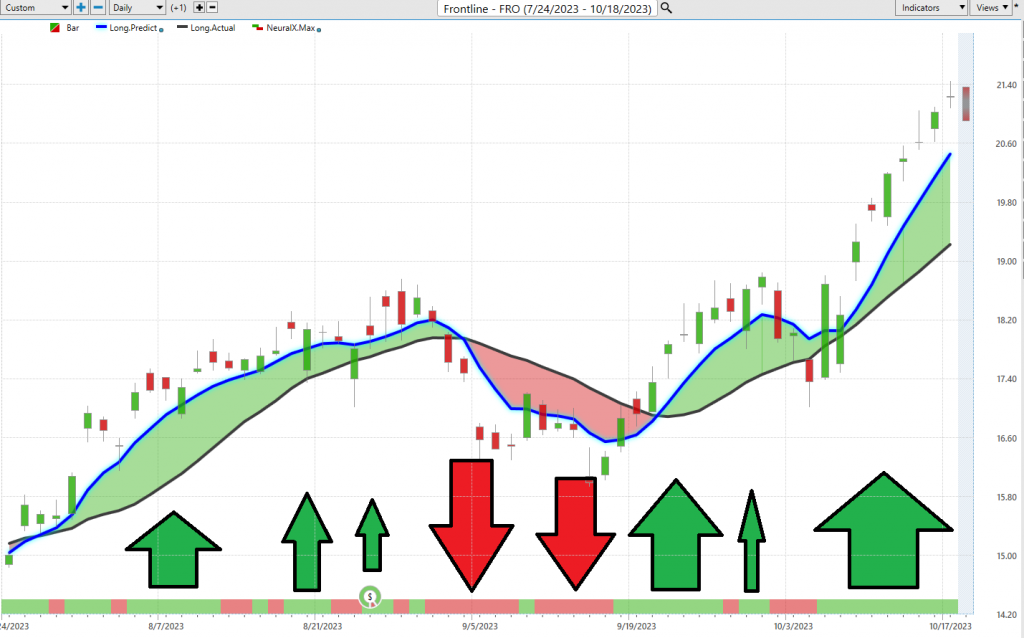
You can quickly see that 3 trend forecasts occurred over the past three months.
The results are as follows:
Trend #1 resulted in gains of 13% on the long side.
Trend #2 resulted in gains of 1.2% on the short side.
Trend #3 resulted in gains of 18.7% on the long side.

Now, here’s a golden nugget for all you traders out there: when that predictive blue line surges above the black line, it’s akin to the market unfurling a green flag, signaling an entry opportunity on the upswing. So, maintain your vigilance, stay well-informed, and above all, stay one step ahead of the ever-evolving financial landscape!
Neural Network Indicator (Machine Learning)
At the base of this chart, you’ll find the Neural Network Indicator – a very active shorter term forecasting tool, if you will, predicting the market’s short-term vigor or frailty. When that Neural Net Indicator is showing green, it’s like a beacon of strength shining through. But when it turns red, it’s sounding the alarm for short-term market weakness. And when it’s yellow, it cautions us about sideways price movements.
Now, what exactly is this Neural Net? It’s like having a brilliant artificial mind in your trading toolkit, thanks to cutting-edge AI. This thing processes an immense amount of data, tirelessly working to churn out precise predictions. It’s constantly honing its skills, delving deep into the complexities of the market, from the nitty-gritty technical stuff to global happenings. Lightning-fast, it connects the dots between seemingly unrelated market factors, like the way it links shifts in oil prices to unexpected swings in stock indices.
For us Power Traders, confirmation is key. We keep a keen eye on both that predictive blue line and the Neural Network Indicator. When they’re both pointing in the same direction, it’s a signal as clear as day. But if they’re hinting at caution, we take a step back and reevaluate.
In essence, Neural Networks are the future of trading, offering insights that traditional methods can only dream of. For us Power Traders, having both the Neural Network and AI forecast on our side is like having the wind at our backs. When they align, it’s a green light. But when they diverge, we tread carefully. In the world of trading, double-checking is our bedrock of success.
We urge Power Traders to cross-reference the chart with that predictive blue line and the Neural Network Indicator to pinpoint those optimal entry and exit points. For the serious trader, neural networks are the next-gen tool to uncover those elusive non-linear connections and patterns that traditional analysis misses. We watch Neural Net for confirmation to decide whether to go long or short. In simpler terms, if the AI forecast is green and the Neural Net is green, that’s a buy signal.
Power Traders always have their eyes on both the Neural Network and AI, searching for statistically sound trading opportunities. It’s about staying ahead of the game, my friends.
The arrows on the chart are all of the times when the Neural Index and the a.i. were both forecasting the same direction. These are high probability trend forecasts.
Daily Range Forecast & Analysis
For those elite Power Traders who’ve placed their trust in VantagePoint Software, there’s a beacon they rely on day in and day out: the VantagePoint Daily Price Range forecast. It’s become their guiding star amidst the often-tumultuous seas of market price action.
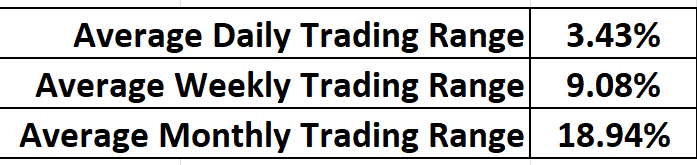
Let’s dive into the nitty-gritty of the average trading range metrics for $FRO over the past year, covering daily, weekly, and monthly intervals.
Now, every trader grapples with a profound daily challenge – when precisely to make their move in the market. But with the power of VantagePoint’s A.I. and the Daily Price Range Forecast, it’s like having a market sage quietly whispering invaluable advice in your ear.
Now, add the VantagePoint A.I.’s daily range forecast into the mix. Imagine having a subtle nudge, a gentle hint, predicting the market’s next step. By seizing opportunities at the lower end of the forecast and planning your exits at its peak, traders can potentially tip the odds in their favor while keeping a tight grip on risk.
But here’s the kicker: the daily valuation of the stock market isn’t solely driven by corporate moves or financial reports. It can swing wildly due to factors as diverse as a fleeting tweet or global upheavals. So, predicting these market gyrations? It’s an intricate art. Yet, VantagePoint A.I. seems to have mastered it, seamlessly blending A.I., neural genius, and machine learning in the pursuit of the perfect prediction.
Successful trading boils down to pinpointing that perfect timing for market entry and exit. VantagePoint doesn’t just help identify that pivotal moment; it achieves it with astounding precision. The Daily Range forecast is updated daily, offering a window into potential price paths. It’s like having a seasoned market guru sharing time-tested insights.
Now, take a look at that chart. It’s more than just pretty lines; it’s a roadmap for strategic stop placements and risk management. Notice how rarely prices dip below that prominent dark line? It’s a clear signal, indicating the optimal zone for setting buy stops, ensuring that risks are finely tuned.

$FRO presents ample opportunities, but for traders who are not versed in managing volatility, it can be a risky asset to navigate. So, heed the wisdom of VantagePoint and navigate these waters with confidence.
Intermarket Analysis
In the world of trading and investments, it’s all about how we respond to the truths we uncover. Imagine this financial world as a massive jigsaw puzzle, and we’re here to decode why the prices of assets like stocks, oil, and currencies move the way they do. But let’s not get distracted by the sensational stories in the news; those are just the juicy plot twists in our financial thriller.
To get to the heart of the matter, we need to put on our detective hats and employ a powerful tool called “intermarket analysis.” Think of it as hunting for clues in various corners to solve the grand mystery. You see, our world is an intricate web where everything is intertwined. Intermarket analysis is the savvy trader’s way of dissecting the connections between different elements, like stocks, oil, and currency values. This savvy approach enables them to foresee potential price movements and make shrewder decisions.
Picture this: you’ve got a bunch of strings, and when you tug on one, the others respond in kind. That’s the essence of intermarket analysis. By understanding how these strings are interconnected, you can make predictions and fine-tune your strategies to maximize your profits.
In simple terms, intermarket analysis is the tool that unravels the mysteries behind price fluctuations and reveals how various aspects of the financial world are interconnected, like pieces of a complex puzzle. It’s like being a financial detective, allowing you to make more informed choices in the realm of trading and investing.
The real power lies in our response to the truths we uncover. When it comes to trading, it’s not enough to be captivated by headlines or mesmerized by stories in the financial news. We need to dig deeper, my friends. We need to understand what’s truly driving the prices of assets in this global marketplace.
That’s where intermarket analysis comes into play. It looks at how different things in the world of money, like stocks, oil, and currencies, are connected. You see, everything in finance is intertwined, and knowing those connections can make all the difference.
Think of it this way: if you know that when one domino falls, it affects the others, you can predict the domino effect. That’s what intermarket analysis does. It helps us see the bigger picture, how changes in one market can ripple through others, and how global events impact our investments.
Don’t rely on fear-inducing talking heads in the media. Base your decisions on facts, on understanding these connections. Intermarket analysis isn’t just a tool; it’s your secret weapon to stay ahead in this ever-changing financial world. Remember, you have a choice – follow the noise, or follow the facts.
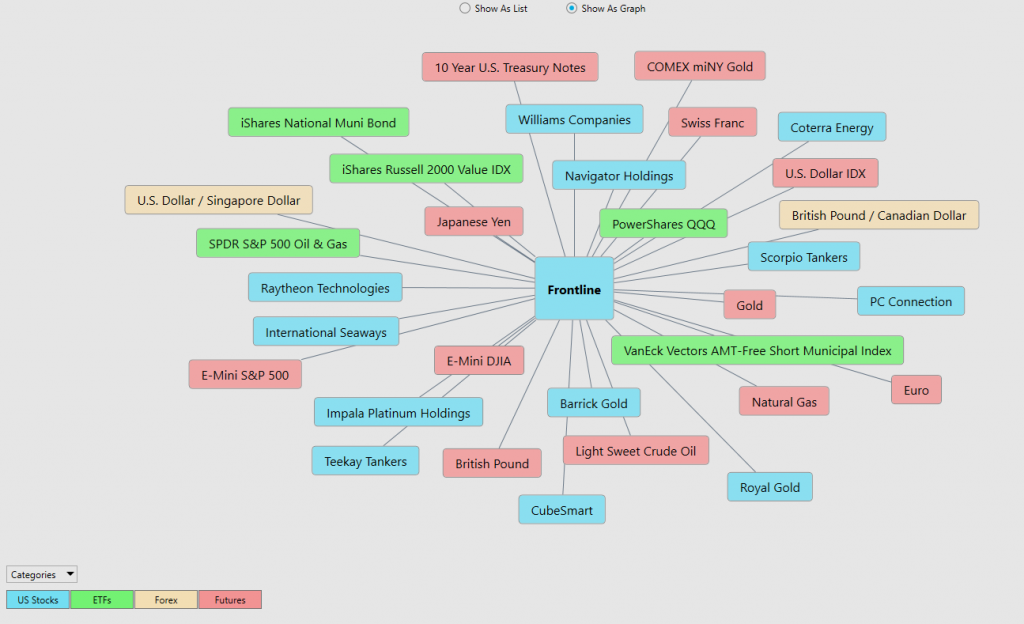
Now, feast your eyes on this Intermarket Analysis graphic, my friends. It unveils the 31 markets that hold the key to deciphering $FRO’s price movements. There’s immense value in comprehending these drivers. This graphic offers a microcosmic view of what’s been propelling $FRO’s ascent.
Our Suggestion
Traders, take note: $FRO deserves a prime spot on your trading opportunity radar for the upcoming year. Here’s a quick rundown of why:
#1 $FRO has massively outperformed the broader market. It also has a BETA of .96. This means that over the past 52 weeks, with less volatility than the S&P 500 $FRO has significantly outpaced the broader market. This is the ideal type of trading opportunity.
#2 $FRO is still trading at a forward Price to earnings multiple of roughly 7x. Which is significantly less than the 23x multiple on the S&P 500.
#3 – Let’s talk about what really gets traders’ hearts racing – those stocks that go on wild rides, the ones with the kind of swings that keep you on the edge of your seat. Now, when it comes to Frontline PLC, ticker symbol $FRO, it fits that bill just fine.
You see, some stocks are like a calm river, gently meandering along. But $FRO, it’s not your run-of-the-mill stock. No sir, it’s a wild one, and traders love that. In the past 12 months, it hasn’t been sitting’ still, not by a long shot. It’s been moving’ up and down, often by a whopping +/- 9% trading range every week.
Now, that’s what I call some real action! So, if you’re the kind of trader who likes a stock that keeps things interesting, $FRO might just be right up your alley. It’s not for the faint of heart. Plenty of volatility (risk) but for those who thrive on volatility, it’s like a siren’s call in the world of trading particularly when guided by the A.I.
In summary, $FRO presents a compelling case for trading opportunities in the coming year. Keep it firmly on your watchlist.
Our recommendation is to follow the A.I. trend analysis as outlined in this stock study and practice good money management on all trades.
We will re-evaluate daily based upon:
- New Wall Street Analysts’ Estimates
- New 52-week high and low boundaries
- Vantagepoint A.I. Forecast (Predictive Blue Line)
- Neural Network Forecast
- Daily Range Forecast
The trend in $FRO is UP. We will look to the bottom of the daily range forecast for opportunities to position ourselves LONG with tight stops for short-term trades.
Let’s Be Careful Out There!
It’s Not Magic.
It’s Machine Learning.
Disclaimer: THERE IS A HIGH DEGREE OF RISK INVOLVED IN TRADING. IT IS NOT PRUDENT OR ADVISABLE TO MAKE TRADING DECISIONS THAT ARE BEYOND YOUR FINANCIAL MEANS OR INVOLVE TRADING CAPITAL THAT YOU ARE NOT WILLING AND CAPABLE OF LOSING.
VANTAGEPOINT’S MARKETING CAMPAIGNS, OF ANY KIND, DO NOT CONSTITUTE TRADING ADVICE OR AN ENDORSEMENT OR RECOMMENDATION BY VANTAGEPOINT AI OR ANY ASSOCIATED AFFILIATES OF ANY TRADING METHODS, PROGRAMS, SYSTEMS OR ROUTINES. VANTAGEPOINT’S PERSONNEL ARE NOT LICENSED BROKERS OR ADVISORS AND DO NOT OFFER TRADING ADVICE.


