


This week’s ai stock spotlight is SPDR Gold Shares ETF ($GLD)
In a market increasingly defined by uncertainty, SPDR Gold Shares ($GLD) has reemerged as a central pillar of investor strategy, offering a liquid, transparent, and cost-effective way to gain exposure to gold. Launched in November 2004, $GLD was the first U.S.-listed exchange-traded fund designed to track the price of gold bullion. Its purpose is straightforward: to reflect the performance of the price of gold, minus expenses, by holding physical gold in vaults. For traders and investors alike, $GLD serves as a powerful proxy for the yellow metal without the logistical complexities of taking physical delivery.
In today’s macroeconomic climate, the appeal of $GLD has only intensified. With concerns about currency debasement accelerating, particularly in the wake of multi-trillion-dollar fiscal packages and ballooning sovereign debt, gold has once again stepped into the spotlight as a hedge against inflation and the long-term erosion of purchasing power. Fiat currencies are under pressure, and as real yields remain negative, gold’s opportunity cost diminishes. $GLD gives investors the ability to align their portfolios with hard assets in an era of soft money.
The bond market’s volatility has also added fuel to the gold rally, drawing more capital into gold-tracking instruments like $GLD. As yields swing wildly and debt ceiling theatrics dominate headlines, investors are losing faith in the long-term stability of Treasuries. $GLD, by contrast, offers a perceived safe haven — a financial lifeboat when traditional interest-bearing assets no longer inspire confidence. Its daily liquidity and deep options market make it especially attractive for tactical traders looking to hedge or express macro views.
Listen up, because this is the kind of truth that gets buried under a mountain of economic double-speak. Uncle Sam is staring down the barrel of $8 trillion in Treasury debt that has to be rolled over this year. And here’s the million-dollar question every trader with a brain is asking: Who is gonna buy it? Foreign demand is slipping, the Fed’s walking a tightrope, and if the government ends up buying its own IOUs — that’s not policy, that’s printing press panic. It’s pure, uncut currency debasement, and if you think that’s not inflationary, I’ve got a bridge to sell you.
Then there’s the geopolitical wild card. Rising tensions between global superpowers, persistent regional conflicts, and the resurgence of trade wars have sparked risk aversion across markets. During such periods, capital often flows into safe-haven assets. $GLD, backed by physical gold stored in HSBC’s London vaults, offers investors a defensible position — one that doesn’t rely on the stability of a single government or institution. When headlines destabilize equity markets or currencies, $GLD often benefits from inflows, reinforcing its role as a global barometer of fear.
Perhaps most tellingly, the world’s central banks have become net buyers of gold at historic levels, a profound shift that has not gone unnoticed by institutional money managers. Central banks — long viewed as antagonists to gold — are now stockpiling it at a record pace. This wave of sovereign buying sends a loud message: the traditional monetary system is under stress. For investors, $GLD offers a way to ride this trend, mirroring the strategic allocation decisions of monetary authorities without the need for sovereign vault access. In this environment, $GLD isn’t just an ETF — it’s a statement.
In this asset study, we will look at an analysis of the following indicators and metrics which are our guidelines, and which dictate our behavior in deciding whether to find opportunities to buy, sell, or stand aside on a particular asset:
- 52 Week High and Low Boundaries
- Best-Case/Worst-Case Analysis
- Vantagepoint A.I. Predictive Blue Line Indicator
- Neural Network Forecast (Machine Learning)
- VantagePoint A.I. Daily Range Forecast
- Intermarket Analysis
- Our Suggestion
Wall Street Analysts Forecasts
Unlike traditional equities, gold isn’t a favorite among Wall Street stock analysts — it doesn’t generate earnings, pay dividends, or report quarterly surprises. As a commodity, gold often escapes the coverage of mainstream analysts who focus on balance sheets and profit margins. That said, the big banks — the likes of Goldman Sachs, Bank of America, and Deutsche Bank — do keep a close eye on the supply and demand dynamics surrounding gold, especially when those fundamentals provide a lens into broader economic forces like inflation, currency stability, and geopolitical stress.
For this analysis, I reviewed gold price forecasts from eight major banking institutions. What stood out wasn’t just the numbers themselves — but the staggering spread between them. At the bullish end, the high forecast came in at $4000, while the most conservative call clocked in at just $1,820. That’s a delta of $1,880, nearly mirroring gold’s current price of $3,450 — a spread that translates to 65% historical volatility. In other words, even the top minds in finance can’t seem to agree on where gold is heading, and that divergence speaks volumes about the uncertainty and instability defining today’s macro environment.
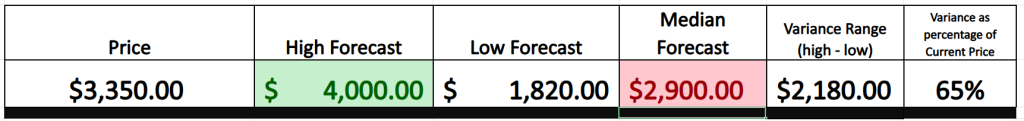
Here are the eight Wall Street gold price forecasts for 2025:
- Morningstar – $1,820. Analyst Jon Mills projects a significant correction in gold prices, anticipating a decline to $1,820 over the next five years. This forecast is based on expectations of increased gold supply and a potential reduction in demand as economic conditions stabilize.
- Deutsche Bank – $2,725 (average for 2025). Deutsche Bank forecasts an average gold price of $2,725 per ounce in 2025, with a projected range between $2,450 and $3,050. This outlook considers factors such as economic growth, inflation trends, and central bank policies.
- Citi – $2,900 (average for 2025). Citi has revised its 2025 gold price forecast upward to an average of $2,900 per ounce, citing increased demand from central banks and investors seeking safe-haven assets amid geopolitical uncertainties.
- UBS – $3,200 (Q3 2025 average). UBS projects an average gold price of $3,200 per ounce in the third quarter of 2025, supported by factors such as a weakening U.S. dollar, geopolitical tensions, and sustained demand from central banks.
- Bank of America – $3,500. Bank of America has set a gold price target of $3,500 per ounce, attributing this forecast to rising tariffs, slowing economic growth, and persistent geopolitical risks that enhance gold’s appeal as a safe-haven asset.
- Goldman Sachs – $3,700. Goldman Sachs has raised its end-2025 gold price forecast to $3,700 per ounce, driven by robust central bank demand and increased investor interest in gold-backed ETFs.
- J.P. Morgan – $3,675 (Q4 2025 average). J.P. Morgan anticipates an average gold price of $3,675 per ounce in the fourth quarter of 2025, expecting strong investor and central bank demand to continue amid heightened recession risks.
- Jeffrey Gundlach (DoubleLine Capital) – $4,000. Billionaire investor Jeffrey Gundlach forecasts that gold prices will reach $4,000 per ounce, citing continued central bank buying and a high probability of a U.S. recession as key drivers.
These forecasts reflect a range of perspectives on gold’s trajectory, influenced by factors such as central bank policies, economic growth, inflation expectations, and geopolitical developments.
52 Week High and Low Boundaries
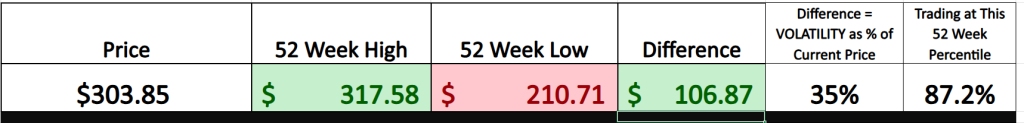
Traders and investors frequently rely on the 52-week high and low markers as essential indicators of a stock’s range-bound behavior and underlying market sentiment. These boundaries serve as a kind of navigational chart, mapping out where the stock has traveled over the past year and where it might be heading. While they may appear simple at first glance, these data points offer a nuanced snapshot of both current positioning and historical behavior that can shape future trading decisions.
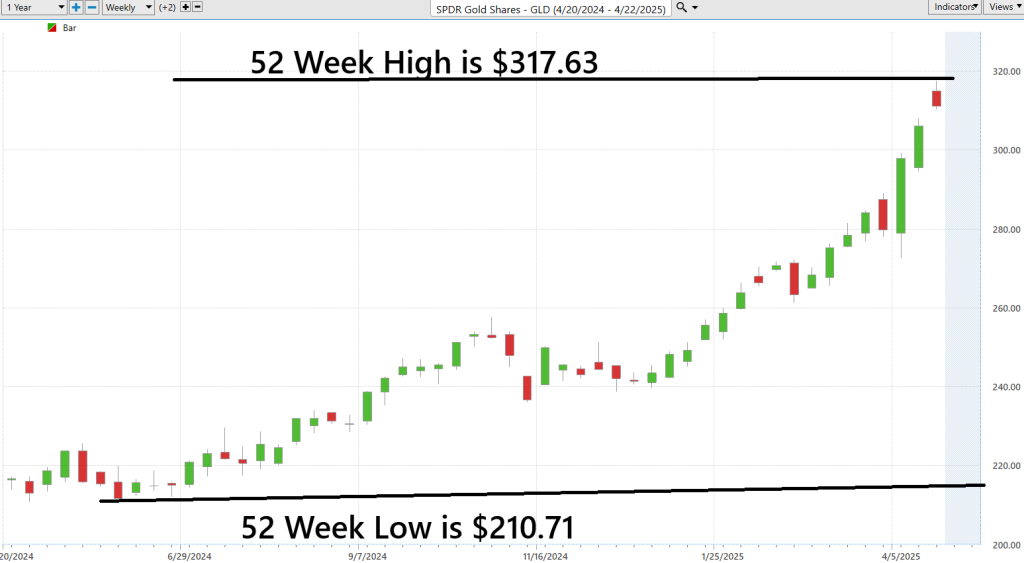
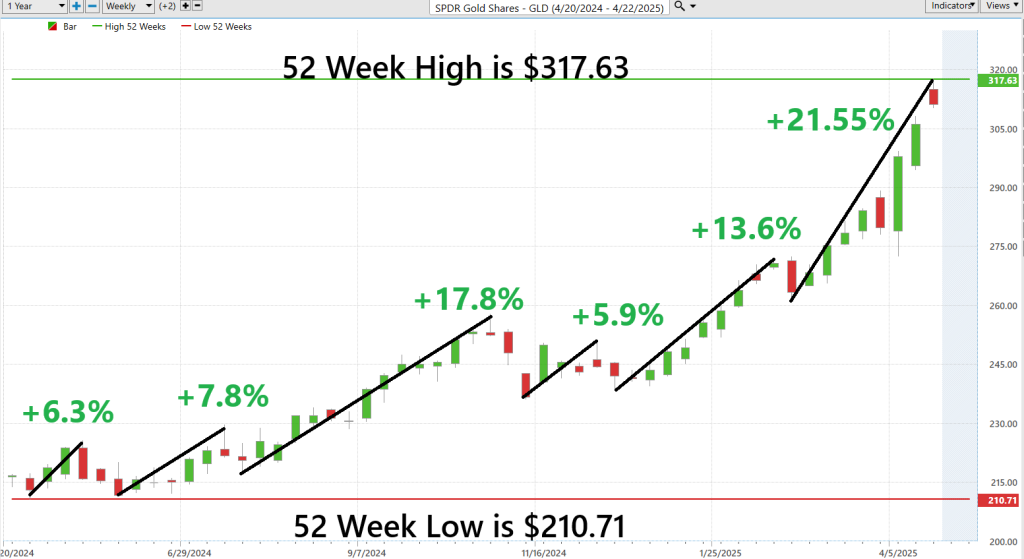
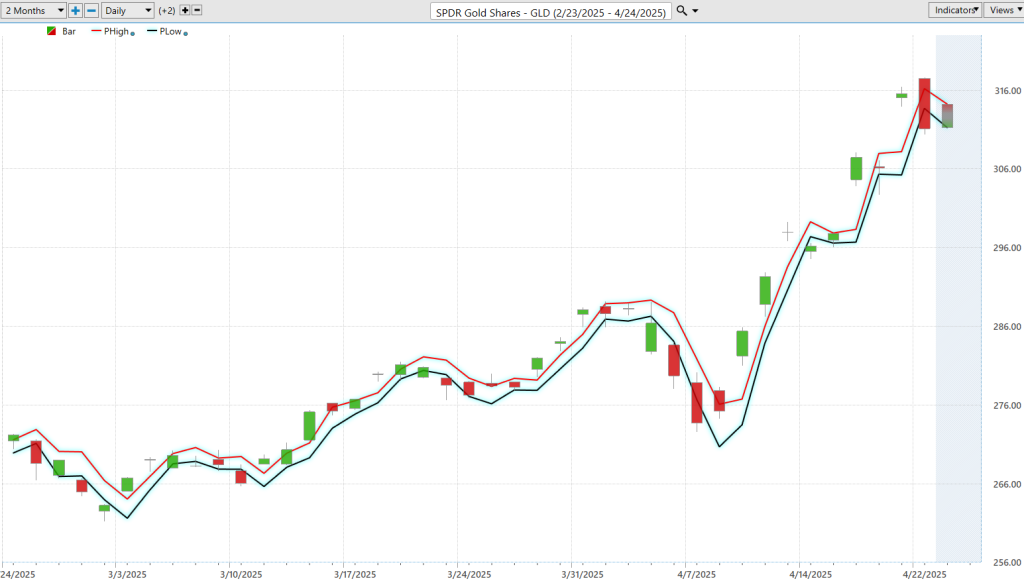
Here is a chart of $GLD over the last 52 weeks:
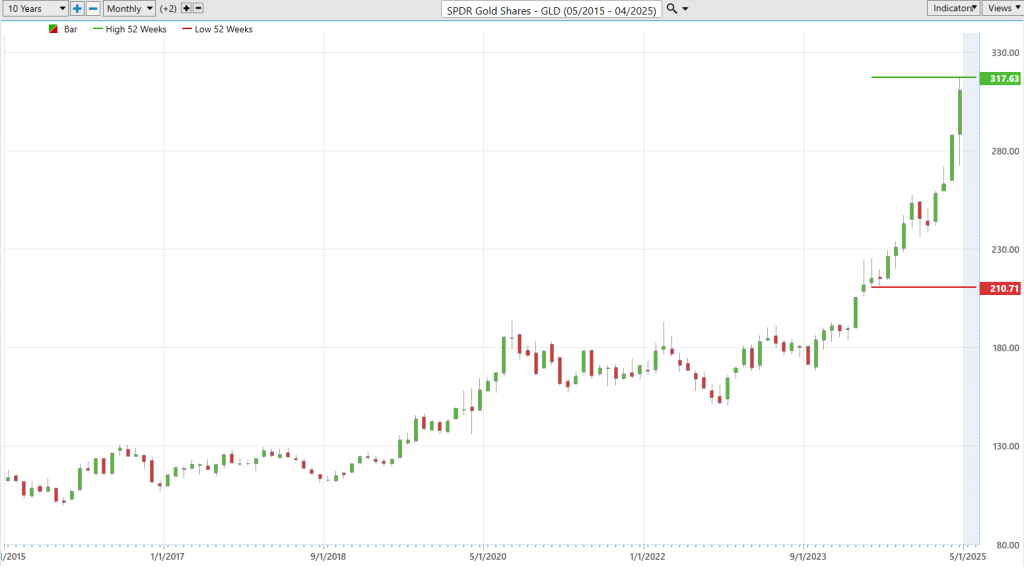
When we zoom out farther, we look at the 10-year monthly chart. What is fascinating about the 10-year chart is that $GLD has been making new 10-year highs for 10 of the last 12 months! One of our favorite all time trading setups is focusing and monitoring assets which are simultaneously making new 52-week highs and new 10-year highs. $GLD has been in this esteemed position for the past year.
Folks, let’s be clear—if you’re not paying attention to the 52-week high and low when trading, you’re flying blind in a market full of turbulence. Smart traders use this data to time their entries, tighten up their exits, and, most importantly, manage risk when the market gets wild. In today’s unpredictable environment, you need every edge you can get—and the 52-week range is one of the sharpest tools in the box.
Best-Case/Worst-Case Analysis
When entering the intricate, high-stakes world of trading, understanding volatility isn’t merely useful, it’s essential. It serves not just as a tool, but as a strategic compass guiding every decision a trader makes in an environment where opportunity and risk are inseparably intertwined. In a market where headlines can drive intraday swings and sentiment turns on a dime, recognizing volatility is about more than measuring motion — it’s about interpreting meaning.
Every stock carries a unique signature of behavior. Its largest gains and sharpest losses over the past year aren’t just statistics, they are reflections of conviction, fear, exuberance, and retreat. These price swings tell a deeper story: how investors have responded to news, economic shifts, and company fundamentals. Volatility, then, becomes a window into market psychology, not just a measure of how far a stock can move, but why it moved and who was behind it.
By isolating the largest uninterrupted rallies and drawdowns, traders begin to see the stock’s character emerge — when momentum took over, when buyers piled in, or when sellers rushed for the exits. These are the moments of truth, unfiltered by noise or reversion. Understanding these inflection points enables investors to set expectations for what the stock is capable of during periods of stress or euphoria.
Risk, of course, is the other side of that coin. A stock that can rise 20% in a week can just as easily fall by that amount, and prudent capital allocation becomes the balancing act. Volatility informs position size, stop loss levels, and trade duration. It shapes the margin of error you’re willing to accept. And in the most volatile corners of the market, it demands discipline — a kind of humility in the face of the unknown.
Ultimately, this is where technical meets behavioral. Behind every chart lies a crowd of decision-makers — investors responding to narratives, reacting to uncertainty, and recalibrating expectations in real-time. By understanding volatility, traders decode sentiment. They read the market’s pulse. And in doing so, they gain the ability to anticipate the next chapter, not merely recount the last.
First, we measure the largest uninterrupted rallies:
Followed by the worst-case scenario where we measure the largest uninterrupted declines.
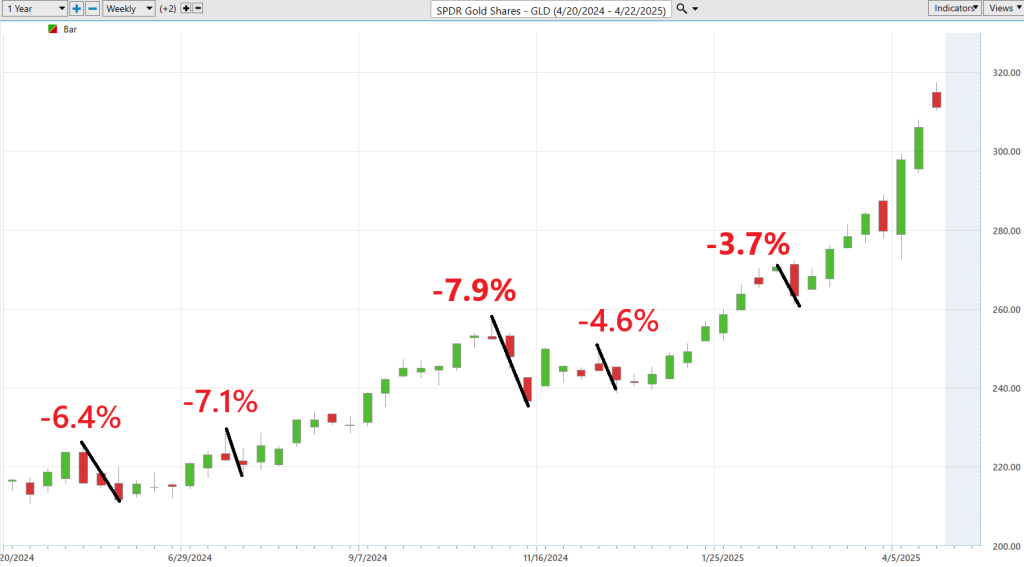
The declines have been incredibly mild in comparison to the rallies. The Bulls have clearly been in control.
Next, we compare how $GLD has done in comparison to the broader stock market indexes.
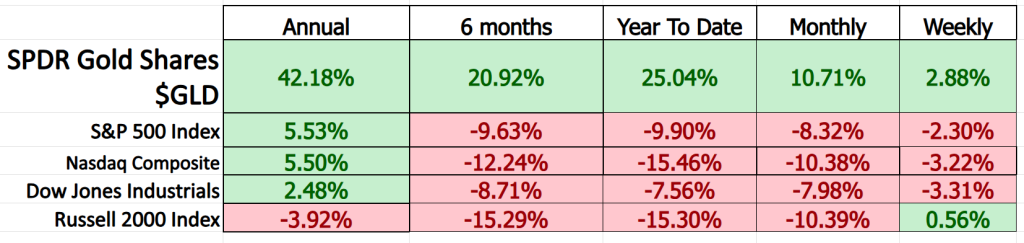
From this simple and practical analysis, we can see that $GLD has massively outperformed the broader indexes across all time frames.
The SPDR Gold Shares ETF (ticker: $GLD) has a beta of approximately 0.17 over a five-year period.
Beta is a measure of how much an investment moves in relation to the overall market. A beta of 1 means the investment moves exactly with the market. A beta less than 1 indicates the investment is less volatile than the market, while a beta greater than 1 means it’s more volatile. So, with a beta of 0.17, $GLD tends to move much less than the market does.
$GLD has a very low correlation of about 0.06 to the S&P 500 Index. This means that the price movements of $GLD and the S&P 500 are largely independent of each other. In practical terms, when the S&P 500 goes up or down, $GLD doesn’t necessarily follow the same pattern. This low correlation makes $GLD a useful tool for diversifying a portfolio, as it can help reduce overall risk by not moving in tandem with the stock market.
Vantagepoint A.I. Predictive Blue Line
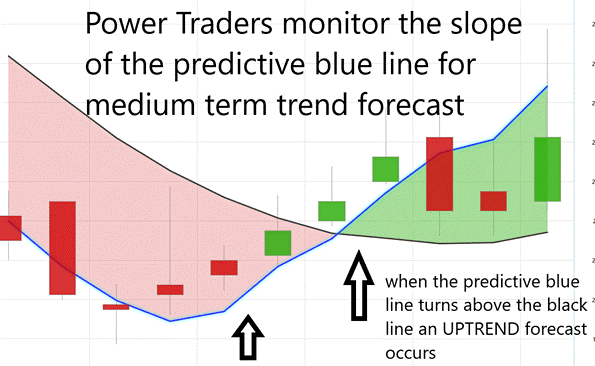
If you’re stepping into a trade with $GLD, understand this upfront: precision matters more than instinct. This isn’t a roulette wheel — it’s a calculated environment where data speaks louder than gut feelings. And in today’s market, where volatility is the norm and narratives change by the hour, relying on discipline and smart tools isn’t just prudent — it’s essential. That’s where VantagePoint’s Predictive Blue Line enters the conversation, not as a gimmick, but as a serious strategic tool built on the backbone of artificial intelligence.
Unlike traditional indicators, the Predictive Blue Line isn’t lagging — it’s forward-looking. It behaves less like a static chart overlay and more like a signal tower. When the line trends upward, it’s often a cue that momentum is accelerating — a signal for traders to lean in. But when it rolls over or starts to decline, it doesn’t whisper — it shouts. It’s a red flag, a call to re-evaluate your positioning before the market makes the decision for you.
There’s a nuance to this approach that seasoned traders will recognize — something often referred to as the Value Zone. If $GLD is climbing and pulls back just beneath the Predictive Blue Line, that’s frequently a high-probability entry. It’s not magic; it’s mean reversion with a pulse. But if the stock is in decline and suddenly climbs above the line? That might not be strength — it could be a setup for exit. These moments are not just technical checkpoints — they’re decision-making thresholds where discipline becomes opportunity.
And if the line breaks sharply downward? That’s your cue to stop, zoom out, and engage your risk management playbook. Whether it’s reducing exposure or deploying hedging strategies, this isn’t the time to hope — it’s the time to act with clarity. Winning in this game doesn’t require heroism. It demands awareness, speed, and the willingness to adapt before the rest of the market catches on.
VantagePoint’s A.I. does more than crunch data — it translates market behavior into usable intelligence. In a landscape saturated with noise, that kind of clarity is invaluable. For traders watching $GLD, the Predictive Blue Line isn’t optional — it’s a distinct edge. And over the last three months, it’s done what most can’t: deliver three spot-on trend forecasts. In a business where outcomes matter, that kind of accuracy isn’t just impressive — it’s actionable.
Neural Network Forecast (Machine Learning)
Alright, let’s cut through the techy fluff and talk trader-to-trader. A neural network? It’s not some sci-fi gadget—it’s A.I. with fangs. Picture a relentless, caffeine-fueled algorithm that eats data for breakfast, lunch, and dinner. It doesn’t nap, it doesn’t flinch, and it sure as hell doesn’t care what some talking head on CNBC is babbling about. This machine devours everything from price action to volume spikes and volatility tremors, figures out the patterns even your favorite chart setup can’t see, and fires back with predictions that hit like a sniper round. It doesn’t think like us—it learns. Constantly. Every market twitch becomes fuel for sharper, faster, and more lethal forecasts.
Now take that concept, crank it to eleven, and you’ve got VantagePoint’s A.I. Neural Network. This beast is trained to anticipate market direction 48 to 72 hours in advance. And I’m not talking about some back-tested, curve-fit fantasy world. I’m talking about real-time intelligence that adapts faster than a scalper on a caffeine binge. It’s like arming your trading strategy with a guided missile system—while the rest of the crowd is stuck playing pin the tail on the donkey with moving averages and stale indicators. The Predictive Blue Line? That’s the war paint. And when $GLD hits the Value Zone with that line rising, it’s not guesswork. It’s precision engineering with a neural brain running the ops behind the scenes.
So here’s the cold, hard truth: if you’re still trading on gut feel, lagging indicators, or praying for Fed guidance—you’re food. Traders who plug into neural network tech like this are running laps around you. They’re not reacting to the market—they’re anticipating it. They’re not trading with hope—they’re trading with math. Smart money’s already using it. Dumb money’s already losing to it. And you? You’ve got a decision to make. Plug into the future, or get left behind. Your move.

VantagePoint A.I. Daily Range Forecast
If you’re still trading like it’s 2010, you’re already toast. The game has changed, and real-time A.I. systems that chew through mountains of market data in seconds flat? That’s not a luxury anymore—it’s the price of admission. We’re talking about a full-blown shift from guesswork to cold-blooded precision. The kind of edge that used to be science fiction—spotting patterns, sniffing out momentum, and forecasting moves before they happen—is now what the smart traders are using to eat everyone else’s lunch.
Here’s the new reality: the traders who are still waiting for the market to slap them in the face are already behind. The ones using predictive A.I. tools? They’re not reacting—they’re positioned and ready before the move even hits. This isn’t about hope or gut feelings anymore. It’s about stacking the odds in your favor with a strategy built on data, discipline, and dead-on timing. You plug in, you prep, you pounce.
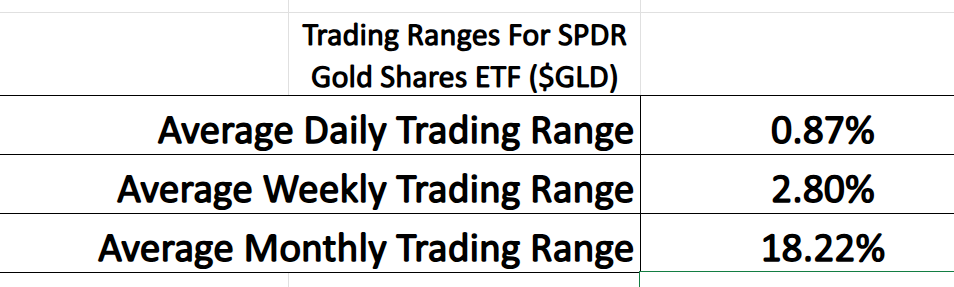
Now take a hard look at $GLD, one of the most liquid ways to play the yellow metal. Run the data across daily, weekly, and monthly charts over the last 12 months and the story’s clear as day: $GLD gives you tradable swings—real movement you can sink your teeth into. For traders who know what they’re doing, this isn’t just a safe haven—it’s a cash-producing machine waiting to be tapped. But only if you’re geared up with the right tools and not swinging blindfolded.
Here are the average daily, weekly and monthly trading ranges for $GLD over the past 12 months.
If you’re a short-term trader, allow me to share something extraordinary — a secret so powerful, so quietly effective, it’s been helping the most elite traders stay ten steps ahead while the rest are still reacting to yesterday’s news. Here’s the truth: every price move is a window of opportunity. The bigger the swing, the bigger the potential gain — if you know how to catch it at the right moment. Sadly, most traders are stuck playing catch-up, acting after the move has already happened. But the masters? They don’t chase opportunity — they prepare for it. They enter with precision, and they exit with purpose.
Enter VantagePoint’s A.I. software — a marvel of modern trading intelligence. This isn’t just another technical indicator. It’s a predictive powerhouse built on neural networks that forecast tomorrow’s price action with uncanny accuracy. While others are still digesting what happened yesterday, you’ll have a front-row seat to what’s likely coming next. It’s not magic. It’s machine learning, trained to decode the language of the market and turn complex data into simple, actionable insights — before the bell even rings.
Imagine having this edge in your corner — a quiet, relentless engine of foresight working 24/7, handing you a customized roadmap through the chaos. It’s the tool your competition prays you never find. But now you have. And used wisely, it won’t just improve your trades — it could transform your entire trading career. In a world where milliseconds matter and noise is everywhere, clarity is king. And this, my friend, is the royal crown.
Observe how clearly the anticipated trading range is each and every trading day.
Intermarket Analysis
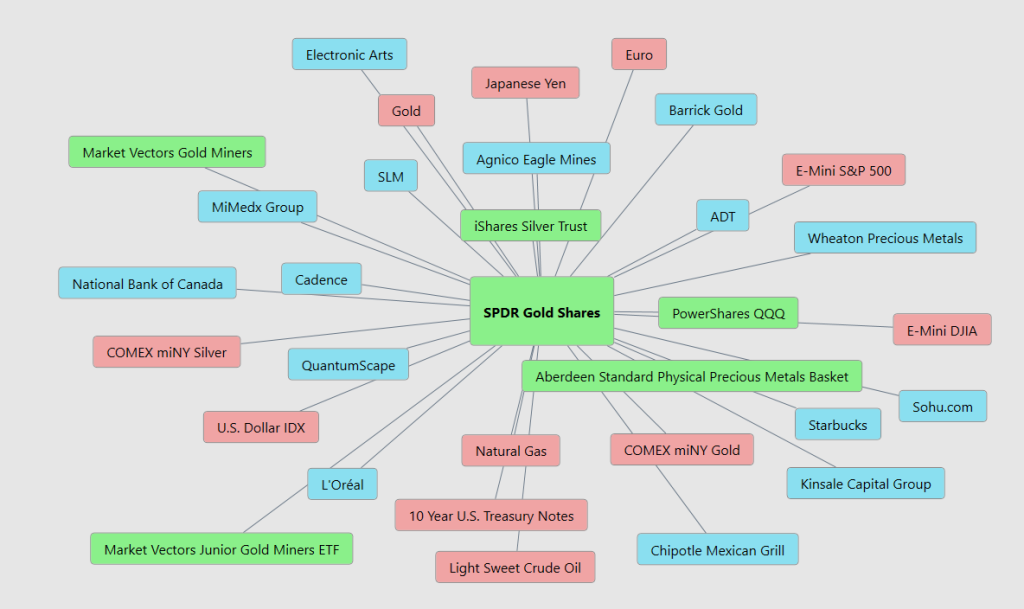
If you’re watching $GLD and trying to figure out what makes it move, you’ve gotta toss the technical voodoo for a second and step into the big leagues—intermarket analysis. This is where the real players operate. See, gold doesn’t move in a vacuum. It’s caught in a tug-of-war between the U.S. dollar, interest rates, inflation expectations, and a bunch of central bankers pretending they’re in control.
Let’s start with the U.S. dollar. When it gets strong, gold takes a hit. Why? Because gold is priced in dollars, and a strong buck makes gold more expensive for the rest of the world. Flip that around—if the dollar starts to crack, gold usually takes off like a rocket. Then there’s real interest rates. These are the secret sauce—when they drop, gold shines. Why? Because gold doesn’t pay you squat to hold it, so when real yields sink, there’s no opportunity cost to parking your money in gold. Now toss in inflation—the hotter it gets, the more people pile into gold to protect their purchasing power. And when the stock market starts bleeding and the VIX goes vertical, guess where the smart money runs? That’s right—gold. Finally, keep an eye on the big dogs—central banks. When they’re buying gold with both hands, you better believe they know something the average investor doesn’t.
So yeah, $GLD isn’t just another chart. It’s a battlefield. And if you’re not tracking the whole intermarket war—the dollar, yields, inflation, volatility, and central banks—you’re trading blind. Want to trade gold like a pro? Then start thinking like one.
Here are the top 31 drivers of $GLD.
Our Suggestion
Since the beginning of the year, SPDR Gold Shares ($GLD) hasn’t just moved—it’s made a statement, climbing 23% on the back of safe-haven demand, central bank accumulation, and surging interest from traders who recognize gold’s role in today’s shaky economic backdrop. While most investors were glued to tech headlines or speculating on the next rate cut, the pros—those who know the real story is often hiding in plain sight—were quietly using A.I.-powered daily range forecasts to buy weakness in a still-strengthening trend.
This is exactly the kind of opportunity that slips by the average investor… but not by seasoned power traders.
Because $GLD didn’t just outperform—it crushed the broader market. While the S&P 500 lost 8% gain, and rate-sensitive sectors shuffled sideways, $GLD delivered a scorching return near 23%. That’s not a fluke. That’s fear, inflation hedging, and institutional demand all converging in one trade.
And here’s the kicker: seasonal probabilities suggest this golden run may have much more room to go. When smart money, technicals, and machine learning all line up—you don’t get opportunities, you get windfalls.
Put $GLD front and center on your radar. It’s likely to throw off multiple, repeatable opportunities in months to come.
Let’s be careful out there.
It’s not magic.
It’s machine learning.
Disclaimer: THERE IS A HIGH DEGREE OF RISK INVOLVED IN TRADING. IT IS NOT PRUDENT OR ADVISABLE TO MAKE TRADING DECISIONS THAT ARE BEYOND YOUR FINANCIAL MEANS OR INVOLVE TRADING CAPITAL THAT YOU ARE NOT WILLING AND CAPABLE OF LOSING.
VANTAGEPOINT’S MARKETING CAMPAIGNS, OF ANY KIND, DO NOT CONSTITUTE TRADING ADVICE OR AN ENDORSEMENT OR RECOMMENDATION BY VANTAGEPOINT AI OR ANY ASSOCIATED AFFILIATES OF ANY TRADING METHODS, PROGRAMS, SYSTEMS OR ROUTINES. VANTAGEPOINT’S PERSONNEL ARE NOT LICENSED BROKERS OR ADVISORS AND DO NOT OFFER TRADING ADVICE.


