


| This Week’s a.i. Asset Spotlight is Gold |
Long time readers of this blog know I consider Gold to be an essential indicator of economic health and a report card on our monetary authorities. If you spend any time at all researching the opinions of “experts” in the gold market, you will quickly understand that Gold is hated a great deal by those closely connected to the money printer. What I find fascinating about gold’s performance is when Gold outperforms the broader stock market indexes the talking heads in the media ignore it.
When Gold significantly outperforms broader stock market indexes, it often acts as a “canary in the coal mine,” signaling potential economic or financial instability. Traditionally, gold is regarded as a hedge against inflation and a safe haven in times of crisis. Therefore, its outperformance can indicate investors’ concerns about rising inflation, currency devaluation, and geopolitical tensions. This shift towards Gold may suggest investors are moving away from traditional assets like stocks due to fears of a downturn or increased market volatility. In essence, a surge in Gold prices might be a warning of underlying issues in the economy or global markets that could not yet be fully recognized or reflected in other asset classes.
Here are two charts worthy of your consideration. The first is a comparison of Gold versus the S&P 500 over the last 52 weeks.

The second chart is a comparison of Gold versus the S&P 500 year to date in 2024.

I find this to be both fascinating and of great concern.
Gold used to be considered money. When what used to be money performs better than the top 500 companies it would probably empower you a great deal to try and understand what is making both numbers go up.
Here’s what’s happening with Gold these days, and it’s quite the story, perfect for anyone wanting a simple breakdown. Central banks around the world, especially in countries that are still growing and developing, are buying a lot of Gold—more than we’ve seen in a long time. In fact, in 2022 and 2023, they bought so much that they accounted for about one-fourth of all the Gold bought worldwide each year. Market participants would be smart to ponder why are CENTRAL BANKS running to Gold? What do they know that I should know?
Even with some challenges like higher interest rates and a strong US dollar, which usually make gold less attractive, these banks kept buying heavily. They continued this trend into the first quarter of 2024, purchasing even more gold than before, making it the biggest gold-buying spree we’ve seen since the year 2000.

A lot of this Gold buying is happening in Asia, with China leading the charge. The People’s Bank of China has been adding Gold to its reserves for 17 straight months now, which is their longest streak ever. Meanwhile, the Reserve Bank of India and other central banks in places like Kazakhstan and Singapore are also adding to their Gold piles.
Even some European and Middle Eastern banks are getting in on the action, adding more Gold to their reserves. And the Central Bank of Turkey? They’ve been buying gold for ten straight months, despite high demand and tight supplies at home.

So, what does all this mean? Well, it shows that these banks are really betting on Gold, maybe as a safe way to protect against economic uncertainty or as a hedge against other financial risks. It’s like they’re preparing for a rainy day, making sure they have plenty of gold stored away just in case.
The question I ask when I confront this information is how can you have a strong and resilient economy when the monetary authorities who manage the economy are buying crisis hedges at record amounts?
My favorite history teacher in school always said that your understanding of history will change dramatically depending on the starting and ending points of your analysis. For this reason, I will focus on multiple different time frames in this analysis of Gold. My conviction tells me that what is occurring in the world is massive currency devaluation amongst all nations. Price is always a ratio of exchange. The statement “price is a ratio of exchange” highlights that price represents the amount of one thing (usually currency) that someone is willing to exchange for something else, like a product or service. In this way, price quantifies how much one item is worth in terms of another. Essentially, it establishes the terms of trade between two parties.
In the grand scheme of economic shifts, the story of currency debasement is as old as money itself.

Consider the formula (x/$): a straightforward representation of how the value of a commodity or asset, x, is affected by the value of the dollar, $. When the mighty dollar depreciates—say, it loses 10% of its value—the immediate reaction isn’t just in your wallet; it’s in the perceived value of everything priced in those dollars. Essentially, if the dollar weakens, the amount of dollars needed to purchase the same commodity isn’t just a straight swap; it increases, because each dollar is worth less than before. It’s not that the intrinsic value of the commodity has changed, but rather, the value of the measuring stick (the dollar) has shrunk.
This phenomenon isn’t merely an economic curiosity; it’s a pivotal dynamic in investment/trading strategies and everyday purchasing decisions. If you’re holding assets priced in dollars when the dollar takes a hit, the nominal value of those assets needs to rise just to maintain their real value. It’s not just about prices going up; it’s about value retention in a landscape where the baseline—our dollar—keeps shifting. This isn’t inflation in the traditional sense, where prices rise due to increased costs or demand, but a direct outcome of the dollar’s diminished purchasing power. Understanding this concept is crucial for anyone looking to preserve their wealth in times of currency fluctuation, making it a cornerstone of savvy financial planning and investment.
Gold has long been seen as a reliable way to keep your wealth safe, especially when money matters get tough. Think of gold as a kind of financial safety net that has stood the test of time, helping people keep their purchasing power even when the economy takes a nosedive. Unlike modern paper money, which can lose its value because of things like inflation or economic decisions made by governments, gold’s worth doesn’t depend on these factors. This makes it a strong choice for saving money in a way that won’t diminish over time.
Investing in Gold is smart for several reasons. First, it’s a great protection against inflation, which is when prices go up and the value of money goes down. When everything else starts to cost more, the price of Gold usually goes up too. It’s also useful for diversifying your investments, meaning if you put your money in different kinds of assets, gold can be the stable part if the stock market gets shaky. Moreover, gold is a physical thing you can hold, unlike stocks and bonds, which are just pieces of paper that promise value. People all around the world recognize Gold’s value, so you can sell it anywhere, making it a handy asset to have in uncertain times. Essentially, gold is like a financial anchor, keeping your wealth steady through storms in the economy.
In this A.I. asset spotlight we will look at and examine the following indicators to try and develop a thorough understanding of what is driving the gold market higher and how traders can take advantage of it.
1. 52-week high and low boundaries
2. Evaluating Golds Performance Against FIAT Currencies
3. The Best Case – Worst Case Scenarios
4. The VantagePoint A.I. Triple Cross Analysis
5. Neural Network Forecast
6. Seasonal Analysis
7. Intermarket Analysis
9. Our Trading Suggestion
52-week High and Low Boundaries
For traders navigating the high seas of the market, understanding the 52-week boundaries—both highs and lows—of any asset is crucial. This range isn’t just a set of arbitrary markers; it provides a clear window into the asset’s performance over a substantial period, offering insights into both resilience and volatility. An asset hitting or breaking past a 52-week high is particularly noteworthy. It’s a beacon, signaling that something is going right, whether it’s strong company fundamentals, sector growth, or broader economic factors. These highs paint a picture of winning, of potential continued momentum that could lead to greater gains. However, wise traders know this isn’t just a call to buy indiscriminately; it’s a call to pay attention and conduct deeper analysis.

What we always draw traders’ attention to is the variance between the high and the low prices for the past year and express that as a percentage of the current price. Right now, that variance is $714.14. The Gold market, based upon its historical volatility is telling us that statistically it would be completely normal for the price range for the next year to be $714 higher and or lower.
First impression: does this chart look like a bull or a bear?

Now, placing these ‘winners’ on your radar doesn’t mean you rush to open your wallet. Instead, this is where the art of strategic evaluation comes into play. Traders must delve into why an asset is outperforming and scrutinize the sustainability of its upward trajectory. Is the rise driven by actual growth and solid metrics, or is it inflated by fleeting trends or speculative fervor? The savvy trader looks beyond the immediate glitter of new highs to understand the underlying dynamics. Such a thorough approach allows traders to make informed decisions, potentially capitalizing on these high-flying assets before they become mainstream picks or steering clear if they detect overheating. This proactive monitoring and analysis serve as the cornerstone of a disciplined trading strategy, ensuring that one remains ready to act on opportunities while managing risk effectively.
Let’s get a longer-term perspective and zoom out to the 10-year monthly chart. Does this chart look bullish or bearish?

Evaluating Golds Performance Against FIAT Currencies
Fiat currency is a type of money that isn’t backed by a physical commodity like Gold or Silver, but rather by the trust and authority of the government that issues it. Unlike commodity-backed currencies, fiat money derives its value from the stability and creditworthiness of the government, not from an intrinsic worth of the material from which it is made. Essentially, fiat currencies are deemed legal tender by government decree, and their acceptance for the exchange of goods and services is mandated by law. This system allows for greater flexibility in economic management, as central banks can control the money supply to address economic issues such as inflation, unemployment, and recession through monetary policies.
The concept of fiat currency is not new and has been implemented in various forms throughout history. Historically, the longevity of fiat currencies has been horrible; almost all have failed due to hyperinflation or loss of public trust, typically surviving for about 27 years on average according to some economic studies. They exist primarily to provide governments with the ability to manage economies without the constraints posed by a fixed commodity reserve. The value of wealth stored in fiat money can be vulnerable to inflation and economic instability, making diversification essential for long-term wealth preservation.
I contend that the “number go up” theme that we are seeing in grocery stores is identical to what is happening on financial exchanges around the world. Price is going up because currency value is being debased. I thought long and hard about how this could be proven or disproven. What I concluded is that I would show the performance of Gold priced in foreign currencies across multiple time frames and let the performance metrics speak for themselves.
What makes this analysis so damning for our monetary authorities is that if you look back at 21 years, we see Gold once again outperforming the broader stock market index. Keep in mind that over 80% of all hedge fund managers do not keep pace with the S&P 500 Index. What does it say about money and financial markets when what used to be money is performing better than the best investments on the stock exchange?

But let’s compare Gold to staying in cash of any of the following fiat currencies and time frames.

It’s hard to not see Gold is increasing because the value of fiat is going down.
Gold has historically stood as a bastion of stability in a financial landscape frequently rattled by the volatility of fiat currencies, which are prone to devaluation through inflation and economic policy shifts. As governments print more money, the purchasing power of fiat currency inevitably diminishes, compelling savvy investors to turn to gold. This precious metal not only retains its value over time but often appreciates during periods of economic uncertainty when traditional paper assets like stocks and bonds can falter. By offering a tangible asset that remains largely impervious to governmental control and the whims of economic cycles, Gold represents a critical hedge against the erosion of wealth, ensuring that investors can protect and even enhance their financial security amidst the ebb and flow of global economies.
In the throes of a resurgent gold market, often hailed as the purest form of money, we are witnessing a stark reflection of the dire economic conditions, rampant inflation, and the disturbing fiscal irresponsibility of the U.S. government. The catalyst for the meteoric rise in gold prices? Look no further than the escalating geopolitical tensions, particularly highlighted by Iran’s aggressive response to Israel, a retaliation rooted in an earlier skirmish on its diplomatic soil in Syria. Additionally, there’s a pronounced trend among foreign central banks to pivot their reserves from U.S. dollars to Gold, strategically shielding their wealth from the looming threats of international sanctions and asset seizures.
From my perspective, the sharp uptick in Gold demand among consumers is fueled by a growing realization that the Federal Reserve is grappling with inflation control and is stuck in a prolonged effort to suppress interest rates. The Fed, it seems, is ensnared in a vicious cycle, compelled to print trillions of dollars annually which exacerbates inflation, while also purchasing vast amounts of Treasuries to prevent interest rates from spiraling out of control. This predicament results in declining real interest rates, where nominal rates fail to keep pace with inflation, a desperate maneuver to alleviate the financial fragility of the U.S. government. Under such conditions, Gold typically thrives.
When you look at the latest Consumer Price Index, which reports a relatively tame annual inflation rate of 2.9%, it hardly reflects the reality I see. When I’m out shopping for groceries, the prices I encounter mirror the surge in gold’s market value far more accurately—gold itself has climbed 30.6% year-to-date. My experience at the grocery store aligns far more closely with the price movement of gold than with the CPI’s figures.
It’s almost inconceivable to think that the United States could find itself in this predicament. Yet, who would have thought two decades ago that we’d be witnessing the federal government running trillion-dollar deficits, largely financed by the Fed’s monetary policies? It appears that Washington D.C. continues to drive our once robust economy from one crisis to the next, perpetually kicking the fiscal can down the road. The investment landscape is rapidly changing, suggesting that traditional buy-and-hold strategies might need serious recalibration to align with these evolving economic realities.
Best-Case/Worst Case Analysis
Every trader, from the seasoned giants of Wall Street to those just stepping into the fray, must anchor their strategy in a solid understanding of risk and reward to steer through the turbulent waters of the markets successfully. A method I find incredibly insightful, which I refer to as the “Feast or Famine” analysis, offers a clear framework to assess this dynamic. This technique involves a review of an asset’s performance over the last year, highlighting the peaks of its rallies and the troughs of its declines. This approach moves beyond mere numerical analysis; it’s a hands-on practical exercise that educates traders about typical market movements and the inherent volatility, cultivating a grounded perspective on risk.
First off, we assume that we were lucky to buy the lows and sell the highs. This is an assumption. All that we are doing is measuring the magnitude of the weekly rallies.

Next, we assume the inverse and assume that we bought the highs and sold the lows. Our purpose once again is simply to measure the magnitude of the declines.

By dissecting the highest highs and lowest lows of market performance over a year, you glean vital insights into the possible rewards and risks associated with your trades.
Regardless of how you slice it the declines were extremely mild in comparison to the rallies. What we can learn from this is that if the future is anything like the recent past, we should pay very close attention to mild declines and utilize the a.i. for guidance in those situations.
Consider it a way to light up your path through the financial landscape, preparing you for any surprises that might come your way. This method transcends smart investing; it’s about devising a strategy that resonates with your financial goals and risk tolerance, ensuring that your decisions are not just reactive but are fortified by a deep understanding of historical market behaviors.
Next, we compare the performance of Gold to the broader stock market indexes across multiple times frames to compare volatility and ROI.

Gold is clearly outperforming across all time frames.
Lastly, we dig in and do a comparison analysis of the top gold mining companies in the world.

What we always want to see in looking at the mining companies is they are outperforming Gold in a real bull market.
Vantagepoint A.I. Triple Cross Forecast

In the trading world, especially for an asset like Gold ($GC), understanding trends is crucial. This is where the concept of the “triple cross” comes into play, a tool that helps traders forecast the future direction of trends.
The VantagePoint A.I. Triple Cross indicator represents a revolutionary approach in the trading world, employing not just two, but three predictive moving averages—covering the 3-day, 8-day, and 18-day periods, each tailored for short-term, medium-term, and long-term market movements. This trio of moving averages offers traders early warnings and solid confirmations of legitimate trend signals. It’s a sophisticated system designed to provide clear, timely insights into market trends.
The elegance of the Triple Crossover strategy lies in its disciplined approach. It avoids the rush to trade, instead meticulously waiting for each of the three predictive averages to confirm the others’ movements. Think of the initial crossover between the short-term and medium-term averages as a signal flare, indicating a potential shift in market direction. Then, when the medium-term average crosses the long-term, it acts as the confirmation needed to greenlight a trade. This methodical verification process not only heightens the reliability of entering or exiting a position but also significantly reduces the chances of being misled by market noise or temporary fluctuations.
Incorporating predictive data into this trading strategy is akin to having an expert mentor by your side around the clock, guiding every decision with advanced foresight. This reduces the often-costly time lag between real-world events and market reactions, helping shield traders from premature entries and the pitfalls of erratic market behavior.

In summary, the Triple Crossover doesn’t just alert you to changes in the market—it confirms them with a robust, three-step verification process, acting as your personal trading sentinel. This strategy is like a finely tuned filter, sifting out the noise and focusing on securing fewer, but far more reliable, trading opportunities. It’s a premier tool for those looking to refine their trading approach with precision and insight, ultimately leading to smarter, more effective market engagements.
VantagePoint’s A.I. Neural Index Forecast (Machine Learning)
Imagine a very advanced calculator that not only does math but also learns from new information to make better predictions. These networks are designed to mimic the way human brains work, learning from past experiences to improve over time. In trading, neural networks look at tons of data from the past, like stock prices and market trends, to figure out patterns that might tell what will happen next in the market.
Constructing a neural network for trading involves setting it up to recognize important patterns in financial data. First, the network is “trained” using a lot of historical market data, where it learns from the outcomes of past market movements. It’s like teaching a dog new tricks by rewarding it when it does something right. For the neural network, the “right” thing is accurately predicting a stock’s future price based on its past. The network adjusts its internal settings each time it learns something new to get better at making predictions. This training process involves layers of nodes (which are like tiny processing points), and each layer helps refine the information more as it passes through.
In the chart below the Neural Index at the base of the chart. The Neural Index forecast is a 48–72-hour forecast. When it is green it is anticipating strength. When it turns red, it is anticipating weakness.

Once it’s fully trained, the neural network helps traders by providing recommendations based on its predictions. For example, it might suggest buying a particular stock because its patterns show that the price is likely to go up. It’s like having a super-smart assistant that’s good at spotting trends from complex data which humans might not easily see. This can be incredibly helpful because it supports traders in making quick, informed decisions in a fast-paced market. By using neural networks, traders can manage their risks better and spot opportunities they might otherwise miss, making their trading strategies more effective.
Seasonal Analysis
Seasonal analysis is a method used by traders to evaluate trends and patterns that tend to occur at specific times of the year. For example, some stocks might go up during the holiday season due to increased sales, while others might dip during the summer. This analysis helps traders predict these patterns based on past performances during the same seasons in previous years. Seasonal studies to be valid look at decades worth of data to assimilate statistical trends and probabilities.
Calculating seasonal analysis involves looking at historical data over several years to identify if there are consistent movements in the market or specific securities during months or quarters. Traders use statistical tools to average the performance of a stock during a specific period and compare it across multiple years to see if a pattern emerges consistently. For instance, if a stock tends to rise in December for several years, a trader might anticipate a similar rise in the next December.
Seasonal analysis can provide valuable insights but comes with risks. Its validity depends heavily on consistent historical patterns, but past performance is not always a reliable indicator of future results. Markets can be influenced by many unpredictable factors like economic changes, political events, or technological advancements that might disrupt historical patterns. Therefore, relying solely on seasonal analysis can be risky if those patterns suddenly change due to new market conditions.
It’s important for traders to use seasonal analysis in conjunction with other indicators. While seasonal trends can provide a general guideline, they should be confirmed with additional analyses such as technical indicators. This combination helps validate the predictions made based on seasonal patterns and reduces the risk of making decisions based solely on historical trends that may no longer be applicable.
Traders use seasonal analysis because it helps them to anticipate and strategize recurring trends in the market. It’s a tool that can enhance decision-making by providing a historical context to price movements. Especially in commodities trading or sectors like retail, which are heavily influenced by seasonal factors (like weather or holidays), this type of analysis can be particularly effective. By understanding these patterns, traders can time their trades more effectively, potentially leading to better returns by capitalizing on predictable fluctuations in market prices.
Here is the seasonal analysis in Gold. The idea here is to be forewarned when a strong seasonal tendency for lower prices is forecasted. This traditionally occurs in Gold between December 25th and February 24th, the seasonal tendency is for Gold to fall on average 2.98%.

Our Suggestion
How long have you been paying attention to financial news? I ask that question because, in my lifetime I could’ve never imagined the United States racking up trillions of dollars of new debt every single year. The national debt is over $35 trillion now, and we are increasing the debt by $1 trillion every 90 days. If you try to understand this reality you will quickly comprehend that the only solution is to debase the currency. The debt can never be paid back. It is a mathematical impossibility.
Let me do a little basic math to demonstrate this.
As of mid-2024, approximately 161 million people are employed in the United States. This figure includes both full-time and part-time workers across various industries. The U.S. Debt stands at $35 trillion and is growing at roughly 12% per year. It has grown by 50% since the pandemic in 2020.
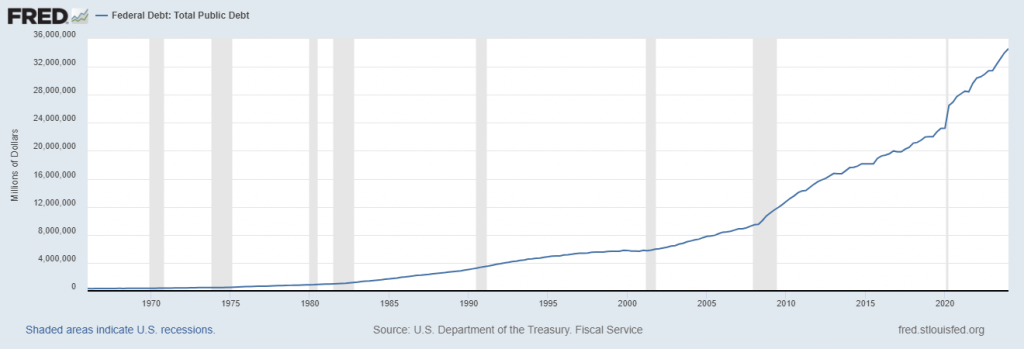
If you divide the total debt, by the total number of working Americans the debt per working American works out to be $217,391.30 per person. This is on top of whatever other debt they might be carrying. Suddenly that free lunch the government has been giving out for the last 50+ years got rather expensive, didn’t it?
The solution that governments always lean on historically in these instances is to print new money and debase the currency. As I pointed out earlier in this analysis, when you compare the performance of Gold to FIAT currencies all over the world, it is unquestionable that this has been occurring and will continue to occur. The only question is how you protect yourself from it.
Most people are unaware that this is how purchasing power is destroyed. It is a very bitter pill to swallow.
Nobel Laureate, Milton Friedman described the erosion of purchasing power through inflation with pointed clarity, emphasizing that inflation is fundamentally a monetary issue driven by excessive money supply. Friedman argued that when the government prints more money without an equivalent increase in goods and services, it devalues the currency. This leads to a situation where each dollar holds less value, reducing what individuals can buy with their money. This decline in purchasing power, Friedman asserted, is not just an economic inconvenience but a grave infringement on economic freedom. It acts as an insidious tax that diminishes the real earnings and savings of individuals, eroding their wealth without their consent. Thus, he’d stress the imperative for restrained monetary expansion to preserve the value of money and safeguard individual economic liberty.
We believe Gold is only beginning its ascent.
The potential in Gold shines even more when viewed beyond the confines of the dollar-centric lens.
We recommend leveraging A.I. forecasts for deeper trend analysis to validate this “golden” trading opportunity.
Always exercise prudent financial management in all your trading activities.
Let’s Be Careful Out There!
It’s Not Magic.
It’s Machine Learning.
Disclaimer: THERE IS A HIGH DEGREE OF RISK INVOLVED IN TRADING. IT IS NOT PRUDENT OR ADVISABLE TO MAKE TRADING DECISIONS THAT ARE BEYOND YOUR FINANCIAL MEANS OR INVOLVE TRADING CAPITAL THAT YOU ARE NOT WILLING AND CAPABLE OF LOSING.
VANTAGEPOINT’S MARKETING CAMPAIGNS, OF ANY KIND, DO NOT CONSTITUTE TRADING ADVICE OR AN ENDORSEMENT OR RECOMMENDATION BY VANTAGEPOINT AI OR ANY ASSOCIATED AFFILIATES OF ANY TRADING METHODS, PROGRAMS, SYSTEMS OR ROUTINES. VANTAGEPOINT’S PERSONNEL ARE NOT LICENSED BROKERS OR ADVISORS AND DO NOT OFFER TRADING ADVICE.


