


| This Week’s a.i. Stock Spotlight is McCormick and Company ($MKC) |
McCormick & Company ($MKC) is the global leader in spices, seasonings, and flavor solutions. Founded in 1889, McCormick has grown into a powerhouse, delivering a wide array of products that spice up kitchens and restaurants worldwide.
We have featured McCormick numerous times over the past few years and advised that traders put $MKC on their trading radar. Within the past two years most of the opportunities on $MKC have been on the downside as the company has been hit hard by inflationary pressures and supply chain concerns.
McCormick & Company owns and controls a variety of well-known brands, mostly in the seasoning, spice, and condiment categories. Some of the key brands they own, or control include:
1. McCormick: Their flagship brand, which offers a wide variety of spices, herbs, seasonings, and flavorings.
2. Frank’s RedHot: A popular hot sauce brand, often used for buffalo wings and spicy foods.
3. French’s: Known for its iconic yellow mustard and other condiments.
4. Lawry’s: Offers seasonings and marinades, particularly known for seasoned salt.
5. Old Bay: Famous for its unique seafood seasoning blend.
6. Zatarain’s: Specializes in Cajun and Creole flavors, including rice mixes, seasonings, and frozen meals.
7. Club House: A Canadian brand that focuses on spices, herbs, and baking products.
8. Schwartz: A UK-based brand offering spices, seasonings, and sauces.
9. Kühne: A European brand, known for pickles, vinegars, and sauces.
10. Stubb’s: Specializes in barbecue sauces, marinades, and rubs.
11. Simply Asia: Provides Asian-inspired spices, sauces, and meal kits.
12. Thai Kitchen: Offers a range of Thai food products, including sauces, pastes, and coconut milk.
McCormick generates revenue through two segments in their company:
Consumer Segment: This is the company’s largest segment, contributing to the majority of its revenue. It involves the direct sale of spices, seasonings, sauces, and condiments under the above brands to retailers and consumers. This segment has benefitted significantly from at-home cooking trends, with brands like Frank’s RedHot, French’s, and McCormick driving substantial sales.
Flavor Solutions Segment: This segment provides customized flavor solutions to the food industry, including food manufacturers and foodservice companies. This part of the business creates tailored seasonings, flavor systems, and culinary solutions for a range of industries, such as snacks, frozen foods, and restaurant chains.
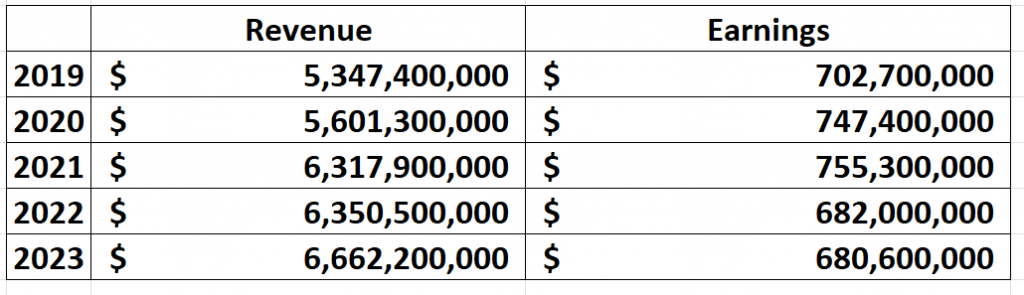
McCormick’s revenue was about $6.6 billion in 2023, with the consumer segment accounting for the majority, around 65-70% of total revenue, while the flavor solutions segment contributed 30-35%.
In my estimation the struggles the company is facing can be summarized very quickly by the following revenue and earnings analysis. Over the last 5 years $MKC has grown revenue 24.5%, but earnings over the same time frame have decreased 3.25%. Inflation has squeezed profit margins and while $MKC has tried to pass those costs on to the consumer, the consumer is purchasing less than pre-pandemic.
For 2024, McCormick & Company ($MKC) has set expectations for revenue and earnings that reflect both challenges and strategic initiatives. The company projects sales to range between a 2% decline and flat growth compared to 2023, which saw revenue of $6.66 billion. This implies that 2024 revenue could range from approximately $6.53 billion to $6.66 billion. The flat-to-declining sales outlook is influenced by pricing actions and ongoing economic pressures, including inflation and supply chain issues.
On the earnings front, McCormick forecasts earnings to increase 8%, compared to 2023. The company also anticipates operating income growth of 8% to 10%, driven by cost savings and margin improvements. Despite these positive earnings expectations, McCormick remains cautious about macroeconomic headwinds, particularly the impact of inflation and fluctuations in foreign currency.
Their consumer segment thrives on their strong brand portfolio, which allows them to maintain pricing power, while the flavor solutions segment taps into the global trend of food manufacturers outsourcing flavor innovations.
From the iconic red-capped spices you see in your pantry to seasonings used by global food companies, McCormick is everywhere flavor is found. They operate in two main divisions: Consumer (selling directly to people like you and me) and Flavor Solutions (working with large food manufacturers). With the stock trading at a high P/E ratio of 30.34, some analysts believe there might be limited upside from here.
On the financial side, McCormick’s consistent dividend payments keep investors smiling, offering a solid 2% yield backed by strong cash flow, even as earnings have taken a slight hit. But challenges loom. Rising costs due to inflation and ongoing supply chain issues are squeezing margins, though the company has kept profits stable by passing costs on to consumers. Internationally, growth in key markets like China has slowed, raising concerns about their global prospects. Despite these hurdles, McCormick has managed its debt well, with a manageable debt-to-equity ratio of 0.62. A debt-to-equity ratio of 0.62 means that for every dollar McCormick has from its owners (equity), it has 62 cents in debt. In simpler terms, McCormick is borrowing 62 cents for every dollar it already owns to fund its operations or grow the business. This ratio shows how much the company relies on borrowing versus using its own money. A ratio below 1, like 0.62, suggests that McCormick is using more of its own money than debt, which is generally a healthy sign for a company. It means they’re not overly dependent on loans or borrowing, which reduces risk.
Investors are keeping a close eye on whether the company can sustain its momentum amid these pressures. McCormick recently hit a new 52-week high at $84.14 per share, outperforming many of its food industry peers in 2024, with stock up over 16% year-to-date. Despite this strong performance, the company faces challenges related to high debt and inflationary pressures impacting both margins and consumer demand. McCormick & Company to Report 2024 Third Quarter Financial Results on October 1, 2024. Analysts expect continued cost pressures but a reaffirmation of McCormick’s fiscal year outlook. Global inflation and fluctuating commodity prices are a major worry for investors which could pressure margins.
McCormick is a solid, dividend-paying stock that has built a reputation on its strong brand and reliable profitability. But here’s the thing—its high valuation, combined with inflationary pressures, raises some serious red flags for future growth. While the company’s fundamentals are steady, the current price might be too spicy for some, especially given the challenges ahead.
In this weekly stock study, we will look at an analysis of the following indicators and metrics which are our guidelines which dictate our behavior in deciding whether to buy, sell or stand aside on a particular stock.
- Wall Street Analysts Ratings and Forecasts
- 52 Week High and Low Boundaries
- Best-Case/Worst-Case Analysis
- Vantagepoint A.I. Forecast (Predictive Blue Line)
- Neural Network Forecast (Machine Learning)
- VantagePoint A.I. Daily Range Forecast
- Intermarket Analysis
- Our Suggestion
While we make all our decisions based upon the artificial intelligence forecasts, we do look at the fundamentals briefly, just to understand the financial landscape that $MKC is operating in.
Wall Street Analysts Ratings and Forecasts
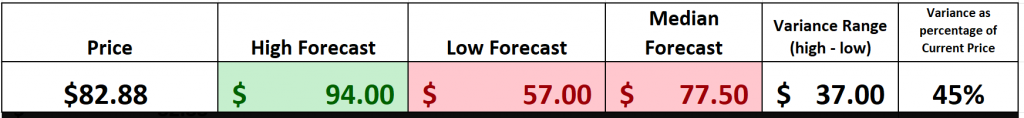
McCormick & Co (NYSE: MKC) has a consensus price target of $77.50 based on ratings from 16 analysts. Price predictions range from $94 on the high end, provided by Exane BNP Paribas, to a more conservative $57 on the low end, forecast by JP Morgan as of January 2024. With this spread, analysts remain divided on the stock’s short-term outlook, but most suggest it’s sitting closer to the middle of these extremes. Investors should weigh these targets carefully, especially with McCormick’s current performance and broader economic factors in play.
We always advise traders to focus on the variance between the most bullish and bearish forecasts. This variance is the expected future volatility and creates opportunity for short-term traders. Currently this variance is $37 which represents 45% of the current price.
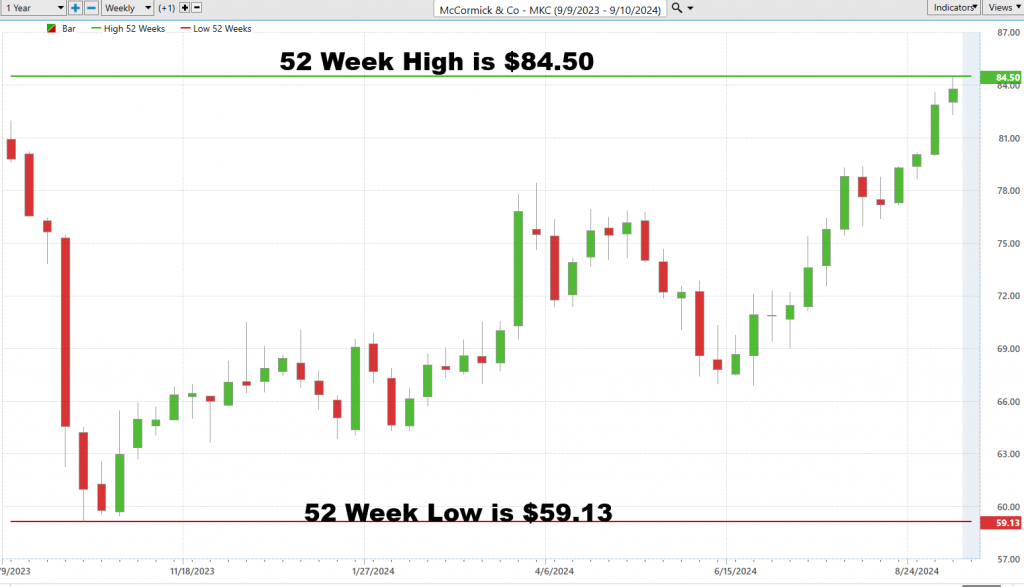
52 Week High and Low Boundaries
Savvy traders always keep an eye on a stock’s 52-week high and low, as these levels offer critical context for understanding where it sits within its annual trading range. These markers aren’t just numbers—they provide a framework that shows where the stock has been and where it could be heading, allowing traders to gauge volatility and momentum.
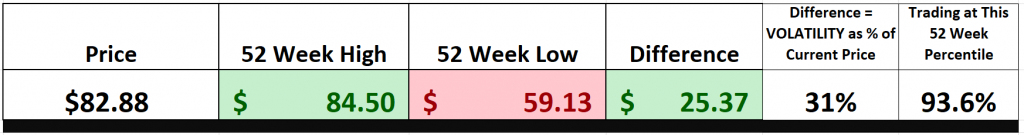
Over the past 52 weeks, we’ve seen sharp retracements that illustrate just how volatile the stock has been. The current trend is pointing up, but if you’ve been holding McCormick for a while, the journey has been anything but smooth. The chart clearly outlines a pattern of higher highs and higher lows, which signals a positive trajectory, though the road has been rocky. With an annual trading range showing 31% volatility, it’s evident that the stock has experienced significant price swings, less than what some on Wall Street have been forecasting but clearly very volatile.
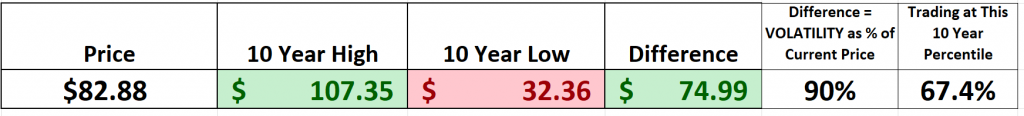
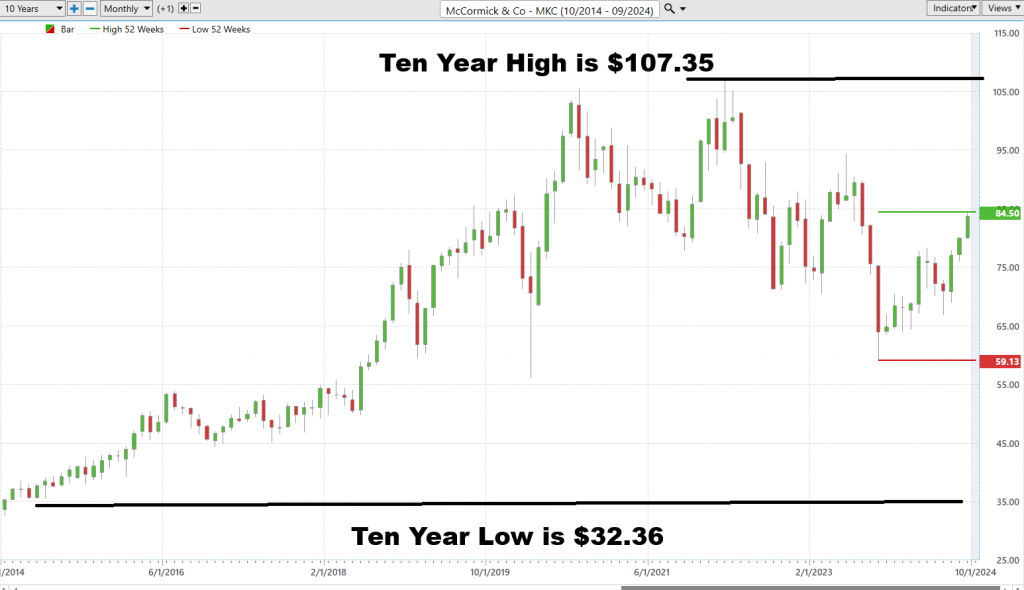
For a more strategic long-term view, expanding this analysis to a 10-year monthly chart can provide better insight into the broader trends and trajectory of the stock, giving a clearer sense of its long-term performance. More importantly we can see the importance of monitoring the 52-week high and low boundaries as $MKC rebounded sharply after testing its 52-week low for several weeks.
Best-Case/Worst-Case Analysis
Trading isn’t about how much you win when you’re right—it’s about minimizing losses when you’re wrong. That’s the key. Risk management should be front and center of every analysis, and that’s why I always advise traders to focus on controlling risk. One of the best ways to do that is by using a best-case/worst-case scenario approach. It’s all about quantifying the opportunities versus the risks by measuring uninterrupted rallies and declines over the past year. This gives you a clear roadmap of risk and reward.
If you want to understand risk quickly, you need to compare the size of the rallies to the severity of the declines. This gives you a true sense of the market’s volatility. Too many traders get into the market without fully preparing, but those who succeed dig deep into the details.
By analyzing the strength of each rally and the depth of each pullback, you’ll have a much better handle on market movement. First, we start with the best-case scenario, assuming we perfectly buy at the lows and sell at the highs of each trend. This analysis shows us the magnitude of each uninterrupted rally in $MKC, helping us understand the potential rewards—and the risks—you need to weigh.
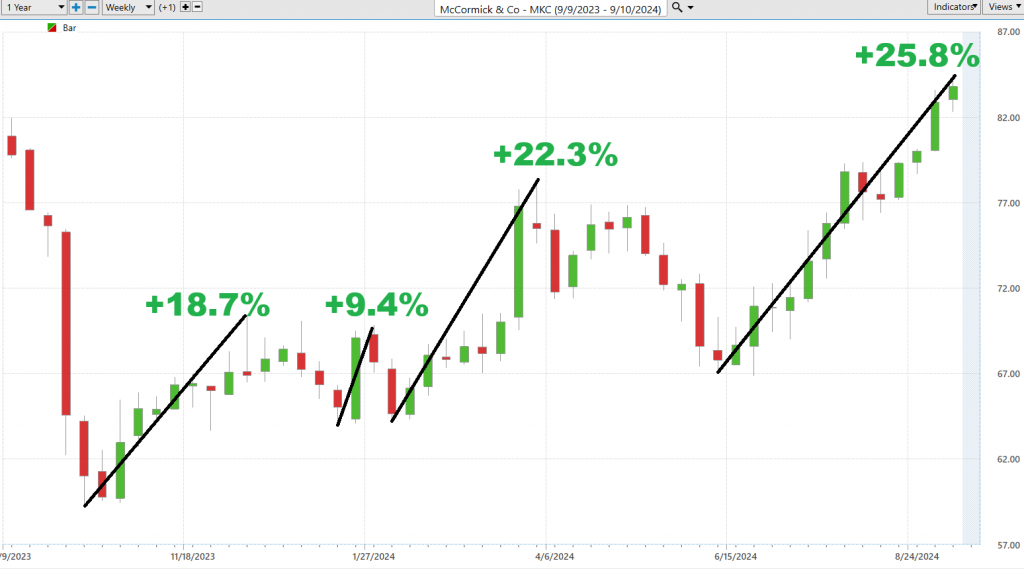
Next, we assume just the opposite and measure the magnitude of each uninterrupted decline.

This practical exercise allows you as a trader to effectively define normal price action over the past year and be prepared for any volatility that the market throws at you. Since the largest uninterrupted rally has been 25.8% and the largest decline has been 27.7% expectations for upside and downside movement are realistic and better understood.
Next, we want to compare the performance of $MKC to the broader stock market indexes.
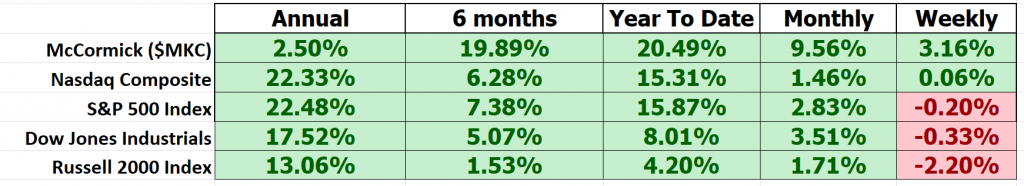
Comparing a stock’s performance to broader market indexes across five different time frames allows investors to gauge its relative strength or weakness, revealing how well it holds up against overall market trends.This analysis helps identify whether the stock is consistently outperforming, underperforming, or moving in sync with the market, offering insights into its potential as a long-term investment or a short-term trading opportunity.
McCormick ($MKC) has a beta of 0.76, which is a way of measuring how much the stock’s price moves compared to the overall market. A beta of 1 means the stock moves exactly like the market. So, if the market goes up 10%, the stock would likely go up 10%, and if the market drops 10%, the stock would drop 10%.
But with a beta of 0.76, McCormick moves less than the market. This means that if the market goes up or down by 10%, McCormick’s stock might only move 7.6%. In simple terms, McCormick is **less risky and less volatile** than the overall market. It’s like riding a smoother wave when others are riding bigger, bumpier waves.
Over the shorter-term time frames $MKC has outperformed but it has lagged quite a bit on the annual time frame.
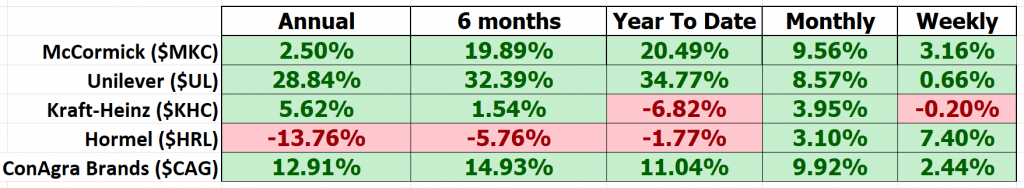
To get a bit more granular what we also like to do is to compare $MKC to its top competitors to get a better understanding of how it has done against other companies facing similar challenges in its own niche.
Vantagepoint A.I. Triple Cross
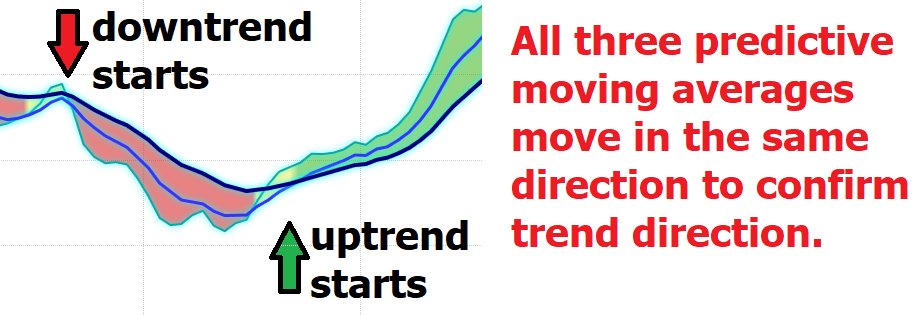
In the world of trading, especially when looking at a stock like McCormick ($MKC), identifying trends is everything. That’s where the “triple cross” strategy comes into play, a tool designed to give traders an edge in predicting the market’s next move.
The VantagePoint A.I. Triple Cross goes beyond the usual two moving averages by incorporating three—covering 3-day, 8-day, and 18-day timeframes for short, medium, and long-term trends. These predictive moving averages aren’t just lagging indicators; they offer early signals that give you a head start on spotting trend shifts before the market fully reacts. It’s like getting insider intel, but legally.
What makes this system powerful is its precision. It waits for each of the three averages to confirm a move, rather than diving in at the first hint of a trend shift. Picture the short and medium-term crossovers as a signal flare, and when the long-term trend aligns, you’ve got the all-clear. This method filters out the noise and hones in on solid, actionable signals, helping you avoid those frustrating false starts or knee-jerk reactions to market fluctuations.
Now, here’s where things get interesting. The Triple Cross is like a disciplined pro—it doesn’t rush into trades. Instead, it patiently waits until all three moving averages line up perfectly, filtering out the market noise and keeping you out of unnecessary trades. When the short-term average crosses the medium-term, it’s like a flare going up, signaling that a shift might be on the horizon. But the real confirmation happens when the medium-term crosses the long-term. That’s the green light—the moment we’ve been anticipating.
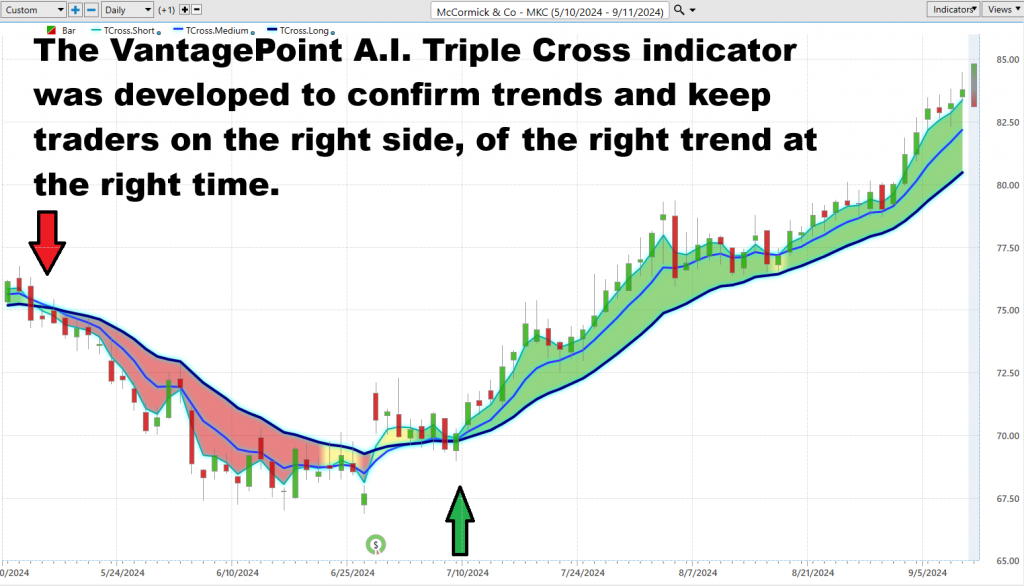
The brilliance of this strategy lies in its ability to stay ahead of the curve. It navigates market volatility with precision, protecting you from jumping into trades too early or getting caught by those misleading signals that can throw traders off.
In the end, the Triple Cross isn’t just another indicator—it’s your personal market watchdog. It gives you a heads-up when a trend is about to shift, confirming the move not once, not twice, but three times. This ensures you’re only stepping into high-quality trades with confidence.
Neural Network Indicator (Machine Learning)
A Neural Network is a type of artificial intelligence (A.I.) designed to mimic the way the human brain processes information. In trading, neural networks are used to analyze vast amounts of market data and make predictions about future price movements. The network consists of layers of “neurons” or nodes, each of which processes a small part of the information. The connections between these nodes adapt and change as the network learns from the data, allowing it to improve its predictions over time.
A neural network is created by feeding it large datasets, like historical price movements, trading volume, and market indicators. The network learns by adjusting the connections between neurons through a process called “training.” This is done by repeatedly analyzing the data and comparing its predictions to actual market outcomes. Over time, the network learns to make more accurate predictions, adjusting its internal structure to better match the patterns it detects in the data.
The Neural Index Indicator at the bottom of the chart is a smart tool that helps predict what might happen in the market. It’s like a traffic light—when it turns green, it suggests the market is strong, and when it turns red, it warns of weakness. You can think of it like a weather forecast but for stocks!
Smart traders don’t just use one tool. They combine this Neural Network Indicator with the Triple Cross Indicator to make their decisions. This strategy isn’t just about being quick, it’s about being accurate and helping them find the perfect times to swing trade allowing better entries and exits.
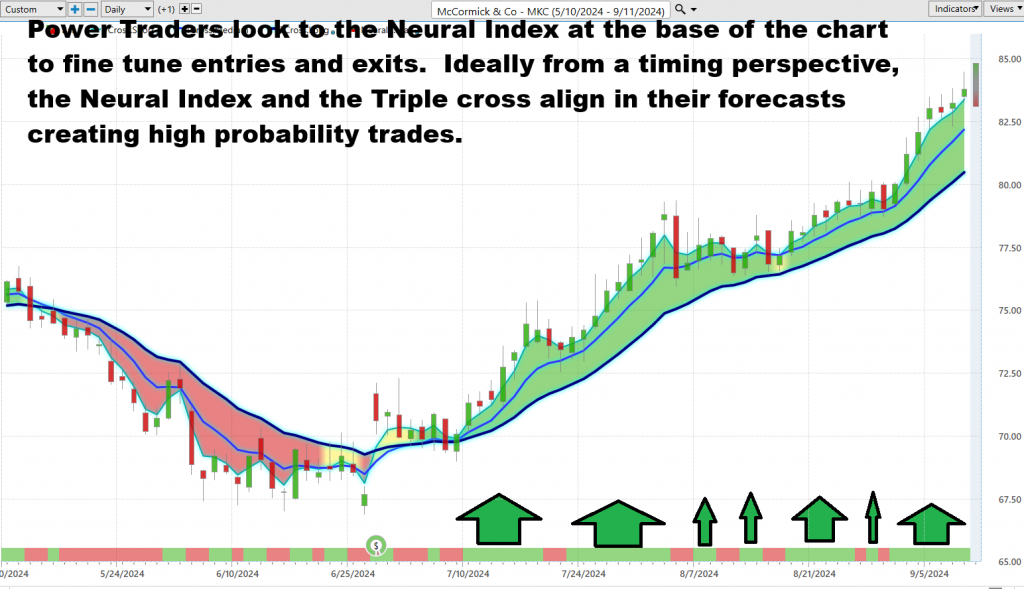
At its core, the Neural Network works like a mini brain, learning and adapting as it looks at lots of data. Picture it as a web of connected points (neurons) that work together to make sense of all the information, helping traders understand trends and make better choices.
With a stock like McCormick ($MKC), traders using VantagePoint’s A.I. Neural Index watch for the blue line to start rising. When the Neural Net Indicator agrees, it gives them extra confidence to act. It’s like a perfect team—when both signals agree, traders know they’ve found a great opportunity to jump in or out of the market.
In short, the combination of these tools, especially with the Neural Network, gives traders an extra edge, helping them stay ahead of the game by reducing mistakes and making more informed decisions.
VantagePoint A.I. Daily Price Range Forecast
Alright, let’s get real. In trading, timing isn’t just important—it’s everything. For those Power Traders who live and breathe market moves, the Daily Range Forecast is their ace in the hole. It’s not just about knowing when to make a move; it’s about precision—catching those perfect entry and exit points that can make or break a trade.
Volatility? Sure, it’s always lurking, making it tough to stay ahead. But here’s the thing—having data isn’t enough anymore. You’ve got to turn that data into actionable insights, and that’s where the big boys—A.I., machine learning, neural networks—come into play. They’re not just tech buzzwords; they’re the tools you need to stay ahead in the financial markets, cutting the guesswork and delivering sharp, clear forecasts that give you an edge.
Now, take McCormick ($MKC) as an example. You can look at those daily, weekly, and monthly trading ranges all day, but what matters is identifying those sweet spots.
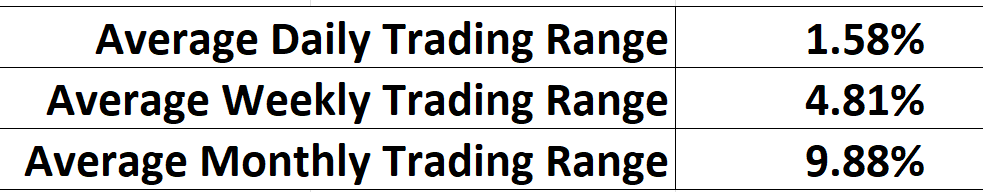
You want to know when to get in and when to get out, and that’s where the Daily Range Forecast chart steps in. It’s like your personal GPS, laying out the path for short-term trades and giving you the precision you need to navigate through the market’s twists and turns.
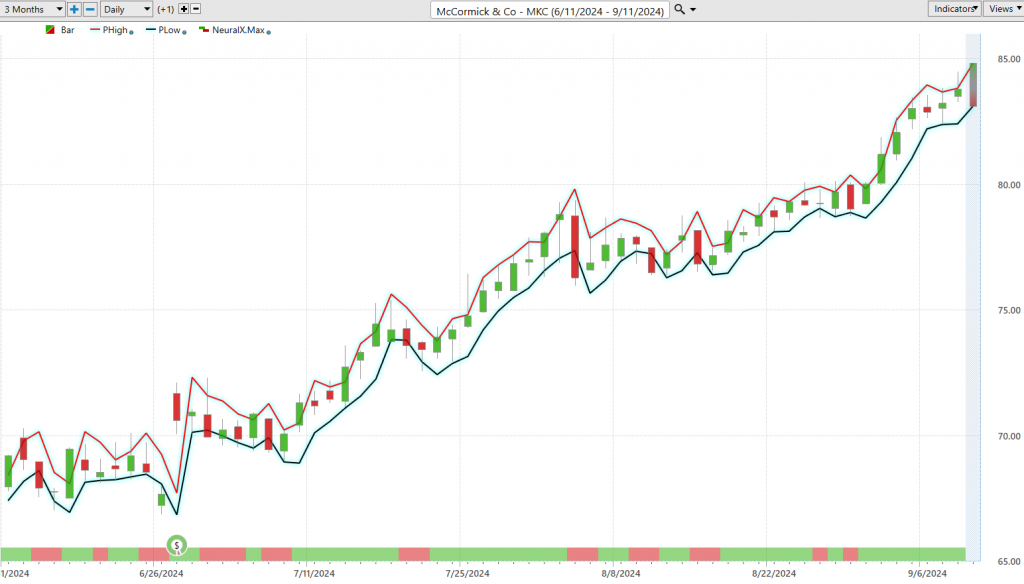
Bottom line? In this high-speed world of trading, precision isn’t just helpful—it’s a must. VantagePoint A.I.’s Daily Range Forecast, armed with artificial intelligence, is the tool that’ll help you not just survive but thrive. It predicts the market’s next move with pinpoint accuracy, giving you the insights you need to time your trades like a pro. Remember, in this game, being ahead of the curve isn’t just good—it’s everything.
Intermarket Analysis
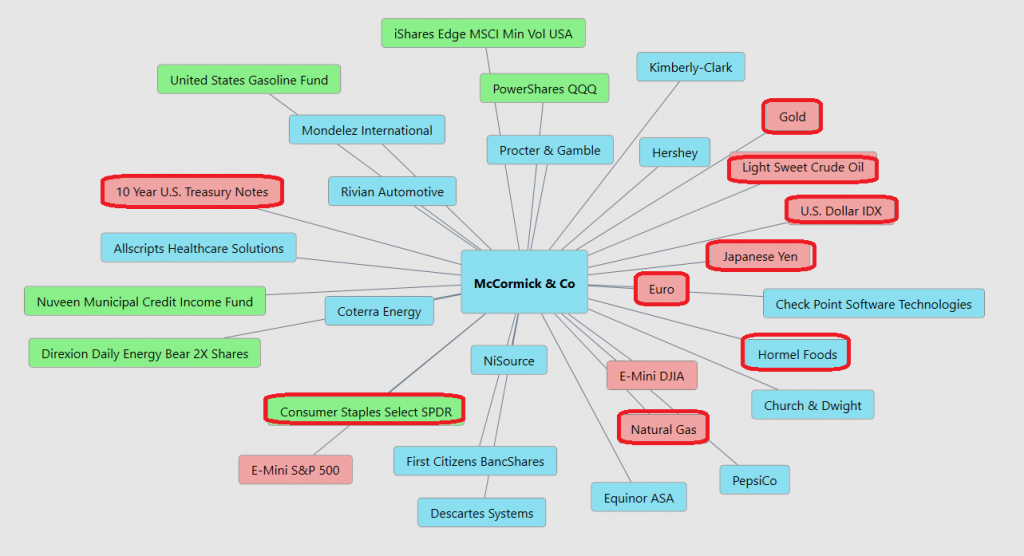
Intermarket analysis delves into the dynamic relationships between different financial markets—stocks, bonds, commodities, and currencies—to better forecast price movements and refine trading strategies. It’s all about understanding how shifts in one market can ripple across others. For instance, when bond yields rise, it might signal inflationary pressures that could harm companies like McCormick ($MKC), which rely on stable consumer demand. If commodity prices like spices increase, McCormick faces higher input costs, potentially squeezing margins unless they raise prices for consumers. Likewise, fluctuations in the U.S. dollar can affect international sales, with a stronger dollar making McCormick’s products more expensive abroad, while a weaker dollar can boost competitiveness overseas.
Key figures in this space, such as John Murphy and Lou Mendelsohn, have paved the way for integrating intermarket analysis into practical trading. Murphy’s seminal work highlighted how interconnected markets could reveal future trends, while Mendelsohn’s use of A.I. in platforms like VantagePoint helped traders harness these insights to predict market behavior more accurately. By recognizing how various assets influence each other, intermarket analysis provides a holistic approach, allowing traders to anticipate turning points and build robust strategies. For McCormick, analyzing factors like commodity prices and currency trends becomes essential to navigating broader market shifts and securing profitability.
When we apply intermarket analysis to McCormick & Co. ($MKC), it becomes clear how interconnected markets play a critical role in the company’s performance. The bond market is a strong indicator of economic conditions like inflation and growth, and changes in bond yields could directly impact McCormick’s cost structure, particularly through higher ingredient prices or transportation costs. If bond yields rise, signaling inflation, McCormick might face pressure on margins unless it can pass those costs onto consumers through price increases.
Meanwhile, the commodity market is crucial for McCormick. Raw materials such as spices, herbs, and sugar are essential inputs for the company, and price fluctuations can significantly impact profitability. Rising commodity prices, if left unchecked, could erode margins, especially if McCormick struggles to adjust its pricing or hedge against these costs.
The currency market also plays a vital role. As a global company, McCormick’s international sales are sensitive to currency fluctuations. A strong U.S. dollar can dampen international revenues because McCormick’s products become more expensive for foreign customers, while a weaker dollar could enhance its competitive position overseas by making its goods more affordable in other currencies.
As part of the consumer staples sector, $MKC, is often viewed as a defensive stock, meaning it tends to perform well during periods of market volatility or economic downturns, when investors seek safer, less cyclical assets.
The interplay of these markets can offer deeper insights into McCormick’s trajectory. Traders and investors can leverage intermarket analysis to anticipate the pressures and opportunities McCormick may face, helping to fine-tune trading strategies and make more informed investment decisions. By keeping an eye on these key external factors, we gain a fuller picture of how McCormick might navigate the ever-changing landscape of the global economy.
Our Suggestion
McCormick’s Q1 and Q2 2024 earnings reports reveal both challenges and opportunities as the company navigates a tough economic environment. In Q1, adjusted EPS rose 7% year-over-year to $0.63, but net sales dipped 1% to $1.66 billion, driven by weaker demand in China and sluggish growth in the Flavor Solutions segment. Despite these hurdles, McCormick reaffirmed its full-year guidance with an expected adjusted EPS of $2.80 to $2.85. In Q2, adjusted EPS climbed further to $0.69, beating expectations, though net sales again fell by 1% to $1.64 billion due to volume declines and the divestiture of a canning business. The company saw strong volume growth in core categories like spices and seasonings but continued facing challenges in China. McCormick remains cautiously optimistic, focusing on cost management and brand marketing to drive recovery and volume growth in the latter half of 2024.
$MKC is a Dividend Aristocrat. A ‘Dividend Aristocrat’ is a term used to describe a company that is part of the S&P 500 index and has increased its dividend payouts to shareholders for at least 25 consecutive years. These companies are known for their stability, financial strength, and consistent commitment to returning value to shareholders, even during challenging economic times. Being a Dividend Aristocrat is a mark of distinction, as it signals that a company has a solid track record of profitability and sound financial management over the long term.
Over the last 10 years $MKC is up 135.61% while the S&P 500 is up 175% over the same time frame.
Companies that achieve this status are often from sectors like consumer staples, healthcare, and industrials, which tend to be more resilient to economic downturns. For investors, Dividend Aristocrats are appealing because they provide both steady income and the potential for long-term capital appreciation.
While we’re traders and not long-term investors we feel extra confident in pursuing the long side of a short-term trend by being aware of this detail.
The next earnings call is October 1st, 2024, and will be the catalyst for future growth or contraction.
We advise that you place $MKC on your radar and pay very close attention to it during pullbacks. Follow VantagePoint’s A.I. daily range forecast for future guidance.
Practice good money management on all your trades.
Let’s Be Careful Out There!
It’s not magic.
It’s machine learning.
Disclaimer: THERE IS A HIGH DEGREE OF RISK INVOLVED IN TRADING. IT IS NOT PRUDENT OR ADVISABLE TO MAKE TRADING DECISIONS THAT ARE BEYOND YOUR FINANCIAL MEANS OR INVOLVE TRADING CAPITAL THAT YOU ARE NOT WILLING AND CAPABLE OF LOSING.
VANTAGEPOINT’S MARKETING CAMPAIGNS, OF ANY KIND, DO NOT CONSTITUTE TRADING ADVICE OR AN ENDORSEMENT OR RECOMMENDATION BY VANTAGEPOINT AI OR ANY ASSOCIATED AFFILIATES OF ANY TRADING METHODS, PROGRAMS, SYSTEMS OR ROUTINES. VANTAGEPOINT’S PERSONNEL ARE NOT LICENSED BROKERS OR ADVISORS AND DO NOT OFFER TRADING ADVICE.


