


| This Week’s a.i. Stock Spotlight is NetApp ($NTAP) |
NetApp, Inc. ($NTAP) is a leading provider of data storage and management solutions, headquartered in Sunnyvale, California. Founded in 1992 by David Hitz, James Lau, and Michael Malcolm, the company quickly established itself as a prominent player in the tech industry. NetApp went public in 1995 during the dot-com boom, becoming one of the early tech companies to do so. Today, it boasts a market capitalization of approximately $26 billion, with about 11,000 employees worldwide. NetApp’s primary business involves developing data management software and hardware solutions that cater to the needs of enterprises, particularly focusing on hybrid cloud environments and data storage optimization.
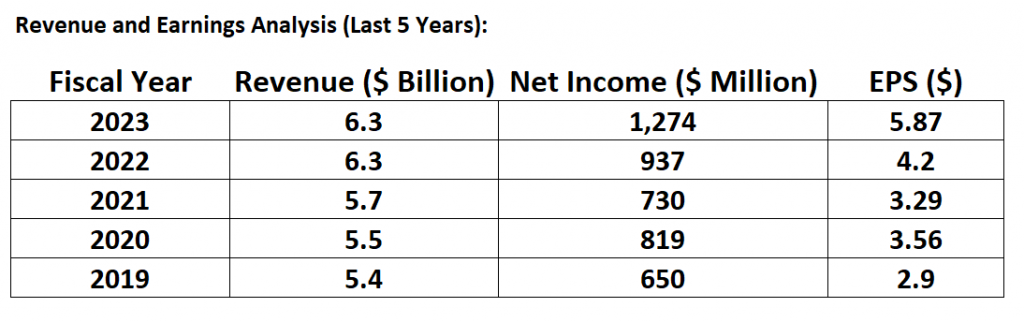
NetApp’s revenue streams are diverse, with significant contributions from both its hybrid cloud and public cloud services. In recent fiscal years, the company reported annual revenues of around $6.3 billion, with a net income of $855 million in the most recent fiscal year. The company’s flagship product, ONTAP, is a highly regarded data management software that supports seamless integration across different cloud platforms. This product, along with other offerings such as AI-driven data management tools and the Keystone Flex Subscription services, underscores NetApp’s commitment to innovation and customer-centric solutions.
Over the past decade, NetApp has strategically expanded its capabilities through key acquisitions, including SolidFire, Spot.io, and CloudCheckr. These acquisitions have not only enhanced its technology portfolio but also its market presence, particularly in the growing cloud services sector. NetApp’s competitive edge lies in its robust product offerings and strong brand reputation, which help it maintain a substantial market share despite intense competition from industry giants like Dell Technologies, Hewlett Packard Enterprise, IBM, and Pure Storage.
The outlook for NetApp remains positive, driven by the increasing demand for cloud storage solutions and data management services. $NTAP is also positioning itself as the “go-to solution for the A.I. boom. With the explosion of ai onto the business scene there is a huge demand for additional data management and storage.
Over the last 5 years $NTAP has grown revenue 16%, but net income has grown by 96% over the same time frame indicating a well-managed and highly profitable business model and company. The stock has responded with gains of 116% over the last 5 years.
Wall Street recognizes that we are in the age of data, and data is the fuel for AI. NetApp has positioned itself as the company that creates the tools that enable clients to use data to fuel their success with A.I..
What also has Wall Street excited is that $NTAP is upselling existing clients with new solutions that take their data and bring it into the A.I. landscapes they want to build. They are bringing on new clients who have not had these tools in their environment, where they are now able to bring their data with $NTAP tools to their A.I. landscapes. So, new clients who are doing business with cloud providers like Google, Microsoft, and Amazon are now also engaging with $NTAP to build hybrid landscapes where enterprises can use A.I. tools like in different clouds that empower their own data sets.
NetApp ($NTAP) has demonstrated remarkable value as a company, with its stock up over 52.6% this year and shares trading near dot-com bubble levels, underscoring robust market performance as it nears its 25th anniversary as a publicly traded entity. The company’s innovative A.I.-integrated tools significantly enhance customer operations and productivity, driving upsells of new A.I. solutions to existing clients and attracting new customers. Strategic collaborations with industry giants Google, Microsoft, and Amazon for hybrid A.I. environments further bolster NetApp’s market position. With a strong financial performance characterized by continuous buybacks and dividends, and an impressive compound annual growth rate of EPS at about 14% over the last seven years, NetApp stands out. Additionally, holding about 50% of the worldwide enterprise unstructured data highlights its pivotal role in data management and A.I. applications.
NetApp’s strong financial health, combined with its innovative product development and strategic acquisitions, positions it well for continued growth in the evolving tech landscape.
In this weekly stock study, we will look at and analyze the following indicators and metrics as are our guidelines which dictate our behavior in deciding whether to buy, sell, or stand aside on a particular stock.
- Wall Street Analysts’ Estimates
- 52-Week High and Low boundaries
- Best Case – Worst Case Analysis
- Vantagepoint A.I. Forecast (Predictive Blue Line)
- Neural Network Forecast
- Daily Range Forecast
- Intermarket Analysis
- Our Suggestion
We don’t base our decisions on things like earnings or fundamental cash flow valuations. However, we do look at them to better understand the financial landscape that a company is operating under.
Wall Street Analysts’ Estimates
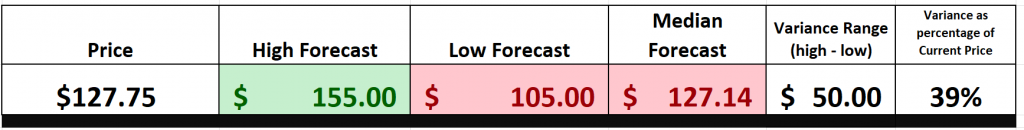
Alright, folks, here’s the scoop on NetApp straight from Wall Street’s top analysts. Over the last three months, 14 seasoned analysts have weighed in on their 12-month price targets. The average target? A solid $127.14. The high end of the forecast reaches an impressive $155.00, while the low end sits at $105.00. This range reflects both the potential and the cautious optimism surrounding NetApp’s performance and prospects. So, whether you’re bullish or a bit more reserved, there’s a lot to consider here.
We always advise traders to pay very close attention to the variance between the most bullish and most bearish forecasts. For $NTAP this variance is $50 or 39% of the current price. This metric is an excellent rule of thumb for expected volatility moving forward.
52-Week High and Low Boundaries
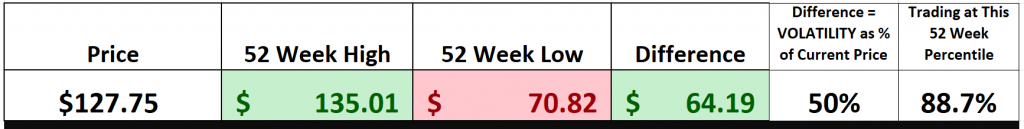
Monitoring the 52-week high and low boundaries is crucial when trading a stock because these metrics provide valuable insights into a stock’s performance, momentum, and volatility. The 52-week high represents the highest price a stock has reached over the past year, indicating strong performance and potential resistance levels. Conversely, the 52-week low marks the lowest price in the same period, highlighting potential support levels and investor pessimism.
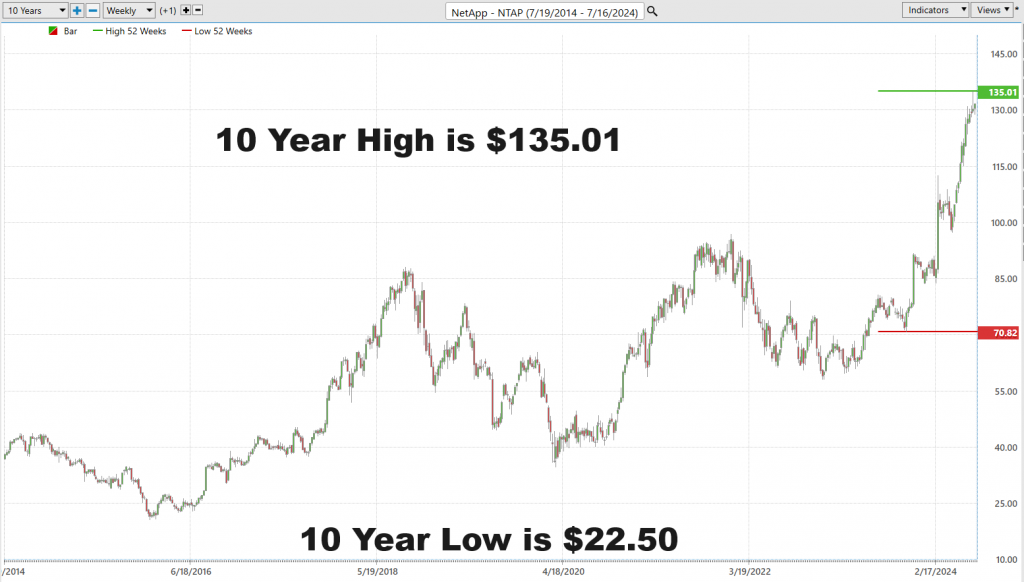
For NetApp ($NTAP), the 52-week high is $135.01, while the 52-week low is $70.82, with a recent close at $127.75. This wide range illustrates significant volatility and momentum shifts, essential for traders to understand potential price movements. By using the annual trading range as a guide, traders can anticipate that $NTAP might trade 50% higher or lower over the next 52 weeks, given the historical price swings. This expectation helps in planning entry and exit strategies, risk management, and setting realistic profit targets. Understanding these boundaries enables traders to make more informed decisions, capitalizing on the stock’s performance trends and inherent volatility.
Let’s dig deeper by studying the charts. First off let’s study the 52-week DAILY chart.
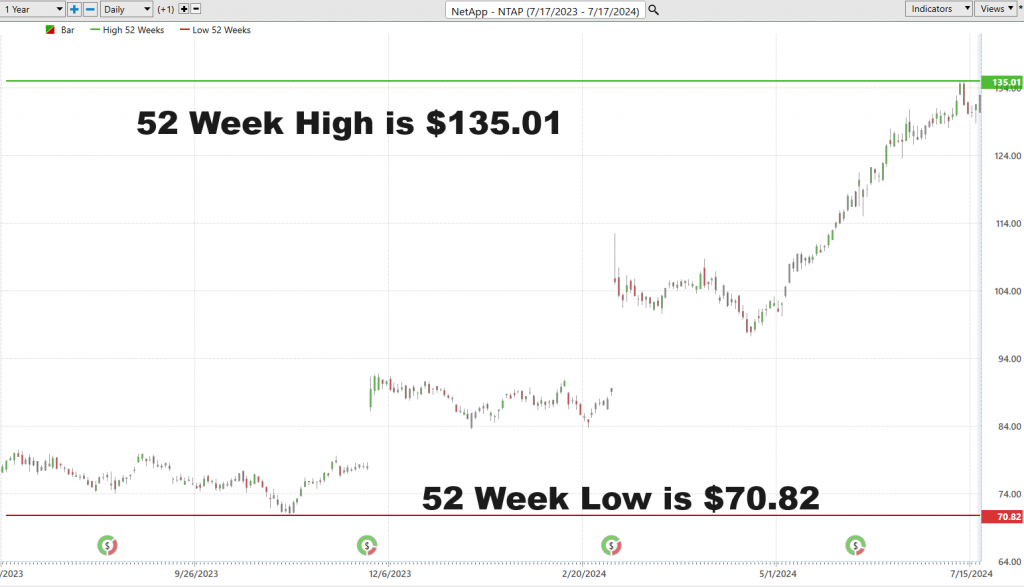
The reason I’m starting with the daily chart is to highlight how volatile $NTAP is particularly around its earnings call. In the last two earnings calls, NetApp ($NTAP) reported strong financial results, with revenue and earnings per share (EPS) exceeding market expectations. In Q3 2024, NetApp achieved an EPS of $1.94 on a revenue of $1.67 billion, driven by robust demand for its hybrid cloud solutions. In Q4 2024, the company continued this momentum, with a 6% year-over-year revenue increase to $1.67 billion and an EPS of $1.80. Key growth areas included their public cloud segment, which saw annualized revenue run rate improvements, and strategic acquisitions that bolstered their cloud service offerings.
This volatility is hidden when we simply study the weekly chart which I’ve published below:

We also advise traders to zoom out and study the 10-year chart to better comprehend the longer-term trend.
One of our all-time favorite trading setups is to place stocks on our trading radar that are making simultaneous 52-week highs accompanied by new 10-year highs. These assets are rare, but they are the crème-de-la-crème as far as trading is concerned. These instances display tremendous strength and bias as we need to be aware of them so that we can take advantage of them.
NTAP has been making new 52-week highs and new 10-year highs since March 2024. Price has rallied $35 since this occurred.
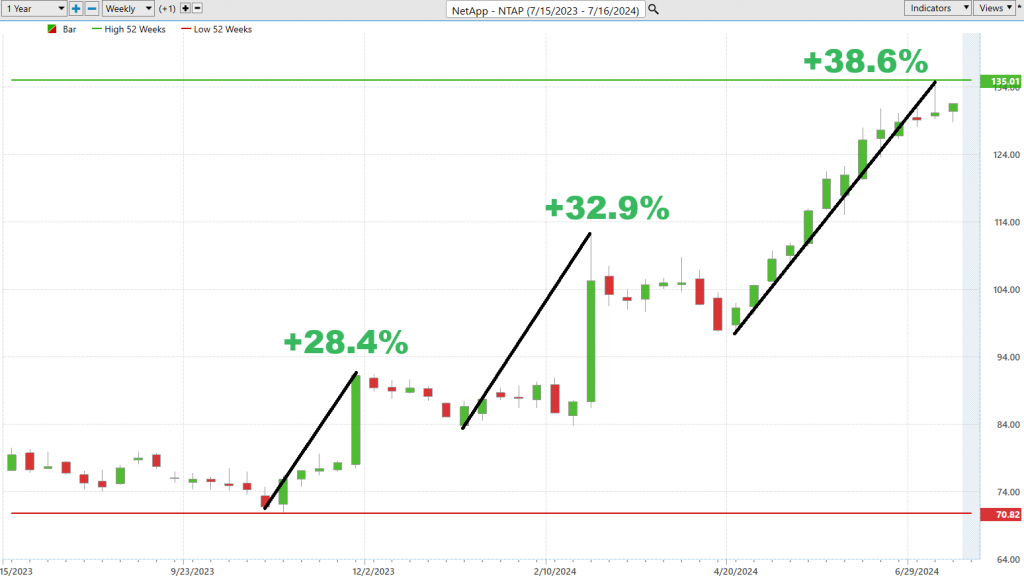
Best Case – Worst Case Analysis
Many traders plunge into the market woefully unprepared and blissfully unaware of the inherent risks, often dazzled by greed and their own overconfidence. However, there’s a simple yet powerful technique to gauge both risk and reward effectively: analyzing the strength of rallies and declines over the past year.
Examining a stock’s price chart provides a concrete perspective on volatility, vividly demonstrating how market prices can swing dramatically due to various factors such as market events and investor sentiment. This visual representation of market movements over time highlights the ebbs and flows of stock prices in a way that’s easily comprehensible.
The purpose of this exercise is to simply try to define risk and reward quantitatively over the past year. Everyone can easily see the magnitude of the rallies and the declines. These metrics define how rapidly the trend occurred and disappeared providing traders a clearcut understanding of volatility.
For instance, a price chart during a market rally will show a consistent upward trend with occasional dips or corrections, reflecting a period of investor optimism and confidence as they buy stocks in anticipation of future gains. On the other hand, during a market decline, the chart will illustrate sharp price drops interspersed with brief rallies, signaling fear and uncertainty as investors sell off stocks to mitigate losses. By comparing the magnitude of these rallies and declines, traders can set realistic expectations and better prepare for potential market volatility.
First off, we look at the best-case analysis which assumes we buy the lows and sell the highs.
Next, we study the worst-case analysis which assumes that we buy the highs and sell the lows.
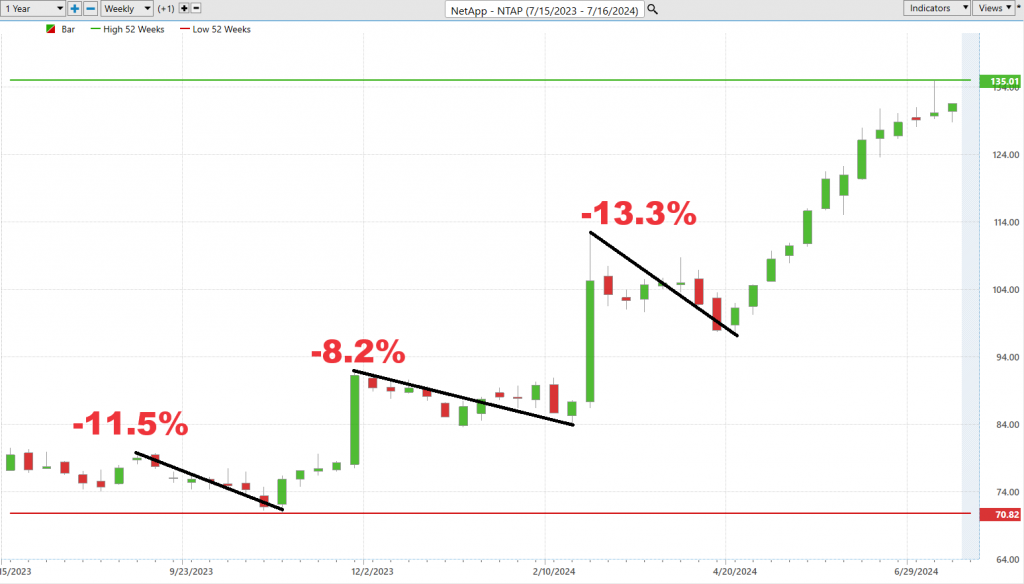
You can quickly understand that the declines were small in comparison to the rallies. More importantly, you can easily extrapolate that if the future is anything like the past, we should expect to see similar type of volatility moving forward.
Alright, folks, let’s not let greed cloud our judgment. Instead, employ this straightforward technique to truly grasp the market’s movements and make more informed trading decisions. Stay informed, stay prepared, and you’ll tackle the market with newfound confidence and clarity.
Now, let’s compare NetApp ($NTAP) to the broader stock market indexes and see where it stands.
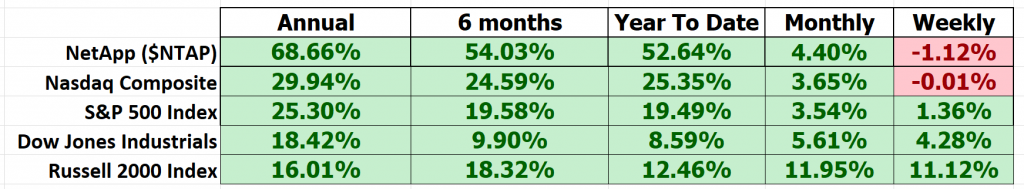
$NTAP outperforms over the longer-term time frames.
The five-year beta for NetApp (NTAP) is 1.26.
Beta is a measure of a stock’s volatility in relation to the overall market. A beta of 1 indicates that the stock’s price moves with the market. A beta greater than 1 means the stock is more volatile than the market, while a beta less than 1 indicates it is less volatile.
With a beta of 1.26, NetApp is 26% more volatile than the market. This higher volatility suggests that NTAP’s stock price is likely to experience larger swings in response to market movements. For investors, this means that while there is potential for higher returns during market upswings, there is also increased risk during downturns. Monitoring the market conditions and NetApp’s specific performance factors will be crucial for making informed trading decisions.
Vantagepoint A.I. Predictive Blue Line
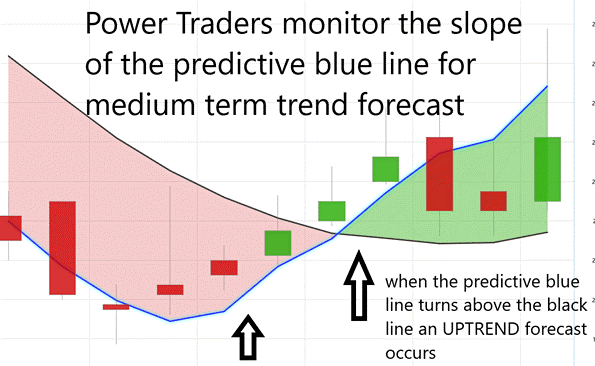
Let’s delve into the essentials of trading with VantagePoint Software. Traders are increasingly leveraging artificial intelligence to gauge market trends by monitoring the predictive blue line’s trajectory. The black line on the chart represents a simple 10-day moving average, reflecting past market performance. However, the predictive blue line signifies the value zone, where traders aim to purchase the asset during uptrends.
When evaluating the chart, traders concentrate on the interaction between the black and predictive blue lines. Powered by VantagePoint’s patented Neural Network and Intermarket Analysis, the blue line incorporates the asset’s key price drivers and statistical correlations to determine its value.
Here’s the key takeaway: when the predictive blue line crosses above the black line, it indicates an upward trend, signaling an entry point for traders. Conversely, when it falls below, it suggests a potential decline. This allows traders to identify trends and value zones with greater accuracy.
For short-term swing traders, the focus remains on the trend rather than the popularity of a stock, such as NetApp ($NTAP), which, although not as popular as some Wall Street favorites, still offers substantial trading opportunities.
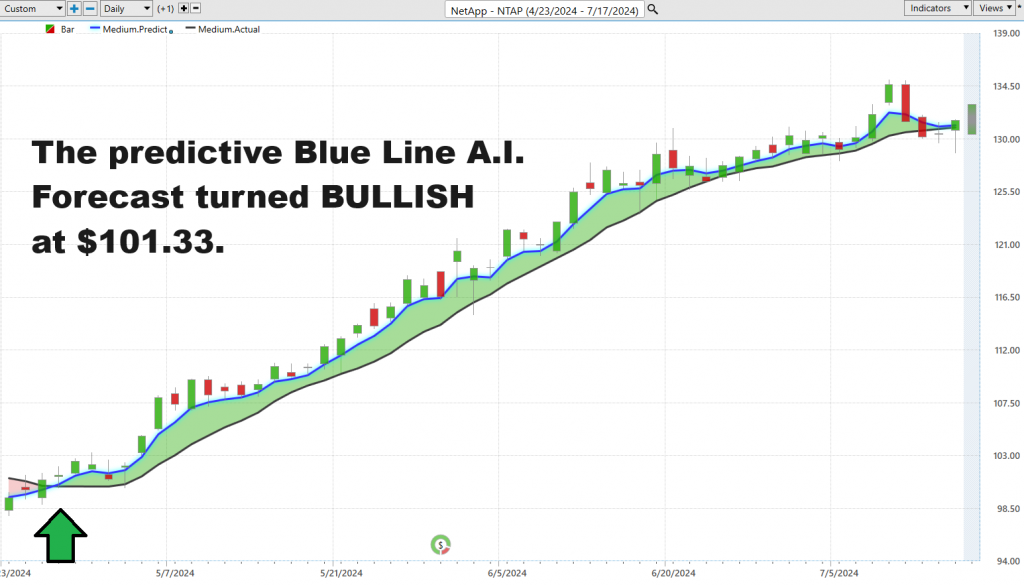
The predictive blue line acts as a foresight tool for future market movements. A rising blue line indicates a bullish trend, suggesting a buying opportunity, whereas a declining blue line warns of potential price drops in NetApp’s stock.
Timing is crucial here. The ‘Value Zone’ around the predictive blue line is vital—buy when the stock is at or below this line during uptrends and sell when it peaks during downswings. This approach helps traders maximize gains and minimize risks. A descending blue line signals potentially lower prices ahead. Savvy traders might step back, hedge their positions, or take protective measures for their portfolios during such periods.
Thanks to A.I. advancements, traders now have precision tools that offer previously unimaginable insights. The predictive blue line serves as more than just a tool; it’s a beacon guiding traders through market fluctuations towards profitable moves. In the competitive realm of stock trading, these insights can make the difference between success and setbacks.
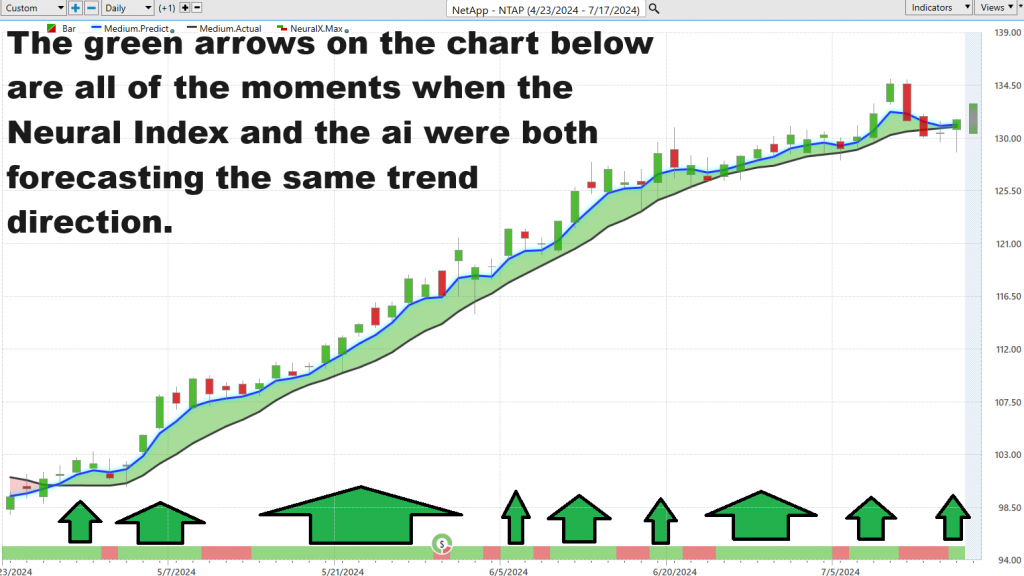
VantagePoint A.I. Neural Index (Machine Learning)
Alright, folks, let’s talk about neural networks—these are not your run-of-the-mill algorithms. Think of them as an advanced form of artificial intelligence that mimics the human brain’s way of processing information. We’re talking about layers upon layers of interconnected nodes, or neurons, working together to analyze data and spot complex patterns. Now, in the trading world, these neural networks are game changers. They can sift through mountains of historical price data, technical indicators, fundamental data, sentiment data, intermarket data, and macroeconomic data to make predictions that human analysts might miss.
Why does this matter? Well, traders using neural networks can anticipate market moves more accurately. These networks learn from past data and adapt to new conditions, giving traders a sharper edge in decision-making, optimizing entry and exit points, and staying ahead of market changes. The speed and efficiency of these networks mean traders get real-time insights, which is critical in today’s fast-paced markets.
But the real kicker here is the continuous evolution of neural networks. They get smarter over time, refining their predictive abilities. For traders, this means a toolkit that not only predicts market trends but also improves risk management and potentially boosts returns. The neural networks don’t just add value—they’re a strategic asset. They light up the charts, green for buy signals and red for sell signals. Combine this with tools like the Predictive Blue Line, and you get a double confirmation—a powerful duo that helps traders navigate the market with precision.
When you look at the chart below, note how the predictive blue line defines value and the overall trend. Pay attention to the neural index forecast for the next 48 to 72 hours, providing traders with short-term strength or weakness signals in the market. It’s all about staying ahead and making informed decisions, folks. That’s the power of neural networks in trading.
VantagePoint A.I. Daily Range Forecast
Alright folks let’s tackle one of the biggest challenges in trading—knowing when to jump in and when to hold back. Market volatility can make these decisions incredibly tough. For traders eyeing stocks like NetApp ($NTAP), timing is crucial. It’s all about understanding those daily, weekly, and monthly trading ranges and leveraging that knowledge effectively.
But here’s the twist: it’s not just about having the data. The real power lies in transforming that data into winning strategies. This is where the heavyweights like A.I., machine learning, and neural networks come into play. These aren’t just flashy buzzwords—they’re your navigation tools through the turbulent financial markets. They deliver clear, actionable insights into market trends and pinpoint trading ranges with remarkable accuracy, cutting down the guesswork in your trading decisions.
NetApp ($NTAP) is a prime example. With an average daily trading volume of approximately 2.1 million shares, this metric highlights the stock’s liquidity and how actively it is traded. Let’s delve into the volatility NetApp has experienced over the past year, broken down into daily, weekly, and monthly segments. This level of detail can give you a significant edge in your trading strategy.

But this data in and of itself is only the beginning. As a trader you still need to know where to get in and where to get out. Enter Stage Right the VantagePoint A.I. Daily Range Forecast.
In today’s unpredictable market, tools like the VantagePoint A.I. Daily Range Forecast are indispensable for traders. With unmatched accuracy and comprehensive analysis, this technology gives short-term swing traders a powerful advantage, allowing them to navigate the market with confidence. It provides detailed insights into expected daily market movements, outlining market trends and anticipated trading ranges.
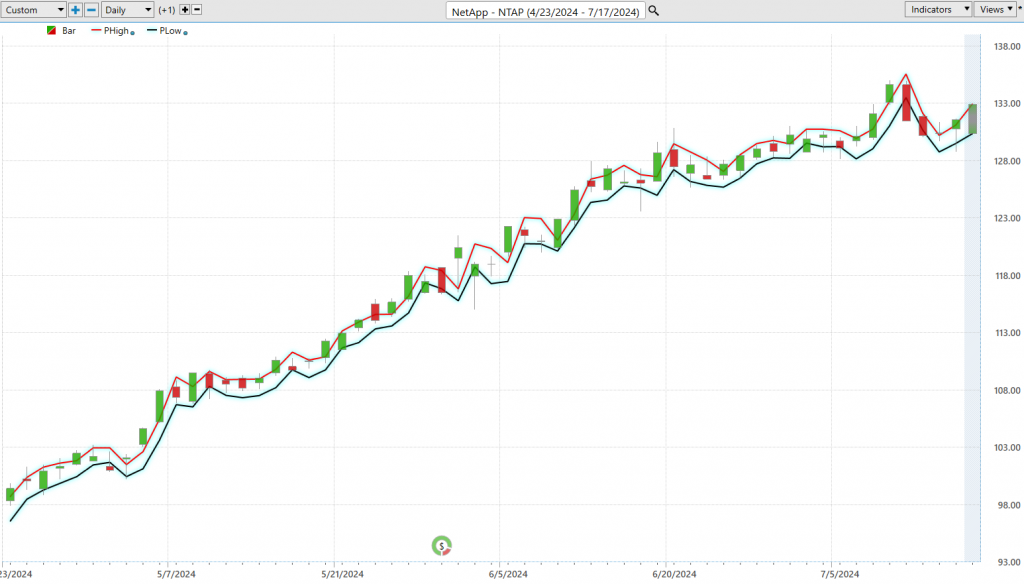
Look at how effective this forecast has been over the past 3 months for stocks like $NTAP. Every day, it forecasts the high and low prices for the following trading day with exacting precision. This granularity helps traders meticulously plan their entry and exit strategies, significantly boosting their confidence. By leveraging advanced analytics, traders can turn complex market data into actionable strategies, paving the way for substantial growth even in unpredictable financial environments. Predictive analytics offer the precision traders need to capitalize on market dynamics, underscoring the critical role of advanced technological tools in modern trading.
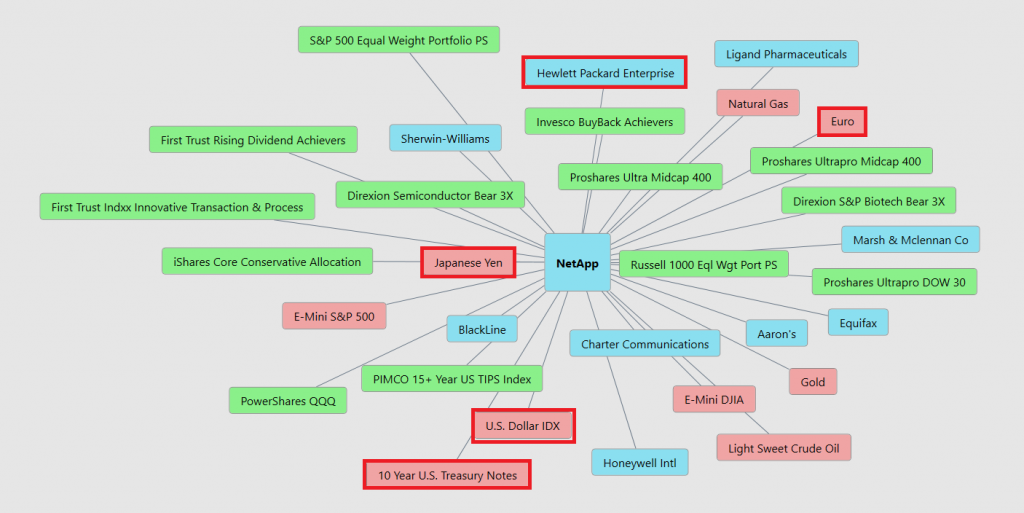
VantagePoint A.I. Intermarket Analysis
Intermarket analysis is the study of the relationships between different financial markets, such as stocks, bonds, commodities, and currencies, to predict market trends and make informed trading decisions.
Intermarket analysis is about understanding how different elements in the world are connected and how they impact each other. Take NetApp ($NTAP), for example. To produce its advanced storage solutions, NetApp relies heavily on semiconductor companies for chips. If these chip manufacturers are performing well, it ensures a stable supply for NetApp, potentially boosting its stock price. Moreover, since NetApp operates globally, a weaker U.S. dollar increases the value of its overseas earnings, which is beneficial for its stock. Additionally, if the prices of metals used in their products remain stable, production costs are lower, enhancing profitability. By examining how these interconnected markets—chips, currency exchange rates, and metal prices—affect NetApp, we can make more informed predictions about the stock’s performance.
For NetApp, one crucial sector is the semiconductor industry. The company depends on suppliers like TSMC and Qualcomm for chips. Strong earnings and positive forecasts from these semiconductor companies indicate a stable supply chain for NetApp, which can boost its stock price. Conversely, problems in the semiconductor industry can hinder NetApp’s production and negatively affect its stock performance. NetApp is also highly dependent on other cloud storage providers like Google and Amazon.
Currency markets also play a significant role. NetApp generates substantial revenue from international markets, so fluctuations in the U.S. dollar can significantly impact its earnings. A weaker dollar means higher value for overseas revenue, positively affecting the stock price. On the flip side, a stronger dollar can reduce reported earnings, posing challenges for the stock. Monitoring currency trends is crucial for understanding NetApp’s financial outlook.
By analyzing these interconnected markets—semiconductors, currencies, and commodities—traders gain a comprehensive understanding of the factors impacting NetApp’s stock, allowing for more informed trading decisions.
As you study the graphic below, these are the 31 top drivers of NetApp’s ($NTAP) price.
Our Suggestion
In the last three earnings calls, NetApp ($NTAP) has shown consistent growth. The company reported increasing revenues and exceeded analysts’ expectations, driven by strong demand for its hybrid cloud solutions and strategic acquisitions. NetApp’s robust performance is reflected in its significantly improved earnings per share over the past year, indicating a positive trajectory for the company.
NetApp has effectively positioned itself as a leading provider of data storage and security solutions, catering to customers with unique, personalized hybrid data needs. The company’s commitment to innovation and strategic partnerships has solidified its role in the industry.
Traders should leverage the AI Daily Range Forecast for precise daily guidance and always practice good money management in their trades to navigate the market effectively and minimize risks. $NTAP is fairly valued now but deserves to be on your trading radar. In the weeks and months to come we anticipate it will provide numerous trading opportunities.
Let’s Be Careful Out There!
It’s Not Magic.
It’s Machine Learning.
Disclaimer: THERE IS A HIGH DEGREE OF RISK INVOLVED IN TRADING. IT IS NOT PRUDENT OR ADVISABLE TO MAKE TRADING DECISIONS THAT ARE BEYOND YOUR FINANCIAL MEANS OR INVOLVE TRADING CAPITAL THAT YOU ARE NOT WILLING AND CAPABLE OF LOSING.
VANTAGEPOINT’S MARKETING CAMPAIGNS, OF ANY KIND, DO NOT CONSTITUTE TRADING ADVICE OR AN ENDORSEMENT OR RECOMMENDATION BY VANTAGEPOINT AI OR ANY ASSOCIATED AFFILIATES OF ANY TRADING METHODS, PROGRAMS, SYSTEMS OR ROUTINES. VANTAGEPOINT’S PERSONNEL ARE NOT LICENSED BROKERS OR ADVISORS AND DO NOT OFFER TRADING ADVICE.


