| This Week’s a.i. Stock Spotlight is Progressive ($PGR) |
Today we turn our focus to The Progressive Corporation, an industry stalwart in the auto insurance sector and a broader purveyor of insurance products. Founded in 1937 by Joseph Lewis and Jack Green, Progressive has carved out a significant niche in the United States, headquartered in the quaint Mayfield Village, Ohio. The company’s journey from its inception to becoming a major force in car insurance is a testament to its strategic agility and innovative business practices.
Progressive operates through distinct profit centers: personal lines, commercial lines, and property insurance, with revenue predominantly sourced from premiums. The company boasts a robust workforce of approximately 45,000, underscoring its expansive operational scale. Historically, Progressive demonstrated remarkable financial acumen by achieving profitability shortly after its establishment and has maintained commendable financial health with relatively low debt levels, prioritizing sustainable growth through operational earnings.
In the competitive realm of auto insurance, where it faces giants like GEICO, State Farm, and Allstate, Progressive has managed to stay ahead through innovative offerings such as usage-based insurance and a dynamic online presence. These strategic elements have not only differentiated Progressive from its competitors but also solidified its market leadership.
Over the last couple of quarters, Progressive Corporation has been firing on all cylinders, showcasing some serious financial muscle. In Q2 2024, the firm reported a whopping 22% hike in net premiums written and a 19% increase in net premiums earned year-over-year, with net income skyrocketing by 322%. This surge in profitability was reflected in a significantly improved combined ratio of 86.2, down 8.5 points, signaling stronger efficiency in managing claims and expenses.
The combined ratio is a measure used in the insurance industry to assess a company’s profitability from its underwriting activities. It is calculated by adding the ratios of claims and expenses to earned premiums. A combined ratio below 100% indicates that the company is making an underwritten profit, meaning that the premiums earned exceed the costs of claims and operating expenses. Conversely, a ratio above 100% suggests an underwriting loss. This metric is crucial for understanding the financial health of insurance companies.
For traders, these figures are golden. The robust growth in net income and the sharp improvement in the combined ratio are clear indicators of Progressive’s prowess in navigating the intricate insurance landscape, which not only speaks to the company’s current financial health but also hints at its potential for continued growth and market dominance. This operational success, combined with strategic acquisitions and market expansion, positions Progressive as a compelling pick for traders eyeing solid investments in the competitive insurance sector. $PGR’s next earnings call is October 11, 2024.
Study the revenue and earnings table below and you can quickly see the effect that the pandemic had on the company’s financials. Revenue has continued to blossom year over year. But earnings have struggled post pandemic up until last year. Over the last 5 years revenue has grown by 59%. However, earnings have contracted 2% from 2019. While the company is growing revenue handsomely, its earnings are not commensurate.

Looking ahead, Progressive appears poised to seize opportunities for expansion into new markets and enhance its digital services, which will further streamline customer service and operational efficiency. However, the company must navigate potential pitfalls such as regulatory shifts, market volatility, and the looming threat of climate change, which could escalate insurance claims.
Progressive’s diverse product portfolio, led by its flagship auto insurance alongside significant offerings in commercial auto insurance and policies for motorcycles and boats, continues to be a major revenue driver. Over the past decade, Progressive has also broadened its capabilities through strategic acquisitions, including the notable purchase of Protective Insurance, enhancing its commercial lines offerings.
Wall Street’s perception of Progressive remains overwhelmingly positive, with analysts frequently rating the stock as a “buy” based on its solid market position and fundamental strengths. Yet investors are keenly asking critical questions about how Progressive will handle the escalating frequency of natural disaster claims, its strategies for leveraging A.I. and telematics technology, the implications of regulatory changes on its business model, the potential for growth in non-auto insurance segments, and its plans for international expansion to diversify revenue streams.
Recent developments have spotlighted Progressive’s robust financial performance, with significant gains in stock price year-to-date, propelled by strong equity returns and investment strategies. However, the broader industry faces challenges from regulatory changes and a potential uptick in claims due to increasing severe weather events, presenting a mixed landscape of opportunities and risks.
As Progressive continues to evolve and adapt to the dynamic insurance market, it remains a compelling study of resilience and strategic foresight in a complex regulatory and economic environment.
In this weekly stock study, we will look at an analysis of the following indicators and metrics which are our guidelines which dictate our behavior in deciding whether to buy, sell or stand aside on a particular stock.
- Wall Street Analysts Ratings and Forecasts
- 52 Week High and Low Boundaries
- Best-Case/Worst-Case Analysis
- Vantagepoint A.I. Forecast (Predictive Blue Line)
- Neural Network Forecast (Machine Learning)
- VantagePoint A.I. Daily Range Forecast
- Intermarket Analysis
- Our Suggestion
While we make all our decisions based upon the artificial intelligence forecasts, we do look at the fundamentals briefly, just to understand the financial landscape that $MKC is operating in.
Wall Street Analysts Forecasts
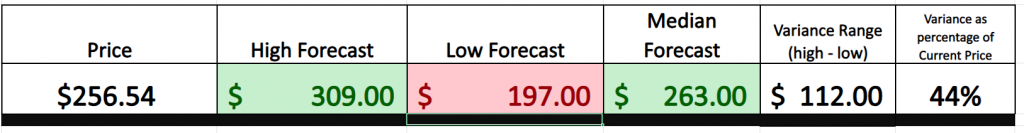
Over the past three months, 17 Wall Street analysts have weighed in on Progressive ($PGR), setting a consensus 12-month price target at $263.00. Expectations vary, with the most bullish analyst projecting a high of $309.00, while the most cautious sees the stock dipping to $197.00.
The wide gap between the most bullish and bearish forecasts for a stock by Wall Street analysts, expressed as a percentage of the current price, serves as a crucial indicator of potential volatility and diverse analyst opinions. This spread at 44% or $112 highlights uncertainty or differing perspectives on the stock’s future performance, signaling that the market might expect significant price movements. Paying attention to this range can help traders gauge the level of risk and possible reward associated with the stock, making it a vital aspect of decision-making.
52 Week High and Low Boundaries
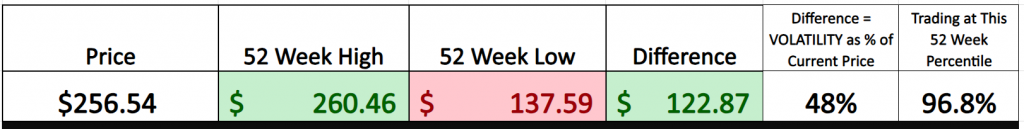
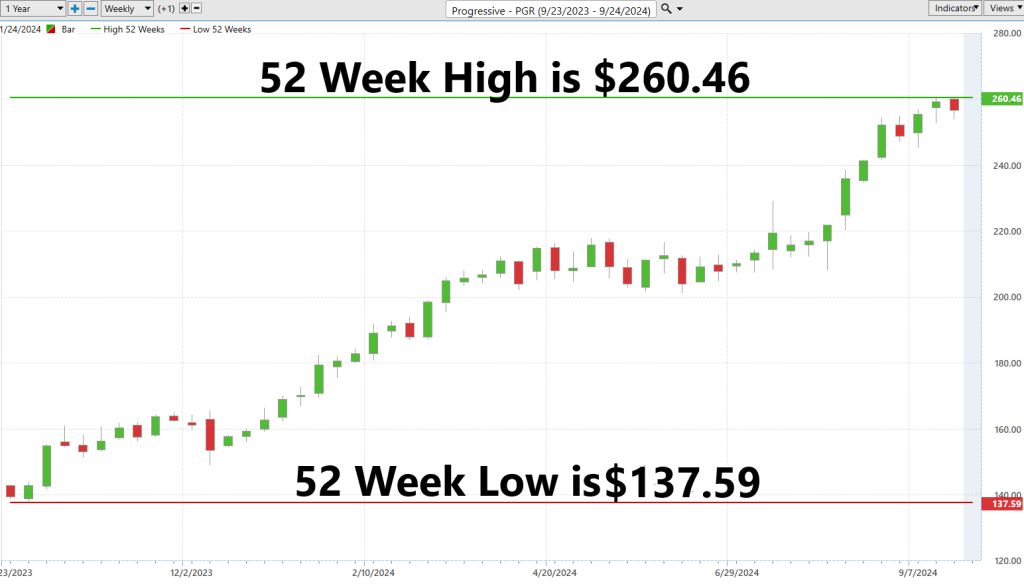
Over the last 52 weeks $PGR has traded as high as $260.46 and as low as $137.59. Understanding the 52-week high and low of a stock is vital for traders looking to capitalize on market trends and gauge a stock’s volatility. These benchmarks not only mark the highest and lowest prices at which a stock has traded over the past year but also serve as key indicators of volatility. Such knowledge is essential for assessing a stock’s historical performance and for setting strategic entry and exit points, helping traders make informed decisions based on the stock’s price range dynamics.
In the bustling arena of Wall Street, shrewd traders consistently monitor the 52-week highs and lows of stocks like Progressive Corporation, recognizing these markers as pivotal guides to the stock’s potential volatility and momentum. These figures are not mere statistics; they carve out the narrative of the stock’s past year, providing a crucial context that could indicate future movements. Considering Progressive’s historical volatility at 48%, this stock demands attention for its significant swing potential—each dip and peak a possible opportunity or risk worth evaluating.
To adopt a more strategic, long-term perspective, delving into a 10-year monthly chart could significantly sharpen our understanding of the stock’s broader trends and trajectory. Such an expansive review not only enriches our grasp of the stock’s historical performance but also enhances our ability to forecast its potential path forward, giving us a clearer, more informed view of its long-term prospects.
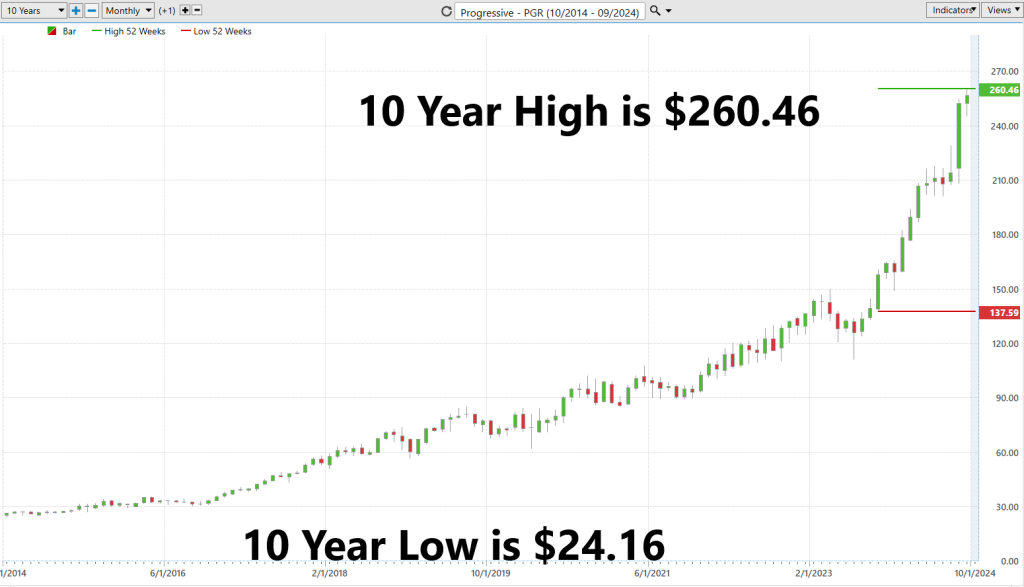
The longer-term perspective is valuable and necessary for investors to consider and provides a wonderful context to how well the stock has performed over the past decade.
Best-Case/Worst-Case Analysis
In trading, success hinges not just on maximizing gains when you’re right, but crucially, on minimizing losses when you’re wrong. This is where risk management becomes indispensable, guiding every investment decision. For traders, employing a scenario-based approach, assessing best-case and worst-case possibilities, provides a robust framework for understanding the balance of potential rewards against risks. By analyzing the magnitudes of both rallies and declines in a stock like $PGR, traders can gain a clearer insight into market volatility and prepare adequately for fluctuations. This rigorous approach to risk assessment not only helps in setting realistic expectations for both upward and downward movements but also ensures traders are well-equipped to handle market dynamics effectively.
Here is the best-case analysis where we measure the uninterrupted rallies over the past year.

Followed by the worst-case analysis which measures the magnitude of the uninterrupted declines.
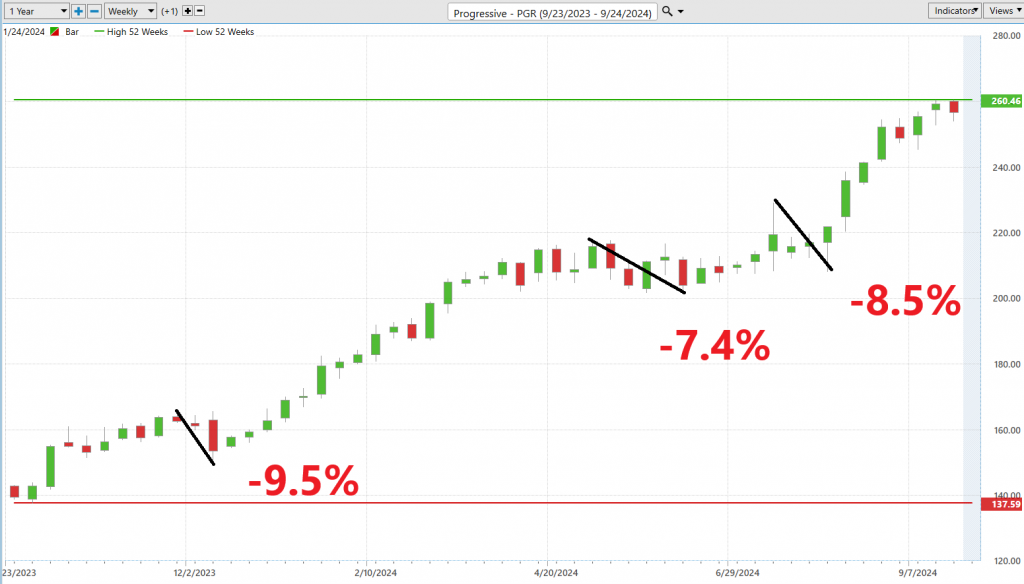
Clearly the bulls have been in control over the past 52 weeks. The purpose of this analysis is to primarily provide expectations moving forward. If the next 52 weeks are anything like the last 52 weeks, we understand how things might develop.
Next, we want to compare the performance of $PGR to the broader stock market indexes.
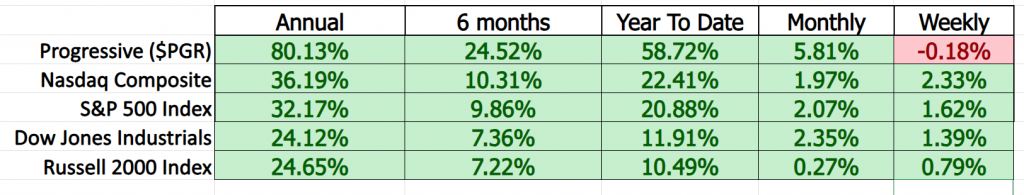
This analysis allows us to see how $PGR has performed against all the broader stock market indexes across multiple time frames.
We often like to get more granular and compare $PGR to its top competitors. This allows us to understand whether it is a leader or laggard in its niche.
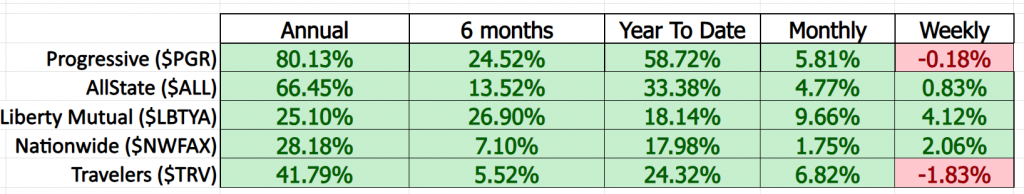
Clearly $PGR is a leader in its niche and has outperformed the broader market impressively over the last 52 weeks.
The beta for Progressive Corporation ($PGR) is 0.35. In simple terms, beta is a measure used to understand how much a stock’s price moves compared to the overall market. If a stock has a beta of 1, it moves in line with the market. A beta less than 1, like Progressive’s 0.35, means the stock is less volatile than the market. So, if the market’s price goes up or down, Progressive’s stock price is likely to move less in comparison. This is also one of the things that makes $PGR a very attractive stock it is 35% as volatile as the broader market and it has massively outperformed.
Vantagepoint A.I. Predictive Blue Line
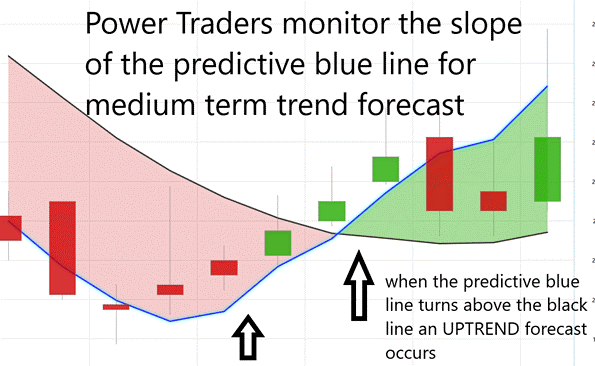
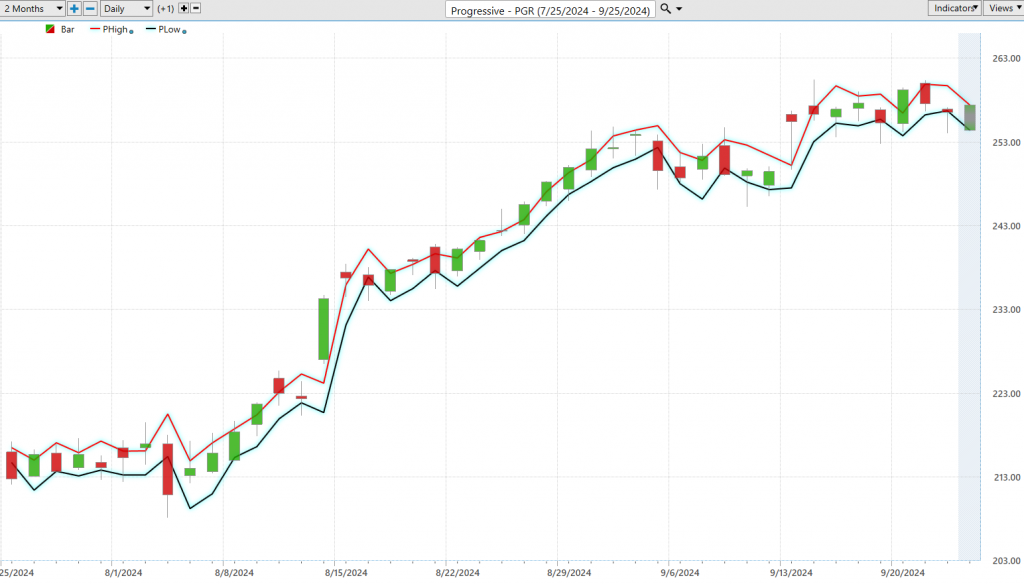
Let’s delve into the complex realm of A.I.-driven market predictions for Progressive ($PGR) in the software domain. Central to our analysis is the predictive blue line—a robust amalgamation of artificial intelligence with intermarket data, poised to decipher emerging market trends. This line is not merely a tool; it serves as a compass through the tempestuous seas of financial markets.
Here’s the crux: monitor the trajectory of the predictive blue line and its interplay with actual stock prices. A pivotal moment is marked when this blue line surpasses the black line, signaling a potential trend reversal. This is straightforward yet potent; the blue line’s direction preempts future trends and charts the course for $PGR’s market trajectory. The “Value Zone” is key—highlighting optimal buying points when prices dip below the blue line, and conversely, selling points during a downturn when prices crest above it. As this blue line trends downward, it heralds possible price declines, advising traders to adjust or hedge their investments accordingly. Cutting-edge A.I. technology like VantagePoint ensures traders are well-equipped, maintaining vigilance on that crucial blue line’s direction.

This tool empowers traders with the confidence they need, pinpointing those critical moments to act decisively. It’s all about timing—capitalizing on the best opportunities to leap into the market and snatch those substantial gains.
Neural Network (Machine Learning)
Think of a neural network as a smart helper for traders, kind of like a super-smart robot that can think a bit like a human. Imagine you have a huge pile of LEGO blocks, each block representing a piece of market information like stock prices or how many people are buying or selling. A neural network helps sort through these blocks quickly to find patterns—like which setups usually lead to prices going up or down. This helps traders make better decisions on when to buy or sell stocks. The Neural Index is at the base of the VantagePoint chart and its forecast lasts for 48-72 hours. Ideally traders want the neural index forecast to align with the predictive blue line forecast for a high probability trade.

At the core of tools like VantagePoint, the Neural Index signals market strength or weakness, guiding traders to align it with the Predictive Blue Line for high-probability trades, keeping them a step ahead in the fast-evolving financial arena.
VantagePoint Software Daily Price Range Forecast
Folks, let’s dive into the revolutionary tools transforming the trading world: artificial intelligence (A.I.), machine learning, and neural networks. These technologies are no longer just optional; they’re essential for traders who need to nail down tomorrow’s trading ranges with laser precision. A.I. sifts through mountains of historical data to spot key trends and patterns that dictate market movements. Machine learning excels in recognizing these patterns, while neural networks bring predictive power to new heights, offering traders unprecedented accuracy in predicting price shifts. This trio of tech allows traders to stay agile, making swift decisions in a market that never sleeps. With A.I., traders gain a significant edge, sharpening their strategy in a complex financial landscape.
Now, let’s get practical and examine how these average trading ranges play out daily, weekly, and monthly. Over the past year this is what the average trading ranges for these time frames have been.
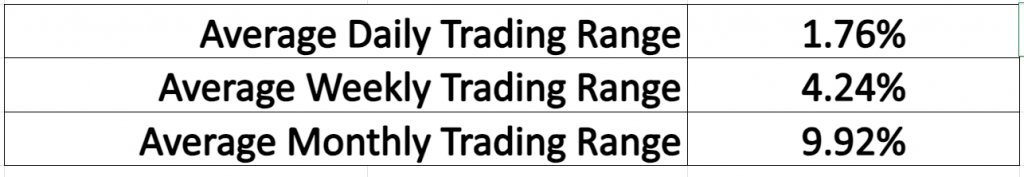
This kind of market volatility is precisely what seasoned traders capitalize on, as it opens the door to substantial opportunities, albeit accompanied by significant risks. The real challenge lies in leveraging this data effectively and applying it in real-time to navigate the markets. Knowing exactly when to enter and exit a trade remains a critical yet elusive factor that could determine the success of a trading strategy. Here, VantagePoint’s A.I. technology offers a transformative edge, enabling traders to harness this volatile environment effectively.
This is far more than just a chart; it’s a precise roadmap for each trading day’s anticipated movements. In the rapid pace of today’s markets, accuracy is not merely a luxury but a necessity. VantagePoint’s A.I., driven by machine learning and neural networks, transcends simple data analysis. It taps into the pulse of the market, providing real-time insights that guide traders through the volatility, helping to pinpoint the most strategic entry points.
Intermarket Analysis
Intermarket analysis is like being a detective in the trading world. It means looking at different markets—like stocks, bonds, currencies, and commodities—to figure out how they affect each other. For example, if Gold prices go up, it might tell us something about the stock market or currency values.
John Murphy and Louis Mendelsohn are two important people in this field. John Murphy helped popularize the idea that these markets are connected and wrote books explaining how to use this knowledge for better trading decisions. Louis Mendelsohn developed the VantagePoint A.I. software that uses this idea to predict market trends using artificial intelligence, neural networks and machine learning.
Using intermarket analysis helps traders because it gives them a bigger picture of what’s happening in the world. By understanding how different markets influence each other, traders can make smarter decisions, not just based on one market but considering many interconnected parts. This approach is especially important today as global markets are highly integrated and what happens in one market can quickly affect others.
Here are the 31 key drivers of $PGR’s price.

In today’s tightly knit global economy, understanding how different markets affect each other is more crucial than ever. As markets grow increasingly interdependent, grasping the cascading impacts of shifts in one area on others becomes vital. Intermarket analysis offers a comprehensive view, arming traders with the insights needed to spot both emerging opportunities and potential risks.
Our Suggestion
In the last two earnings calls, Progressive Corporation reported strong financial results for the second quarter of 2024. Their earnings per share of $2.65 significantly exceeded expectations, marking a substantial improvement from the previous year. The company’s operating revenues also saw a significant increase, rising 18.9% year-over-year to $18.3 billion. This growth was driven by a 22% increase in net premiums written and a 19% rise in net premiums earned, alongside a favorable combined ratio improvement, which indicates efficient claims and expense management.
Opportunities for Progressive include continued growth in premiums and potential market share expansion given their strong performance metrics. However, risks involve market volatility and potential regulatory changes which could impact profitability. Their strategic management of claims and operational efficiency helps mitigate some financial risks, ensuring stable growth in a volatile market.
Progressive stands as a titan in the insurance sector, managing over 20 million policies and boasting a market capitalization exceeding $150 billion. Over the past decade, the company has notched impressive gains, soaring more than 1100% and consistently outstripping the S&P 500, thanks to its adept underwriting and savvy investment maneuvers. With its strong financial foundation marked by minimal debt and a high Return on Equity averaging 22%, alongside robust growth figures, Progressive is well-positioned as a solid investment. Despite its steep valuation, the company’s proven track record and future growth prospects secure it a ‘buy’ rating, promising substantial long-term benefits for investors.
Progressive stands as a beacon of consistent outperformance within the insurance sector, a favorite of investment giants like Warren Buffett for its robust cash flows and indispensable service to both individuals and businesses. This industry, while competitive and demanding, rewards firms that effectively manage the delicate balance between risk and profitability. Progressive excels in this arena, distinguishing itself by consistently achieving underwriting profits where many others merely break even. This exemplary performance positions Progressive not just as a leader in insurance but as a compelling option for long-term investors seeking substantial returns.
The next earnings call is October 11, 2024, and should we see earnings increase it will be the catalyst to drive prices even higher. Revenue is expected to increase by 14.32% annually, while earnings have surged by 300.4% over the last year.
We like $PGR and advise that it should be on your trading radar.
Practice good money management on all your trades.
Rely on artificial intelligence for shorter term trend guidance.
It’s not magic.
It’s machine learning.
Disclaimer: THERE IS A HIGH DEGREE OF RISK INVOLVED IN TRADING. IT IS NOT PRUDENT OR ADVISABLE TO MAKE TRADING DECISIONS THAT ARE BEYOND YOUR FINANCIAL MEANS OR INVOLVE TRADING CAPITAL THAT YOU ARE NOT WILLING AND CAPABLE OF LOSING.
VANTAGEPOINT’S MARKETING CAMPAIGNS, OF ANY KIND, DO NOT CONSTITUTE TRADING ADVICE OR AN ENDORSEMENT OR RECOMMENDATION BY VANTAGEPOINT AI OR ANY ASSOCIATED AFFILIATES OF ANY TRADING METHODS, PROGRAMS, SYSTEMS OR ROUTINES. VANTAGEPOINT’S PERSONNEL ARE NOT LICENSED BROKERS OR ADVISORS AND DO NOT OFFER TRADING ADVICE.