


This week’s ai stock spotlight is AT&T ($T)
AT&T is standing at the edge of a knife. On one side, it’s got a massive telecom empire, a dominant fiber broadband business, a foothold in satellite connectivity, and a government-backed revenue stream with FirstNet. On the other side? A crushing $123.5 billion in debt, relentless competition from T-Mobile and Verizon, and a history of corporate blunders that make investors twitchy. The next few years will decide whether AT&T finally breaks out of its stagnation — or fades into a bloated, overleveraged has-been.
The good news? Q4 2024 was strong — net income surged 70% to $4.41 billion on $32.3 billion in revenue, with 1.7 million new wireless subscribers and double-digit fiber broadband growth. That’s exactly what AT&T needed to prove that its fiber and 5G investments are finally paying off. Fiber broadband is AT&T’s secret weapon — it locks in customers, has higher margins than wireless, and isn’t subject to the same brutal price wars. They’ve already rolled it out to 27 million homes and businesses, and if they keep up the pace, they could dominate the high-speed internet market while Verizon and Comcast scramble to catch up.
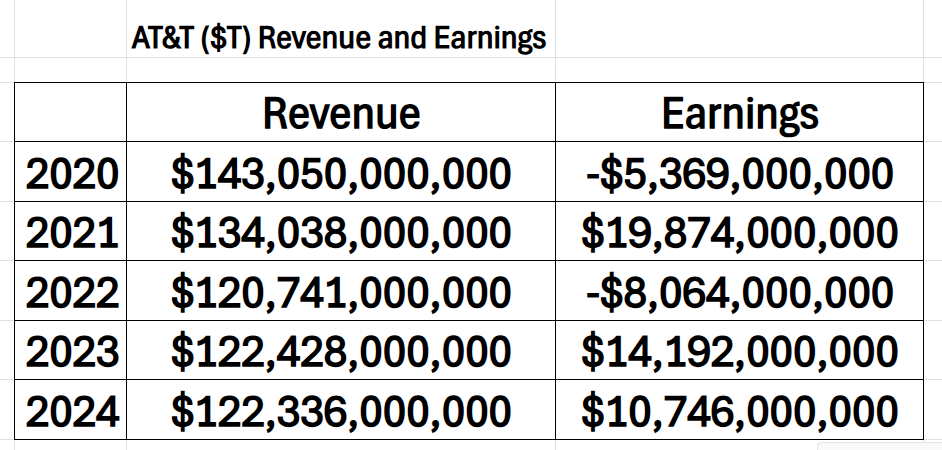
Study the revenue and earnings table below. You can quickly see that out of the last 5 years $T lost money in 2020 and 2022.
But here’s the problem: debt is an anchor. AT&T is dragging around $123.5 billion in liabilities, and while free cash flow hit $17.6 billion in 2024, the question is whether it’s enough to keep paying down debt, funding network expansion, and keeping its dividend intact. Because make no mistake — if that dividend gets cut, investors will bail faster than rats off a sinking ship. AT&T is promising to slash net debt by mid-2025, but if interest rates stay high, if they mismanage cash flow, or if competition eats into profits, that plan goes out the window.
Speaking of competition — T-Mobile is still a massive threat. They’ve led the 5G race, stolen millions of AT&T’s former customers, and they’re relentless with pricing and promotions. If AT&T can’t keep its subscriber momentum going, they risk losing even more ground. And it’s not just T-Mobile. Comcast and Charter are ramping up their broadband speeds, and fixed wireless (5G home internet) from Verizon and T-Mobile is starting to steal customers from fiber, too. AT&T has to move fast, or they’ll lose the only real competitive advantage they have left.
Now, the wildcard — satellite connectivity. AT&T just completed a video call via satellite using its own spectrum, thanks to its partnership with AST SpaceMobile. If they can turn this into a commercial product, it changes the game. No more dead zones. No more relying solely on towers. It puts them in direct competition with SpaceX and Starlink. This could be a gold mine, but only if they execute properly — and AT&T has a history of tripping over its own feet.
So, here’s the bottom line: AT&T has the potential for a massive turnaround—but also the risk of total stagnation. Fiber is growing, 5G is stabilizing, and satellite is a moonshot opportunity. But debt is a major problem, T-Mobile is still eating their lunch, and if free cash flow slows down, they’re in deep trouble. Traders should watch for short-term momentum from earnings beats and subscriber growth, but long-term investors need to keep a close eye on debt management. If they get it right, AT&T could dominate broadband and next-gen connectivity. If they screw it up? They’ll be stuck in the same slow-growth, high-debt cycle that’s plagued them for years. One thing’s for sure — this stock isn’t boring anymore.
In this stock study, we will look at an analysis of the following indicators and metrics which are our guidelines.
- Wall Street Analysts Forecasts
- 52 Week High and Low Boundaries
- Best-Case/Worst-Case Analysis
- Vantagepoint A.I. Predictive Blue Line Indicator
- Neural Network Forecast (Machine Learning)
- Vantagepoint A.I. Daily Range Forecast
- Intermarket Analysis
- Our Suggestion
While we make all our decisions based upon the artificial intelligence forecasts, we do look at the fundamentals briefly, just to understand the financial landscape that $T is operating in. This overview provides insights into $T’s status and future outlook.
Wall Street Analysts Forecasts
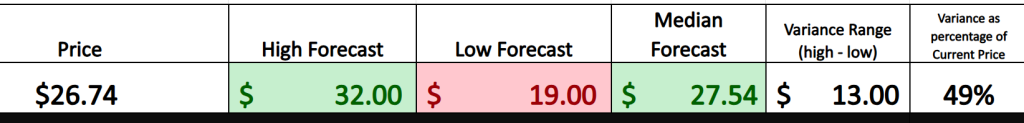
Wall Street remains divided on AT&T’s trajectory, with 24 analysts weighing in on its 12-month price target. The consensus? A $27.54 average target, suggesting a modest upside from its current price of $26.74. But the spread tells a more nuanced story — bulls see upside to $32, betting on fiber and 5G momentum, while bears peg a floor at $19, citing debt risks and competitive pressures. The wide range reflects the uncertainty surrounding AT&T’s execution — a company with strong cash flow potential but heavy financial baggage.
We always advise that Power Traders pay close attention to the variance between the most bullish and bearish forecasts. Currently this variance is $13 or 49% of the current price. This metric is important to monitor because it provides a perspective on what Wall Street’s expected volatility for the coming year.
Whoa, slow down, cowboy — this isn’t just about sunshine and rainbows. That $13 gap between the high and low targets isn’t just a number, it’s a flashing neon sign that screams volatility. Translation? AT&T’s stock could whipsaw in either direction, and if you’re not paying attention, you might get bucked right off. One side is calling for a breakout to $32, the other is bracing for a crash to $18—and that kind of spread means big money is betting on big moves. So, if you’re in this trade, strap in, because this ride is far from smooth.
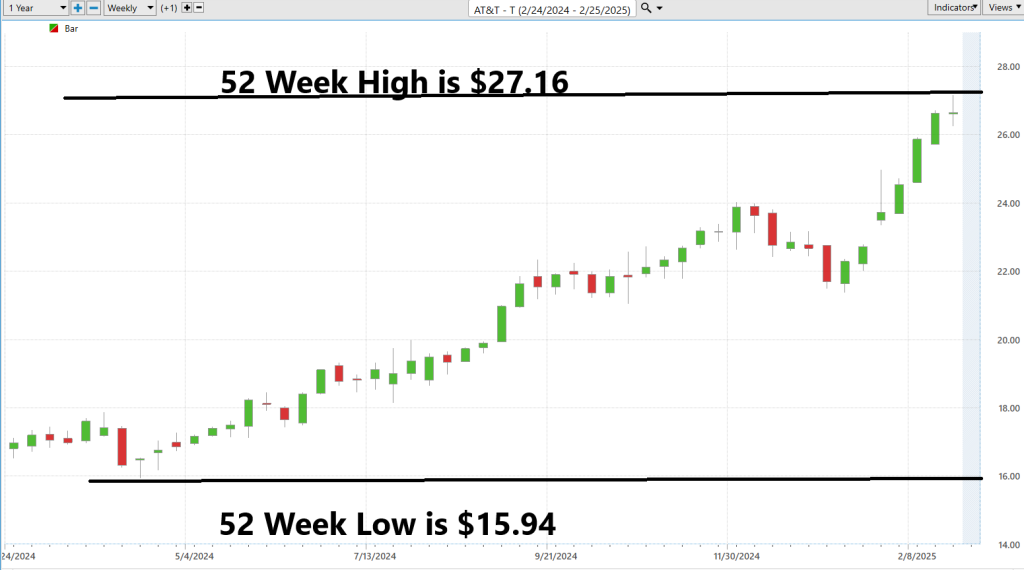
52 Week High and Low Boundaries
The 52-week range isn’t just a couple of numbers slapped on a chart — it’s the pulse of the market, the ultimate stress test that tells you exactly where a stock has been and where it might be going. It’s the X-ray of investor psychology, exposing what makes the market sweat bullets and what sends it into a buying frenzy.
When a stock starts flirting with its 52-week high, that’s not just a good sign, it’s a battle cry. It’s proof that the stock has momentum, that buyers trust it, and that there’s enough fuel in the tank to potentially send it even higher. This is where the real magic happens. Big players take notice. FOMO kicks in. And before you know it, you’re in a breakout rally that could print money.
But on the flip side? A stock crawling near its 52-week low is like a wounded animal in the wild — it signals weakness, fear, and a potential death spiral. Confidence is shattered, stop-losses get hit, and traders start bailing like rats off a sinking ship. If a stock doesn’t hold the line at these levels, it could go straight into freefall.
Here’s the kicker: understanding this range isn’t just smart — it’s survival. This is where market sentiment is shaped, where traders make their biggest moves, and where money is either made or lost in brutal fashion. A stock cracking through its 52-week high? That’s an all-you-can-eat buffet for momentum traders. A stock breaking new lows? That’s a falling knife you don’t want to catch.
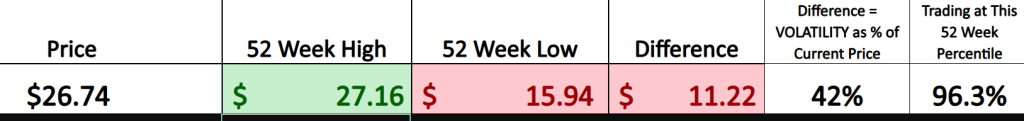
The bottom line? Always check the 52-week range. It’s your compass in chaos, the closest thing you’ll get to a cheat sheet on market sentiment. In the end, trading isn’t just about numbers — it’s about reading the battlefield, knowing when to charge, and knowing when to get the hell out. We suggest that you always scrutinize the historical volatility that the stock has displayed. This metric is simply the difference between the 52-week high and the 52-week low.
Successful traders and investors don’t just watch the market; they study it like a master chess player anticipating moves before they happen. While tracking a stock’s 52-week highs and lows is crucial, it’s only part of the story. The real insights come from zooming out to a 10-year monthly chart. This isn’t just about analyzing numbers; it’s about deciphering the deeper patterns that dictate a stock’s true trajectory over time.
I suggest you to take this long-term perspective when evaluating $T. Market turbulence, economic cycles, and industry shifts all leave footprints on a stock’s decade-long chart — footprints that shorter timeframes fail to capture. What may look like a minor pullback on a daily or weekly chart could be part of a much larger trend — either signaling a long-term breakout or an extended decline.
Integrating this expansive view into your trading and investment strategy gives you a powerful advantage. Instead of reacting to market noise, you develop foresight and confidence in your decisions. You’re no longer swayed by daily fluctuations or short-term panic. Instead, you gain clarity and control, positioning yourself not just to participate in the market, but to master it.
This isn’t speculation, it’s a proven method that the world’s most successful investors use. The longer the timeframe, the clearer the trends, the stronger the signals, and the more decisive your moves can be. A decade-long chart is your roadmap to understanding $T’s deeper cycles, allowing you to invest and trade with intelligence, precision, and maximum profit potential.

Best-Case/Worst-Case Analysis
Before you dive headfirst into trading AT&T ($T), take a deep breath and understand exactly what you’re getting into. This stock isn’t a smooth Sunday drive, it’s a rollercoaster with sharp turns, sudden drops, and the occasional burst of momentum. And if you don’t have a solid grasp on the ride ahead, you’re not trading — you’re gambling.
A best-case/worst-case scenario analysis isn’t just Wall Street jargon — it’s the difference between staying in the game and getting wiped out. Traders who don’t study a stock’s historical highs and lows are flying blind. Want to know what’s possible? Look at AT&T’s biggest rallies. Want to see the danger? Map out its steepest declines. These aren’t just numbers, they tell the story of how this stock moves, when it surges, and when it crashes.
But this isn’t just an academic exercise. This is strategy. These charts help you anticipate volatility, set smart stop-loss levels, and pinpoint profit targets. They’re not just statistics — they’re your blueprint for navigating this market without losing your shirt. A stock like AT&T demands respect, preparation, and discipline.
So, before you make a single trade, do your homework. Study the charts, understand the patterns, and arm yourself with real data.
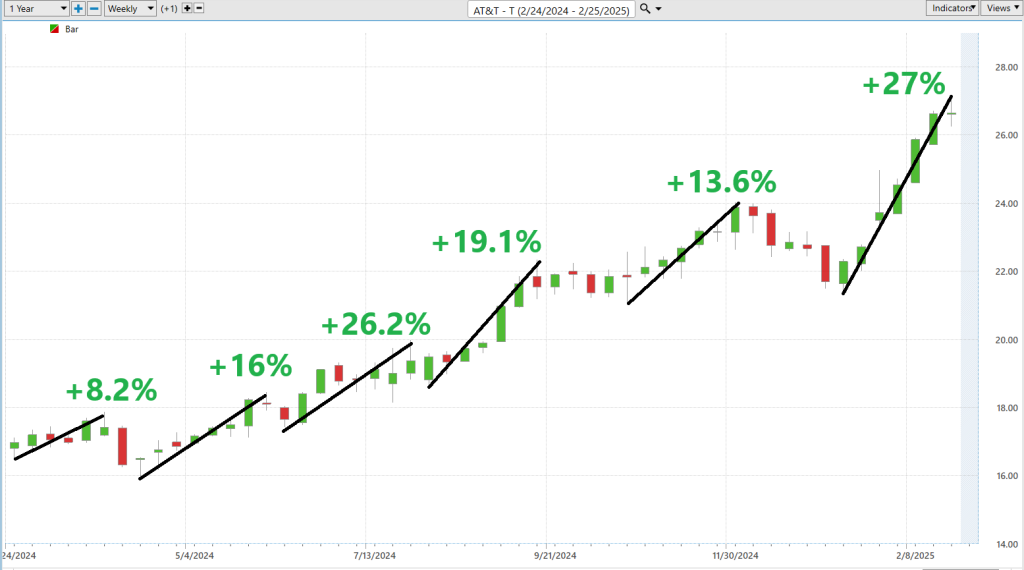
Now, let’s take a look at the best-case scenario:
Before you dive headfirst into trading AT&T ($T), take a deep breath and understand exactly what you’re getting into. This stock isn’t a smooth Sunday drive, it’s a rollercoaster with sharp turns, sudden drops, and the occasional burst of momentum. And if you don’t have a solid grasp on the ride ahead, you’re not trading — you’re gambling.
A best-case/worst-case scenario analysis isn’t just Wall Street jargon — it’s the difference between staying in the game and getting wiped out. Traders who don’t study a stock’s historical highs and lows are flying blind. Want to know what’s possible? Look at AT&T’s biggest rallies. Want to see the danger? Map out its steepest declines. These aren’t just numbers, they tell the story of how this stock moves, when it surges, and when it crashes.
But this isn’t just an academic exercise. This is strategy. These charts help you anticipate volatility, set smart stop-loss levels, and pinpoint profit targets. They’re not just statistics — they’re your blueprint for navigating this market without losing your shirt. A stock like AT&T demands respect, preparation, and discipline.
So, before you make a single trade, do your homework. Study the charts, understand the patterns, and arm yourself with real data.
Now, let’s take a look at the best-case scenario:
Followed by the worst-case scenario:
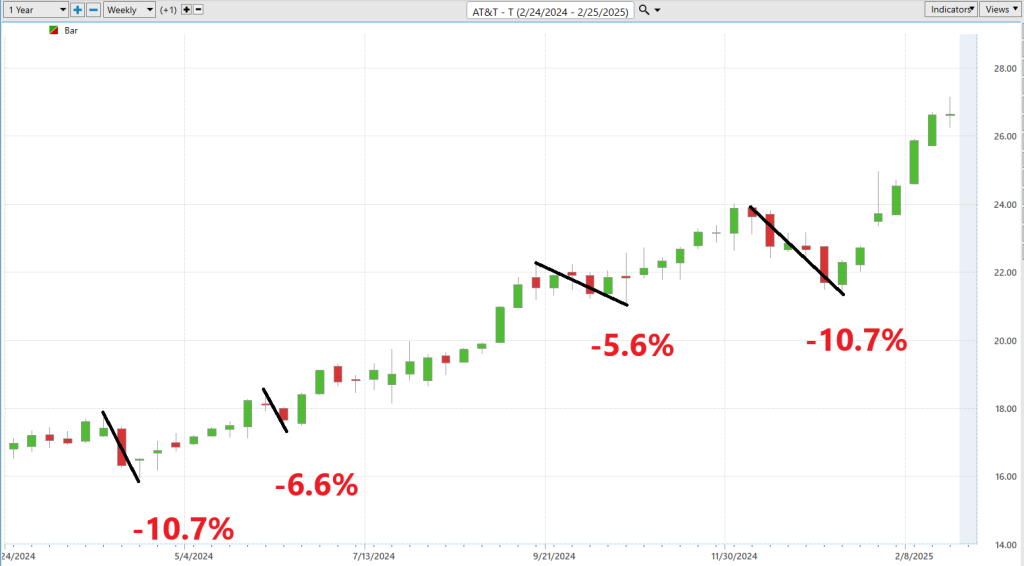
This kind of analysis cuts through the noise and delivers a crystal-clear picture of risk versus reward — the hard data that sharp traders rely on while everyone else chases headlines. By mapping out AT&T’s historical peaks and valleys, you’re not just looking at where it’s been — you’re identifying possible trajectories that could dictate its next move. This is the kind of tool that separates serious market players from casual spectators, offering a straightforward way to measure risk against potential reward.
Here’s what really matters: understanding the balance between risk and reward. Markets may be unpredictable in the short term, but history has a habit of repeating itself. If one side of the scale has consistently tipped in a certain direction, recognizing that pattern could be your best edge in positioning for what’s ahead.
Next, we zoom out to compare AT&T’s performance against the broader stock market indices. Traders need to see not just how $T has performed in isolation, but how it stacks up against the larger financial landscape. By analyzing its behavior across various time frames, we gain a real perspective on its volatility, resilience, and overall market positioning. This comparative lens helps determine whether AT&T moves in sync with broader market trends or if it has a habit of veering off-course, giving traders an informed basis to weigh its stability and growth potential relative to the competition.
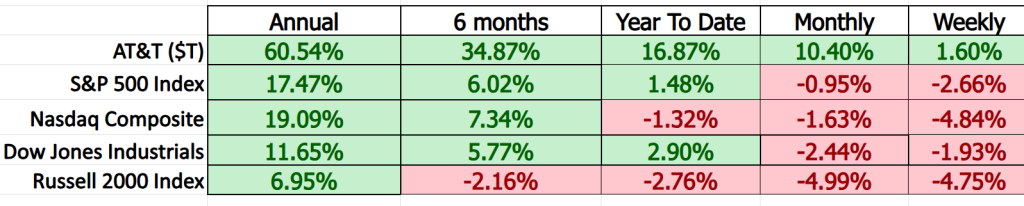
AT&T has handily outperformed the broader market across all time frames.
AT&T’s 5-year beta is approximately 0.73.
In simple terms, beta measures how much a company’s stock price moves compared to the overall market. A beta of 1 means the stock moves exactly with the market. A beta less than 1, like AT&T’s 0.73, indicates the stock is less volatile than the market. So, if the market goes up or down, AT&T’s stock tends to move up or down too, but not as sharply.
Think of it like this: if the stock market were a roller coaster, a high-beta stock would be a wild ride with steep climbs and drops. AT&T’s lower beta means it’s more like a gentler ride — still following the ups and downs, but with less intensity.
Vantagepoint A.I. Predictive Blue Line
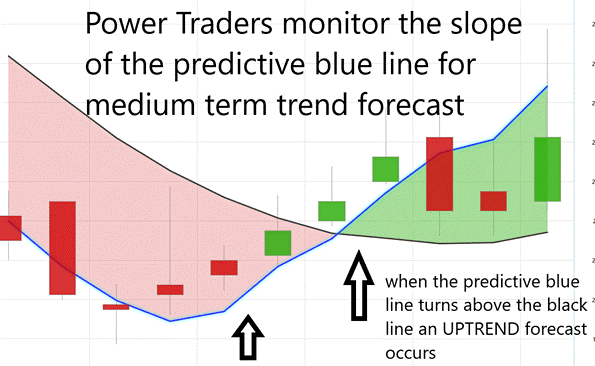
Step into the trading ring armed with VantagePoint Software’s A.I.-powered forecasts, and suddenly, you’re not just another trader, you’re the one with the unfair advantage. Imagine having a high-tech market assassin at your side, whispering the right moves before they happen. That predictive blue line? It’s not just some fancy visual — it’s your roadmap to outmaneuvering the crowd. If you’ve ever wished for a trading coach who knows what’s coming next, this is it.
Now, let’s break it down.
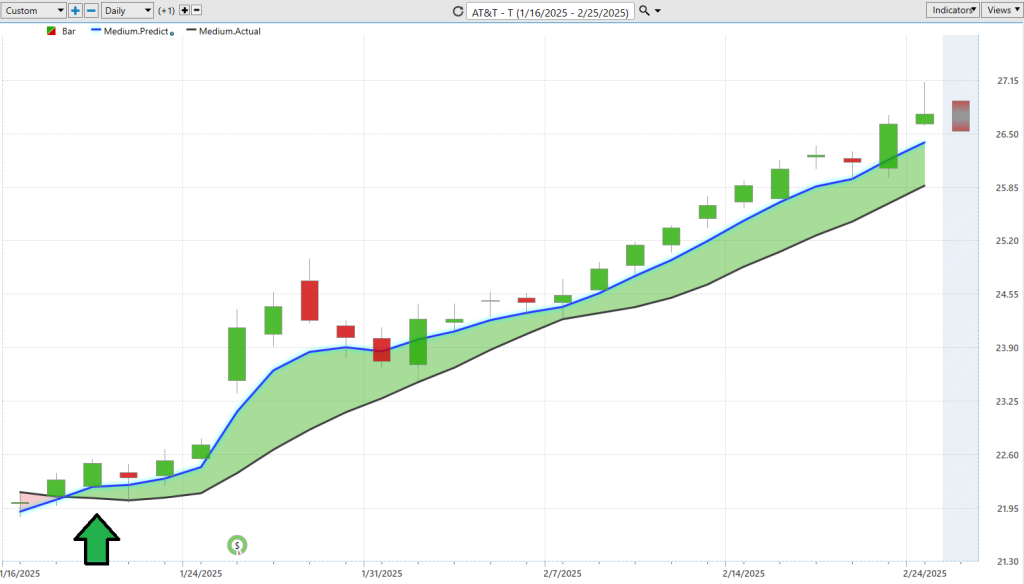
First, reading the slope. Think of this blue line like the market’s heartbeat. When it’s climbing, the stock is likely heading up — that’s your opportunity to get in. When it tilts downward, that’s your early warning system telling you things could go south fast — time to think about locking in profits or stepping aside.
Then, we’ve got the value zone — where real money is made. If $T’s price dips near or below that blue line during an uptrend, it’s practically screaming BUY NOW. But if the stock surges above the line in a downtrend, it’s like a flashing sign that says, “Reevaluate your position before it’s too late.”
Heed downward warnings. A downward slope in the predictive line isn’t just a casual heads-up — it’s like dark clouds rolling in before a storm. Ignore it, and you could find yourself caught in a financial hurricane. But if you pay attention, you can hedge, adjust, and avoid getting wrecked while everyone else panics.
Bottom line? It’s A.I. breaking down the market into a real, usable strategy. It strips away the guesswork, the emotional trading mistakes, and the gut-feeling gambles. Instead, you get clear, calculated insights that help you make bold, informed moves like a pro.
Neural Network Forecast (Machine Learning)
A neural network is not just some fancy tech gimmick — it’s an artificial brain built to spot what human traders miss. Think of it like a hyper-intelligent Wall Street shark, trained to rip through mountains of data, recognize hidden patterns, and adapt faster than any human ever could. It’s constructed from layers of interconnected algorithms, each one acting like a neuron in the human brain. These neurons pass information through multiple layers — some focusing on past price movements, others dissecting volume, momentum, economic reports, and even news sentiment. The deeper the network goes, the sharper it gets at predicting market movements before they happen.
Here’s how it’s built: First, it starts with raw, chaotic market data — millions of price points, economic indicators, and earnings reports. This data feeds into the first layer, where the network begins filtering out the noise, spotting correlations, and detecting anomalies. Next, the hidden layers do the heavy lifting, crunching numbers in ways no human trader ever could. They find relationships between variables that don’t seem connected at first — until they prove to be the key to predicting the next big move. Finally, the output layer delivers your opportunity to decide a verdict — buy, sell, or wait. And every time the network gets it right — or wrong — it learns and refines its strategy, just like a seasoned trader who’s spent decades in the trenches.
Think of a neural network as a gang of brainy algorithms on steroids, designed to mimic how the human brain processes information but at a speed and scale no human could match. This isn’t just some cold, hard logic — it’s a machine that learns, evolves, and adapts with every trade. It’s a digital detective, constantly hunting for clues, picking apart patterns, and refining its instincts like an unstoppable, high-frequency Wall Street wolf.
This isn’t your typical sidekick, this is a monster of market intelligence, optimized for one thing: winning. It chews through colossal data sets, unearths hidden patterns, and catches the market’s whispers that even the sharpest human traders might overlook.
This is trading on a whole different level. Every trade, every market condition, every price fluctuation feeds into this neural beast, making it sharper, faster, and deadlier with each passing day. This is what separates the amateurs from the assassins — a tool that gives you laser-focused insights that slice through market noise like a scalpel, giving you clairvoyant-level risk-reward vision.
But it doesn’t stop there. This neural network is watching the entire market, tracking global shifts, sector rotations, and economic tremors.
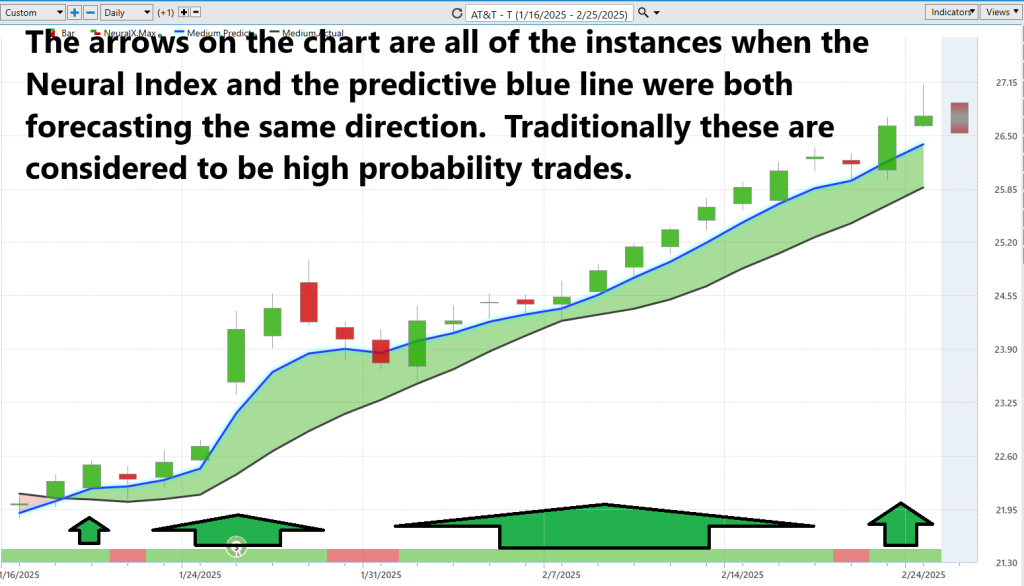
See those arrows? That’s where the Neural Network called the shots and lined up perfectly with the predictive blue line. Those are high-probability trades, the kind that separate the pros from the pretenders.
So here’s your move: Don’t just trade — DOMINATE. Strap this turbocharged, brainy behemoth onto your trading arsenal, and stop playing guessing games. It’s time to take control, leverage A.I. that actually works, and position yourself ahead of the market.
Neural networks are rapidly reshaping the trading landscape, leveraging vast troves of data with unprecedented speed and precision. These advanced systems are not just automating processes; they are actively reducing human bias and error, providing traders with a real-time pulse on market movements. The result? A shift in how decisions are made — where instinct and speculation are being replaced by data-driven intelligence. As these technologies evolve, they are fundamentally changing the nature of market participation, enabling traders to respond faster, smarter, and with greater confidence in an environment where milliseconds can mean millions.
Because at the end of the day, there are two types of traders: those who watch the market move… and those who see it coming before it happens. Which one do you want to be?
VantagePoint A.I. Daily Range Forecast
In the world of trading, timing is everything. Markets today are a battlefield — constant volatility, unpredictable swings, and algorithmic traders moving at lightning speed. If you’re not ahead of the curve, you’re already behind. These systems cut through market noise, decode complex patterns, and transform raw data into actionable intelligence.
So, let’s get into it. We’re about to break down the average trading ranges for $T — daily, weekly, and monthly — over the past year. This is how smart money moves, and if you want to trade like a pro, you better start paying attention.
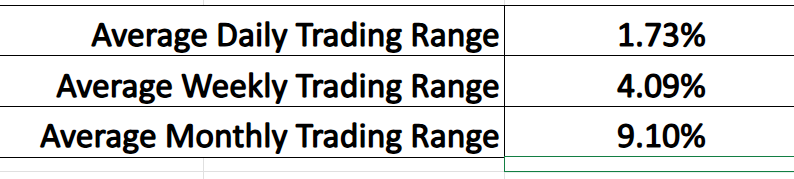
Look, these aren’t just numbers on a screen. They’re the pulse of the market, refined and sharpened by A.I. technology. Traders know that volatility is a given, but the real trick isn’t just understanding it — it’s mastering the timing of when to get in and when to get out. That’s where the VantagePoint A.I. Daily Range Forecast separates itself from the pack.
Study the VantagePoint A.I. Daily Range Forecast, and you’ll notice something — the trend is crystal clear. It’s laid out, day by day, cutting through the noise, giving traders the insight they need to capitalize on market swings before they happen. In a game where milliseconds matter, why trade blind when you can trade with precision?
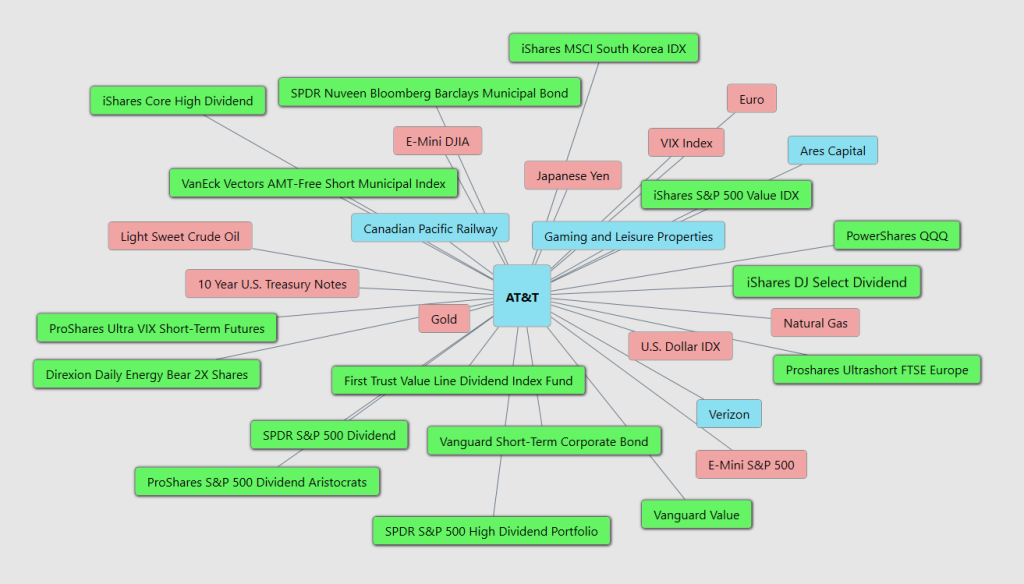
Intermarket Analysis
Intermarket analysis is the real secret sauce behind market moves — the thing that separates smart traders from the sheep who just follow price action blindly. It’s the study of how different asset classes—stocks, bonds, commodities, and currencies—interact and influence each other. Think of it as the ultimate cheat sheet for understanding why a stock like AT&T ($T) moves the way it does, beyond just earnings reports and corporate spin.
Now, let’s cut through the noise and get straight to what moves AT&T’s stock price ($T)—the big, juicy drivers that either send it soaring or crashing.
When interest rates drop and bond yields sink, AT&T’s massive $130 billion debt load suddenly becomes cheaper to manage. That means more cash flow, a rock-solid 4-5% dividend, and investors flocking to $T for a safe, income-generating play. Lower rates = happy dividend investors = stock climbs.
Now, throw in stable commodity prices (which signal a healthy economy humming along) and a weaker U.S. dollar (which juices AT&T’s international profits), and suddenly $T is on a roll. And if the broader stock market is in rally mode, lifting everything in sight, then guess what? Investors pile in, and $T’s price pops.
It’s like a perfect storm of green lights — every major factor lining up in AT&T’s favor.
Now, let’s flip the script, and suddenly the market turns against AT&T like a rigged casino.
Rising interest rates? Bad news. Higher borrowing costs make that $130 billion debt look like an anchor dragging the company down. Worse, Treasuries start paying out higher yields, making AT&T’s dividend look weak and unappealing by comparison. Dividend investors start dumping their shares, and the stock loses momentum.
Then, commodities take a nosedive. That’s a screaming red flag that economic growth is slowing, which means less demand for telecom services. People tighten their wallets, and AT&T’s revenue streams start looking fragile.
Next, a strong U.S. dollar slams the door on international profits. AT&T still makes money overseas, but when the dollar surges, those foreign earnings shrink when converted back. Less profit = less investor confidence = lower stock price.
And finally, if the S&P 500 goes into panic mode, the selling spreads like wildfire. Even so-called “defensive” stocks like AT&T get caught in the crossfire. Investors start thinking, “Why hold onto a debt-laden, slow-growth stock when everything’s tanking?” And just like that, $T gets slammed.
AT&T isn’t moving in a vacuum. Interest rates, commodities, the U.S. dollar, and overall market sentiment are the puppet masters pulling the strings. If you’re not watching them, you’re trading blind.
Smart traders track these key intermarket factors to stay ahead of big moves. When the conditions are right, you load up before the rally starts. And when the warning signs flash, you get out before the panic sets in.
Our Suggestion
AT&T’s latest earnings calls show a company leaning hard into fiber and 5G, while still wrestling with legacy business declines and debt pressure. In Q3 2024, they added 403,000 postpaid subscribers, kept churn tight at 0.78%, and grew fiber revenue by 17%, despite hurricanes and a labor stoppage clipping 50,000 potential sign-ups. Their DIRECTV sale to TPG is a strategic move to shed dead weight and refocus on high-margin broadband and wireless, and FirstNet’s 6.4 million connections are a quiet but powerful growth engine. They’re making progress, but they’re not bulletproof.
By Q4 2024, AT&T closed out the year with revenue up 1%, 1.7 million postpaid adds, and $4.8 billion in free cash flow. They’ve now logged seven straight years of 1 million-plus fiber additions. The DIRECTV deal is still in motion, potentially freeing up billions for share buybacks (up to $10 billion planned) or aggressive 5G expansion. But Business Wireline is still a mess, debt is shrinking but remains a weight, and softening phone sales could hurt Q1 momentum. AT&T’s betting everything on convergence — fiber plus 5G equals stickier customers and fatter margins — but execution has to be flawless. If interest rates, commodity prices, or market sentiment turn against them, this whole strategy gets a lot tougher.
Keep a close eye on AT&T ($T) as it presents numerous trading opportunities for the coming year. The next earnings call is scheduled for April 23, 2025, where Wall Street will be focusing on the company’s ability to sustain growth in its 5G and fiber segments, manage its debt reduction efforts, and navigate the challenges within its Business Wireline division. Analysts are particularly interested in how AT&T plans to achieve its projected low-single-digit consolidated service revenue growth for 2025.
Practice good money management on all your trades.
Let’s Be Careful Out There.
It’s not magic.
It’s machine learning.
Disclaimer: THERE IS A HIGH DEGREE OF RISK INVOLVED IN TRADING. IT IS NOT PRUDENT OR ADVISABLE TO MAKE TRADING DECISIONS THAT ARE BEYOND YOUR FINANCIAL MEANS OR INVOLVE TRADING CAPITAL THAT YOU ARE NOT WILLING AND CAPABLE OF LOSING.
VANTAGEPOINT’S MARKETING CAMPAIGNS, OF ANY KIND, DO NOT CONSTITUTE TRADING ADVICE OR AN ENDORSEMENT OR RECOMMENDATION BY VANTAGEPOINT AI OR ANY ASSOCIATED AFFILIATES OF ANY TRADING METHODS, PROGRAMS, SYSTEMS OR ROUTINES. VANTAGEPOINT’S PERSONNEL ARE NOT LICENSED BROKERS OR ADVISORS AND DO NOT OFFER TRADING ADVICE.


