


| This Week’s a.i. Stock Spotlight is TG Therapeutics ($TGTX) |
TG Therapeutics, Inc. ($TGTX) is making significant strides in the biopharmaceutical industry with a focused mission to develop and commercialize novel treatments for B-cell diseases. Founded in 2012 by Michael S. Weiss, this New York-based company has rapidly grown into a beacon of hope for patients battling these challenging conditions. With a dedicated team of around 200 employees, TG Therapeutics is at the forefront of innovation and transformation in healthcare.
Biotech companies are notoriously volatile, largely due to the immense financial and operational risks associated with their research and development processes. Developing a new drug can cost upwards of $2.6 billion and take more than a decade from initial discovery to market approval. This high cost stems from the extensive research and multiple phases of clinical trials required to ensure a product’s safety and efficacy. Only about 10% of drugs that enter clinical trials make it to the market, illustrating the high failure rate within the industry. Companies often spend years in the preclinical phase, conducting laboratory and animal studies before even reaching human trials, which are broken down into three phases. Each phase is progressively more expensive, involving more participants and complex procedures. Phase I focuses on safety, Phase II on efficacy, and Phase III on large-scale testing and comparisons to existing treatments. The failure of a drug in any of these stages can lead to significant financial loss, affecting a company’s stock price and investor confidence.
Moreover, the biotech market is subject to rapid changes in scientific knowledge, regulatory environments, and competitive landscapes. A company might invest heavily in a promising drug only to have a competitor develop a superior treatment, or changes in regulations might delay or halt the approval process. For instance, regulatory bodies like the FDA in the United States and the EMA in Europe have stringent requirements that can lead to delays or additional costs if more data is needed. Additionally, public and investor perception can be highly influenced by news of clinical trial results, both positive and negative. A single adverse event in a trial can lead to a sharp decline in stock prices, while positive news can result in significant gains. This susceptibility to external factors and the high stakes involved in every step of drug development contribute to the extreme volatility seen in biotech stocks .
TG Therapeutics was initially funded through a combination of venture capital and private equity, providing the financial foundation for its innovative pursuits. The company boasts a robust patent portfolio, securing its unique therapies and technological advancements. Michael S. Weiss, the founder, previously held executive roles at Keryx Biopharmaceuticals and XTL Biopharmaceuticals, bringing a wealth of experience to TG Therapeutics. The company has a key partnership with the Leukemia & Lymphoma Society, enhancing its research capabilities and outreach.
TG Therapeutics conducts numerous clinical trials worldwide, continually expanding the indications of its drugs and exploring new therapeutic possibilities. $TGTX has established multiple revenue streams through the commercialization of its cutting-edge pharmaceutical products. Their key profit centers include:
1. **Ublituximab** – An anti-CD20 monoclonal antibody.
2. **Umbralisib** – A PI3K delta inhibitor.
3. **Combination Therapies** – Utilizing both ublituximab and umbralisib to treat specific B-cell malignancies.
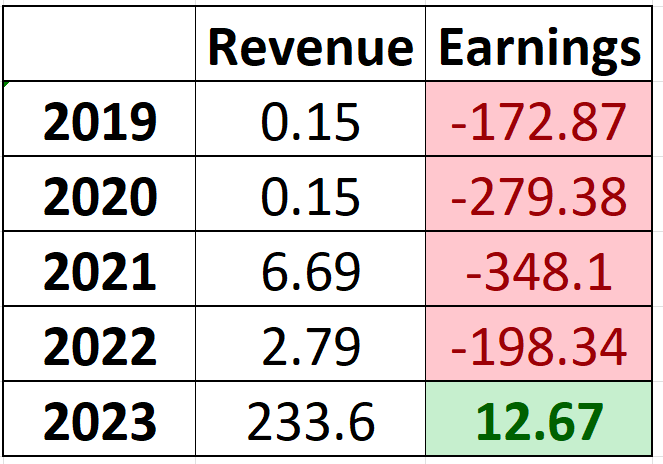
After years of development and strategic market penetration, TG Therapeutics achieved profitability in 2023, a significant milestone that underscores their successful product launches and market strategies. However, their road to profitability has been incredibly volatile from a revenue standpoint. Over the last 5 years they have grown revenue exponentially yet barely squeezed out a positive earnings year in 2023. The table below is in millions of dollars.
TG Therapeutics competes in a highly dynamic market, facing off against industry giants such as Gilead Sciences, AbbVie Inc., Bristol-Myers Squibb, Genentech, and Novartis. Despite the stiff competition, TG Therapeutics has carved out a niche with its unique therapies and strategic acquisitions. The history of successful biotech companies is one of massive volatility. All a trader or investor needs to do is study the long-term charts of companies like Amgen, Biogen, Regeneron Pharmaceuticals, Vertex Pharmaceutical and Gilead Sciences to immediately recognize this sector is not for the timid, faint of heart, or poorly capitalized.
When a clinical trial fails, it often means that the drug did not meet the necessary endpoints for efficacy or safety, rendering years of research and millions, sometimes billions, of dollars spent as losses. For instance, companies like TG Therapeutics, which spend heavily on the development and testing of new treatments, can see significant drops in their stock prices following negative trial results. This drop reflects investors’ reduced confidence and the anticipated financial losses due to the setback. The failure also signals the potential need for additional trials, which further increases costs and delays any potential revenue generation.
Beyond financial repercussions, clinical trial failures can lead to strategic shifts within a company. Resources must be redirected, and new priorities must be established. For smaller biotech firms, a single failure can be devastating, potentially leading to bankruptcy if they lack a diversified portfolio of projects or sufficient cash reserves. Larger companies might absorb the financial blow but still face delays in bringing new products to market, which can affect their competitive positioning. Additionally, failures can damage a company’s reputation, making it harder to attract new investment and partnerships. Regulatory setbacks can also occur, as agencies like the FDA may require more stringent oversight or additional data, complicating and prolonging the approval process for future trials.
These factors are critical for traders and investors to understand whenever they consider trading or investing in the biotech sector which is fraught with volatility. Risk management and position sizing are essential for anyone choosing to participate in this niche.
TG Therapeutics’ biggest opportunity lies in the expanding market for B-cell disease treatments. With a rising patient population and increasing acceptance of their therapies, the company is well positioned for significant market share gains. However, they face challenges, including regulatory hurdles, high R&D costs, and fierce competition from established players.
Over the past decade, TG Therapeutics has strategically acquired several companies to enhance its research and development capabilities. These acquisitions have been crucial in expanding their product pipeline and reinforcing their market position.
In the first quarter, the company raked in nearly $50.5 million in product revenue, all thanks to Briumvi, their breakthrough drug for treating relapsing multiple sclerosis (RMS). When you add in revenue from licenses, milestones, and royalties, the total reaches just under $63.5 million.
Briumvi, which received its first FDA approval at the end of 2022, has been a game-changer. This new revenue stream is a significant leap from the $7.8 million recorded in the first quarter of 2023, showcasing the drug’s rapid market acceptance and impact.
Because of these successes, TG Therapeutics managed to shrink its net loss considerably in the first quarter of 2024, posting a loss of $10.7 million or $0.07 per share, compared to a $39.2 million deficit from the previous year. This revenue surge led to a notable beat on earnings, with analysts expecting $54.6 million in revenue and a $0.04-per-share loss. Although there was a slight miss on the net loss, the overall financial results underscore the company’s strong market position and growth potential.
In summary, TG Therapeutics ($TGTX) has evolved from a high-risk biotech startup to a profitable and promising player in the B-cell disease treatment market. With a strong product pipeline, strategic growth initiatives, and increasing market acceptance, the company stands poised for continued growth, albeit with significant challenges and competition ahead. Investors should keep a close eye on TG Therapeutics as it continues to innovate and lead in the fight against B-cell diseases.
In this weekly stock study, we will look at an analysis of the following indicators and metrics which are our guidelines which dictate our behavior in deciding whether to buy, sell or stand aside on a particular stock.
- Wall Street Analysts Ratings and Forecasts
- 52 week high and low boundaries
- Vantagepoint A.I. Forecast (Predictive Blue Line)
- Neural Network Forecast (Machine Learning)
- VantagePoint A.I. Daily Range Forecast
- Intermarket Analysis
- Our Suggestion
While we make all our decisions based upon the artificial intelligence forecasts, we do look at the fundamentals briefly, just to understand the financial landscape that $TGTX is operating in.
Wall Street Analysts Forecasts
Based on 6 Wall Street analysts offering 12-month price targets for TG Therapeutics in the last 3 months. The average price target is $28.00 with a high forecast of $49.00 and a low forecast of $7.00. The average price target represents a 45.9% change from the last price of $19.19.
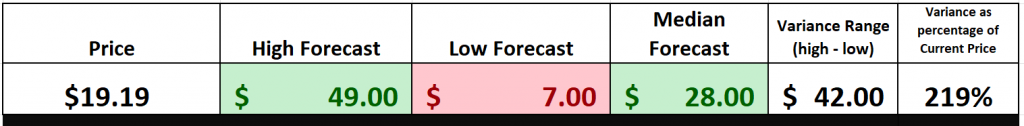
We teach traders to pay close attention to the variance between the most bullish and most bearish forecasts as this is where the source of volatility resides. Currently this variance is equal to 219% of the current price. While this is considered normal for a biotech stock it is about 8.5 times higher than the average price of the S&P 500 index. Buyer Beware!
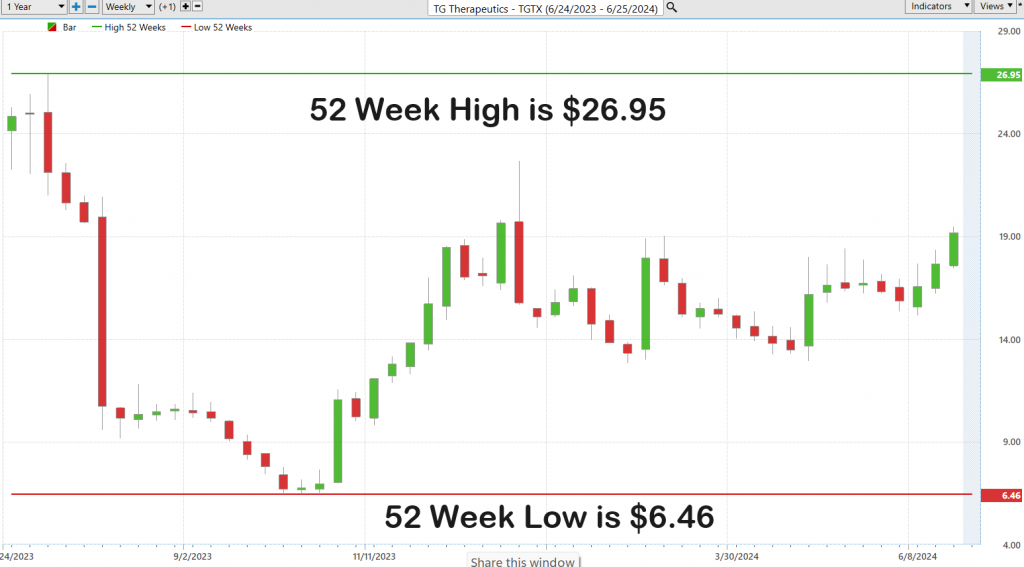
52 Week High and Low Boundaries
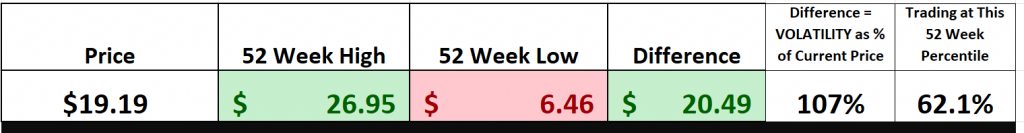
Over the last 52 weeks $TGTX has traded as high as $26.95 and as low as $6.46. The trading range for the last year has been $20.89. When you compare this trading range of $20.89 to the current price of $TGTX you are looking at a 109% level of statistical volatility. That means that it would be perfectly normal to see $TGTX trade + or – 20.49 points for where it is currently trading.
Traders and investors recognize the importance of the 52-week high and low boundaries as important metrics and a report card of the stock’s performance over the past year. We advise traders to pay very close attention to how a stock trades when it makes or approaches a 52-week boundary.
Three years ago, $TGTX was consistently the biotech darling making new 52-week highs and new 10-year highs. Then after some disappointing earnings news in April 2021, the company peaked and began an 85% decline.
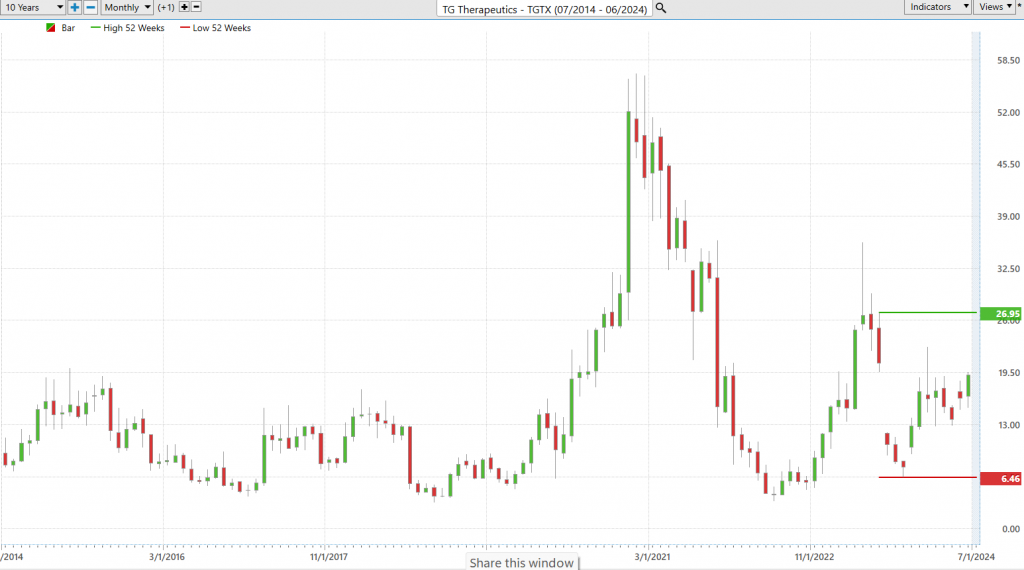
The 10-year chart provides a very solid perspective on the inherent volatility and risk associated with $TGTX. The gains or losses are potentially huge unless you know how to harness volatility.
When we focus on the 52-week chart we get a more granular perspective on how that level of volatility has manifested itself over the last 52 weeks.
Best-Case/Worst-Case Analysis
The most practical and meaningful thing that a trader can do before they enter a position is to look at a 52-week chart and compare the magnitude of the last years rallies against the size of the declines.
This simple exercise provides a very realistic understanding of risk and volatility. Often traders enter into a market with sky-high expectations and are completely oblivious to the risk.
Former heavyweight boxing champion Mike Tyson once proclaimed that “everyone has a plan until they get punched hard in the face.” By measuring the worst case and best-case scenarios over the last 52 weeks you immediately see the potential risk and reward of the trade you are contemplating.
Why is this exercise so crucial? Because it’s firmly rooted in practicality. Assuming the near future mirrors the recent past, we can anticipate similar volatility ahead. Instead of getting lost in theoretical abstractions, we gain an immediate, real-world understanding of risk and reward. This approach allows us to prepare and strategize effectively, ensuring we are well-equipped to navigate the market’s ups and downs.
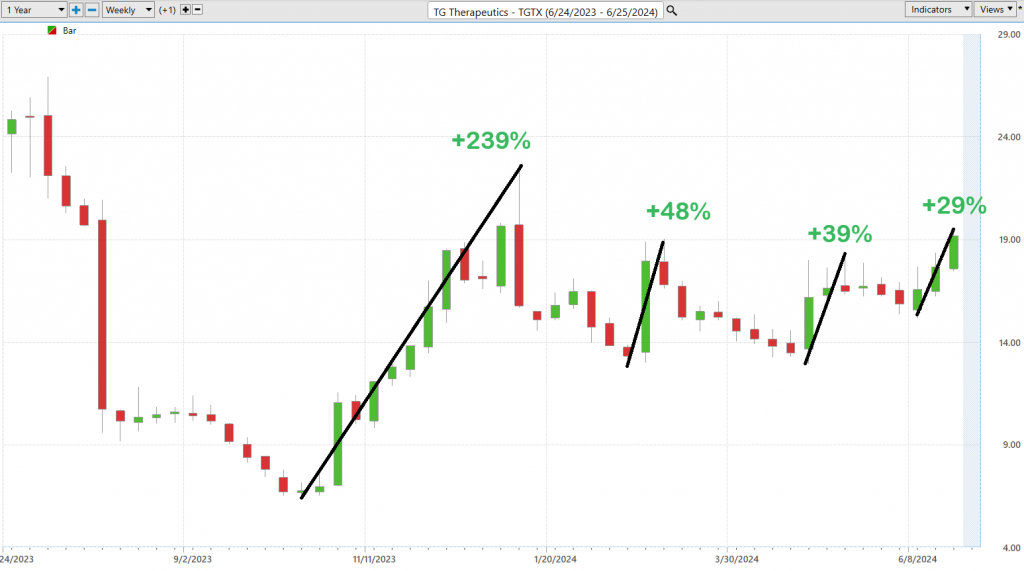
First, we take a look at the best-case scenario.
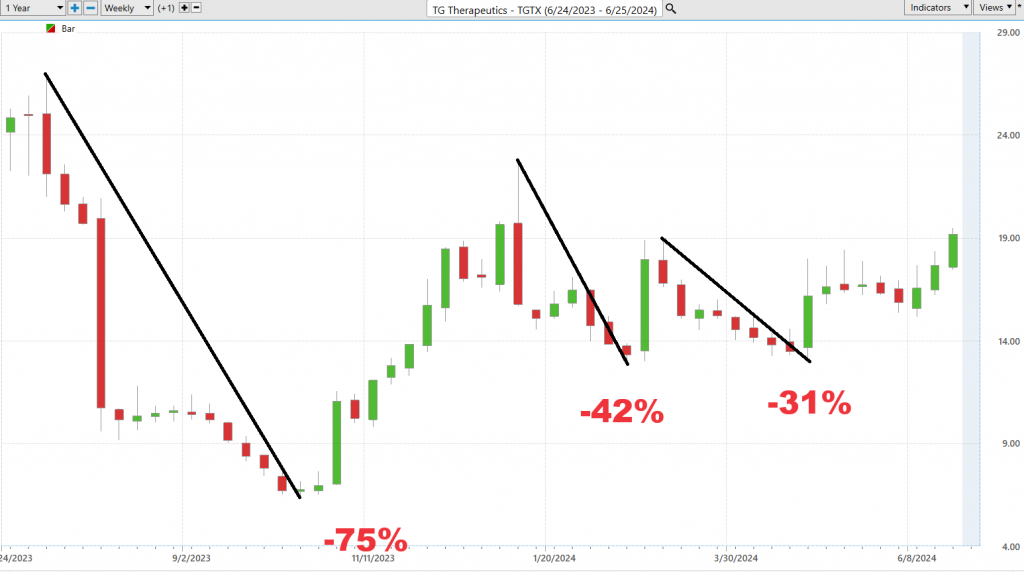
Followed by the worst-case scenario.
As we have pointed out already earlier in this analysis, the volatility of $TGTX is not for the timid. We expect this level of volatility to accelerate moving forward, and it is specifically in this arena why the ai forecasts which we will soon be covering can be so helpful.
For now, we can quickly see that moves from -75% to + 239% were considered normal over the past year.
Next, we compare TG Therapeutics ($TGTX) to broader stock market indexes. This comparison will reveal how $TGTX’s gains correlate with those of major stock indexes across various time frames. Such an analysis provides insight into the stock’s performance relative to the market, highlighting periods of alignment or divergence and offering a deeper understanding of $TGTX’s volatility and risk profile within the broader market context.
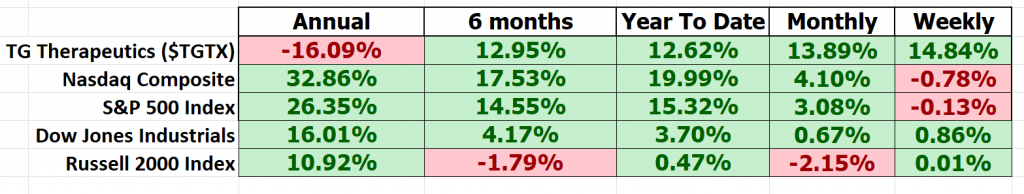
From this simple angle we can see that $TGTX has underperformed on the longer-term time frame, and outperformed on the weekly and monthly time frames.
I like to drill down and compare the performance of $TGTX to its immediate competitors.
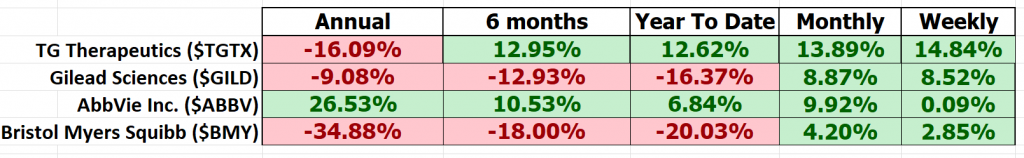
From this perspective I see two important things.
- The entire biotech sector is volatile.
- For the past 6 months $TGTX has outperformed all of its major competitors. This is impressive!
The beta of TG Therapeutics ($TGTX) over the last five years is 2.30. This high beta indicates that TGTX is 130% more volatile than the overall market, suggesting that the stock tends to experience larger fluctuations in price compared to broader market indexes. High beta stocks like $TGTX can offer higher returns but also come with increased risk, reflecting the inherent volatility in the biotech sector where clinical trial results and regulatory decisions can dramatically impact stock prices.
Vantagepoint A.I. Predictive Blue Line
Let’s cut to the chase and break down the core principles that are driving the way traders are navigating TG Therapeutics ($TGTX). This is all about understanding the flow—the trajectory of what we at VantagePoint like to call the ‘predictive blue line.’ This isn’t just some fancy chart mark; it’s your map to where the stock might head next, guiding us through the market’s twists and turns.
Here’s the game plan for tackling TG Therapeutics ($TGTX) stock with some cutting-edge tools at our disposal:
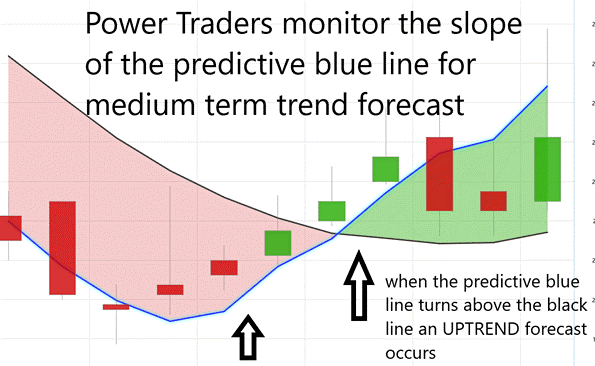
Trend Analysis: First up, we’ve got the predictive blue line. This isn’t just any line on a chart—it’s your insight into future market movements. A climbing blue line? That’s signaling a rally, a bullish push that suggests it’s time to consider getting in. On the flip side, if that line starts to dip, brace yourself for potential drops in TG Therapeutics’ stock price.
Value Zone Identification: Now, this is where the rubber meets the road. Around that predictive blue line lies what we call the ‘Value Zone.’ It’s all about timing here—buying right at or below this line when things are looking up, or selling when the stock peaks above it during a downswing. This is how traders aim to maximize gains and minimize risks.
Market Positioning: And let’s talk strategy when that blue line heads south. It’s a heads-up from the market, signaling possibly lower prices on the horizon. Savvy traders might take a step back, sitting out the turbulence, or they might hedge their positions to cushion any potential hits, keeping their portfolios safe while they navigate these choppy waters.
Thanks to advancements in artificial intelligence, like those powering the trend-forecasting capabilities we’re talking about, traders can now approach the market with a level of precision that was once unimaginable. This predictive blue line isn’t just a tool; it’s like a lighthouse guiding traders through the fog of daily stock fluctuations, pointing towards potentially profitable moves. Remember, in the high-stakes world of stock trading, being equipped with the right insights can mean the difference between sailing smoothly and getting lost at sea.
But here’s where it gets interesting: When that predictive blue line starts pointing down, it’s like a signal flare telling traders to brace for potentially lower prices. That’s your cue—either you sit this dance out or you hedge your bets.
Thanks to tools like VantagePoint Software, traders have got a secret weapon in their arsenal. This isn’t just another tool; it’s like having a financial GPS. Powered by artificial intelligence, it’s keeping an eye on that blue line for you, helping decipher whether you’re heading into a bull market or if it’s time to buckle up for a bear run.
Think of this blue line as your market compass, folks. When it’s climbing, that’s the market telling you it’s time to go bullish, to start thinking about buying. But when it dips, the market’s cooling off, maybe even warning you of a downturn, so it might just be the right moment to consider selling.
In today’s high-speed financial environment, having a tool that offers such clear insights into market trends? That’s not just useful; it’s gold. It’s about maximizing your potential for reward while tightly managing your risk. And in this game, being armed with the right tools isn’t just an advantage—it’s essential. Particularly when you are dealing in high volatility assets!
The predictive blue line from VantagePoint Software isn’t just another line on your screen—it’s a game-changer. This isn’t just about guiding—it’s about giving you a direct line to what’s happening in the markets. Real-time insights, folks, that’s what we’re talking about. This line, powered by some slick A.I. technology, lets you see the turns before they come, setting you up to ride the wave rather than getting swamped by it.
This A.I. isn’t just crunching numbers; it’s cracking the code on complex market relationships, forecasting shifts before they hit the mainstream. Imagine that—having a heads-up on market movements while everyone else is still looking at yesterday’s news. That’s the kind of edge VantagePoint gives you, letting you pinpoint the best spots to jump in or out, protecting your investments from sudden swings.
And it’s not just about flying solo with one indicator. No, sir. We look for confirmation, a second nod from other AI-driven tools to make sure we’re stepping into the right trades at the right times. That’s how you cut through the noise—with precision, confidence, and a whole lot of tech on your side.
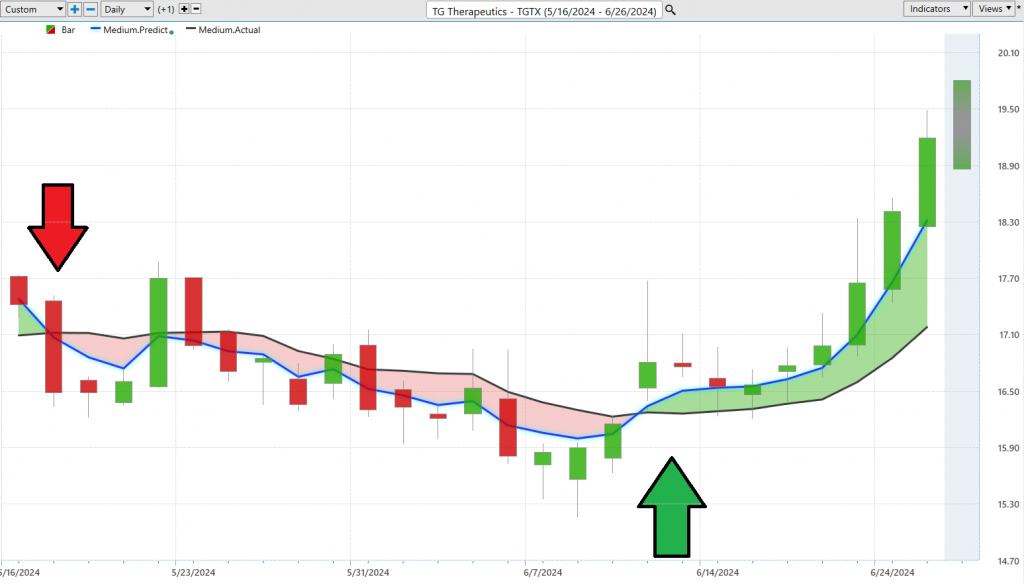
Study how this blue line has been slicing through the fog with TG Therapeutics ($TGTX). It’s clear, it’s sharp, and it’s right on the money. That’s how you navigate these turbulent markets, not just with any tool, but with a powerhouse that anticipates the market’s every move.
Neural Network Forecast (Machine Learning)
Alright, let’s dive into the power of neural networks, the high-tech marvels transforming the trading floors. Think of these as ultra-smart computational models—they’re like the human brain on steroids. These networks, with layers upon layers of nodes or ‘neurons,’ are crunching numbers and recognizing patterns just like our brains, but at a pace and precision that’s simply out of this world.
In the high-octane world of trading, neural networks are like having a superpower. They’re not just good—they’re exceptional at spotting complex patterns and relationships in market data that might slip past human traders or old-school methods. This is crucial because, let’s face it, the financial markets wait for no one. They’re fast, they’re furious, and they’re always changing.
The real game-changer here is how neural networks evolve. They learn from new data continuously, getting sharper and more effective. For traders, this means a toolkit supercharged with the ability to predict market trends, stepping up their decision-making game, tightening risk management, and potentially cranking up returns.
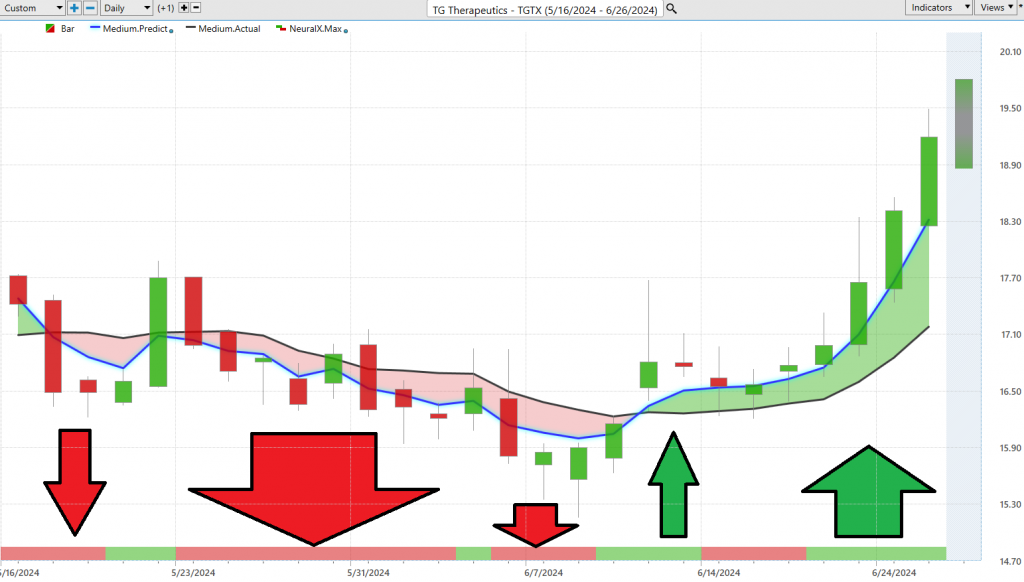
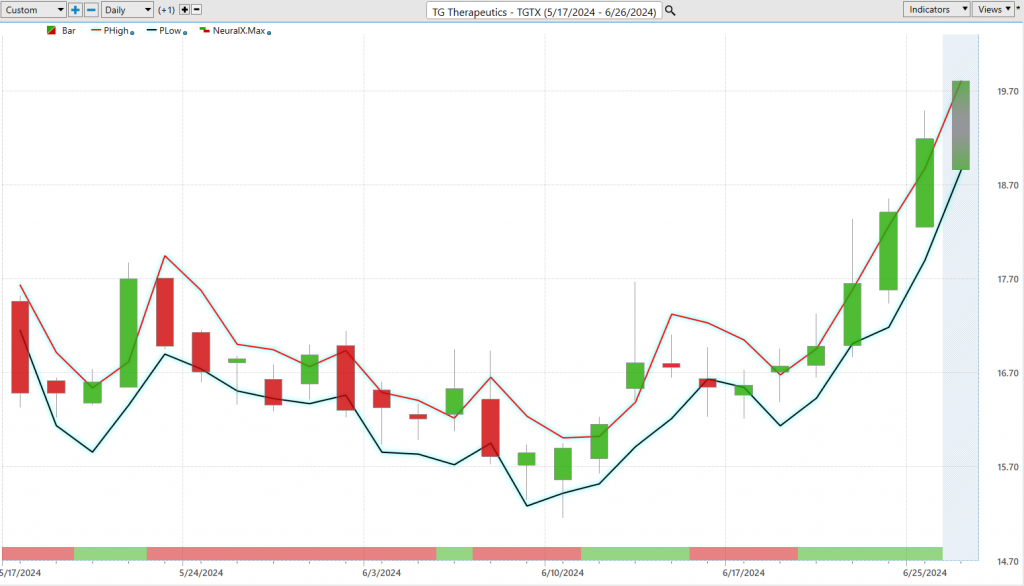
When you study the chart below pay attention to the green arrows at the base of the chart. Those are all of the moments when the ai forecast and the neural index were aligned and making the same forecast. We refer to these moments as the double confirmation setup which are very high probability trades.
At VantagePoint, Neural Networks aren’t just another feature—they’re a strategic asset. They light up the charts, green when the market’s ripe for the picking, red when it’s time to back off. And when you pair these networks with traditional tools like the Predictive Blue Line? That’s when the magic happens. You get a ‘double confirmation’ signal—a two-punch combo of insights that not only points traders to goldmine opportunities but also helps slice through market complexity with unmatched precision.
Observe how you study the chart below, how strategic the predictive blue line boundary is in defining value and the general trend.
This isn’t just advancement; it’s a revolution, elevating trading strategies to a whole new level. For traders aiming to harness the cutting edge of technology to dominate the markets, neural networks are indispensable. They’re not just changing the game; they’re rewriting the rules.
VantagePoint A.I. Daily Range Forecast
Regardless what is going on in the world, what is of supreme importance to a trader are two things:
- Trend Direction
- Price Level where they should buy or sell.
Everything else is noise.
Turn on the financial media and you will quickly come to realize that they have a 24-hour news cycle that they are trying to fill up with content. How much of that content is pertinent to you and protecting your wealth?
Let’s talk about one of the toughest nuts to crack in trading—knowing when to jump in and when to bail out. Market volatility can throw you for a loop, making those decisions even more challenging. For traders eyeing stocks like TG Therapeutics ($TGTX), nailing the timing means understanding the ebb and flow of daily, weekly, and monthly trading ranges—and then putting that knowledge into action.
Great traders recognize that the word opportunity is a moving target. Why? Because all markets are dynamic, and change based upon a multitude of factors.
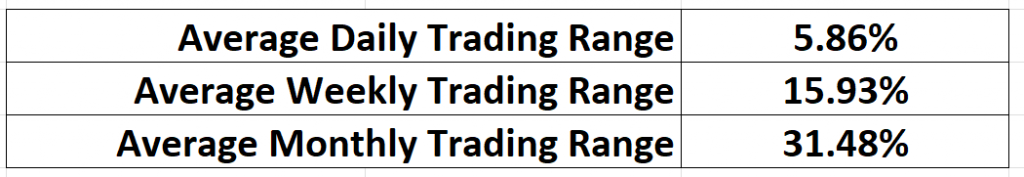
Over the past 52 weeks this is what the average trading ranges have looked like for $TGTX on a daily, weekly, and monthly basis.
But here’s the kicker: it’s not just about having the data; it’s about turning that data into winning strategies. That’s where the big guns like A.I., machine learning, and neural networks come into play. These technologies aren’t just fancy buzzwords—they’re your roadmap through the stormy seas of the financial markets. They give you clear, actionable insights into market trends and pinpoint trading ranges with remarkable accuracy, slashing the guesswork from your trading decisions.
This is the kind of intel that can give you the edge in your trading game.
But here’s the real scoop: it’s not merely about possessing vast amounts of data; the true art is in harnessing that data to craft unbeatable strategies. This is where the heavy artillery—A.I., machine learning, and neural networks—comes into play. These aren’t just high-tech jargon; they are indispensable tools, guiding you through the turbulent waters of the financial markets. With these technologies at your disposal, you gain crystal-clear insights into market trends and pinpoint precise trading opportunities with extraordinary accuracy, dramatically reducing the guesswork involved in your trading decisions.
Here is a chart of the VantagePoint A.I. daily range forecast over the past 2 months. Observe the exacting precision that is offered to Power Traders. This wisdom the critical role of these modern technologies in today’s trading world.
With this kind of detailed insight, traders can sharpen their game, strategically planning when to jump in and out of trades, boosting their confidence to sky-high levels. By tapping into advanced analytics, traders transform complex market data into clear-cut, actionable strategies, setting the stage for big-time growth even when the market throws curveballs. This precision—thanks to predictive analytics—becomes a game-changer for those looking to make a play on market dynamics, underscoring just how vital these advanced tech tools are in the modern trading arena.
In the current climate of market volatility, the VantagePoint A.I. Daily Range Forecast stands out as an essential tool for traders. With its unparalleled accuracy and comprehensive analysis, this technology provides short-term swing traders with a notable edge, enabling them to navigate the market with confidence. The tool offers detailed insights into expected daily market movements, clearly outlining market trends and anticipated trading ranges.
Such granularity allows traders to carefully plan their entry and exit strategies, significantly boosting their confidence. By harnessing advanced analytics, traders can convert complex market data into actionable strategies, paving the way for substantial growth even in unpredictable financial environments. The precision provided by predictive analytics is crucial for traders aiming to capitalize on market dynamics, highlighting the critical role of advanced technological tools in modern trading.
Intermarket Analysis
Intermarket analysis is a way for traders to understand how different markets, like stocks, bonds, commodities, and currencies, are connected and affect each other. Think of it like studying how different sports teams influence each other in a league.
For example, if the price of oil goes up, it might affect the stocks of companies that use a lot of oil, like airlines. Or if the U.S. dollar becomes stronger, it might impact the prices of goods sold in other countries. By looking at these relationships, traders can make better decisions about when to buy or sell stocks or other investments.
So, intermarket analysis is all about seeing the big picture and understanding how changes in one market can ripple through and impact other markets. This helps traders make smarter choices and try to stay ahead of the game.
This method dives deep into the relationships between different asset classes, showing how movements in one market can ripple through and influence others. It’s like understanding how a change in one part of an engine affects the whole machine. For traders, these insights are gold.
Take the classic example of stock prices and bond interest rates. There’s an inverse relationship here: when interest rates go up, stock prices often drop, and when rates go down, stocks tend to rise. Understanding this relationship can be a game-changer.
But let’s get real. Intermarket analysis isn’t just about crunching numbers; it’s about seeing the whole picture. It falls under the umbrella of technical analysis and can be approached through various strategies, including mechanical and rule-based methods. By leveraging these intermarket connections, traders unlock insights into major market trends and pinpoint those critical moments when everything shifts.
Picture this: you’re not just looking at individual market data, but you’re seeing how different markets interact—how they dance together. With this strategic vision, traders can anticipate price moves before they happen, riding the wave of interconnected market forces. This holistic game plan gives traders an edge, turning potential into profits in the high-stakes world of trading.
So, if you want to boost your trading game, understanding intermarket analysis is key. It’s not just about the numbers—it’s about the whole playing field and how different parts influence each other. With this knowledge, you’re not just reacting to the market—you’re staying ahead of it.
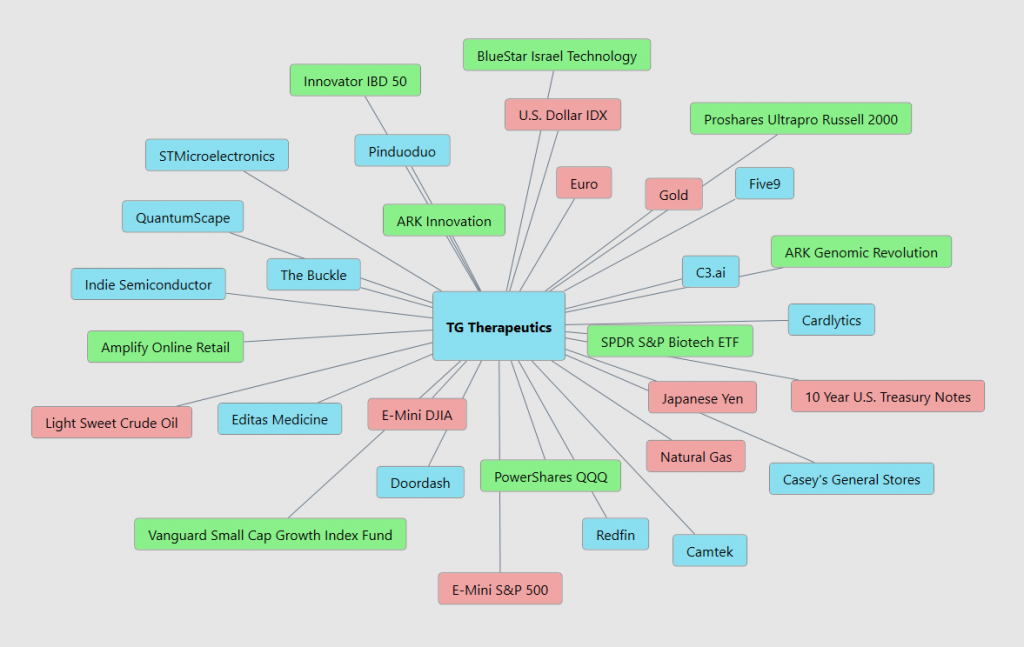
The chart above is a graphic representation of the 31 top key drivers of $TGTX price.
By diving deep into these diverse elements, traders can uncover the underlying forces that standard technical analysis often misses. This deeper level of insight is what separates the good from the great.
For example, a sudden spike in crude oil prices doesn’t just hit energy stocks—it reverberates across the transportation and manufacturing sectors. Understanding these intricate interconnections gives traders a powerful edge, allowing them to make well-informed decisions and identify potentially undervalued opportunities before the rest of the market catches on.
This isn’t just about reacting to the market; it’s about anticipating it. By grasping these complex relationships, traders can leverage emerging trends to enhance their profitability. It’s this kind of strategic foresight that turns market analysis into real financial success.
Our Suggestion
TG Therapeutics ($TGTX) exhibits significant volatility with a daily trading range of 5.86%, necessitating precise trend analysis and prudent position sizing for effective risk management. Traders should focus on both daily and broader time frame trends to navigate the substantial price swings. Smaller position sizes and strategic stop-loss orders are essential to mitigate potential losses from the high volatility.
The next earnings call for TG Therapeutics ($TGTX) is estimated to be on August 6, 2024, based on previous reporting schedules.
During the last earnings call on May 1, 2024, TG Therapeutics reported a net loss of $0.07 per share, which missed analysts’ expectations by $0.02. Despite this, the company posted strong revenue figures of $63.47 million, significantly surpassing the expected $54.60 million. This impressive revenue growth of over 713% year-over-year was largely driven by the successful commercial launch of their drug, BRIUMVI, which saw more than a 25% quarter-over-quarter increase in U.S. net revenue.
Strategically, TG Therapeutics secured a national contract with the Department of Veterans Affairs for BRIUMVI, indicating a stable future revenue stream. This contract, along with the company’s continuous efforts to highlight their advancements at prominent healthcare forums, positions TG Therapeutics favorably for future growth. However, the high volatility of $TGTX requires traders to employ robust risk management strategies to capitalize on these developments effectively.
We advise traders to follow the A.I. and daily range forecast for trading guidance. We also strongly advise you always practice solid money management on all your trades. There is heavy resistance at the 52-week highs. Pay attention to how price responds at this next level.
It’s Not Magic.
It’s Machine Learning.
Let’s Be Careful Out There!
Disclaimer: THERE IS A HIGH DEGREE OF RISK INVOLVED IN TRADING. IT IS NOT PRUDENT OR ADVISABLE TO MAKE TRADING DECISIONS THAT ARE BEYOND YOUR FINANCIAL MEANS OR INVOLVE TRADING CAPITAL THAT YOU ARE NOT WILLING AND CAPABLE OF LOSING.
VANTAGEPOINT’S MARKETING CAMPAIGNS, OF ANY KIND, DO NOT CONSTITUTE TRADING ADVICE OR AN ENDORSEMENT OR RECOMMENDATION BY VANTAGEPOINT AI OR ANY ASSOCIATED AFFILIATES OF ANY TRADING METHODS, PROGRAMS, SYSTEMS OR ROUTINES. VANTAGEPOINT’S PERSONNEL ARE NOT LICENSED BROKERS OR ADVISORS AND DO NOT OFFER TRADING ADVICE.


