


| This Week’s a.i. Stock Spotlight is United Aitlines ($UAL) |
United Airlines Holdings, Inc. ($UAL) is a major American airline headquartered in Chicago, Illinois. Founded in 1926, originally as Varney Air Lines by Walter Varney, United Airlines has grown into one of the world’s largest airlines. The company generates revenue primarily through passenger flights, with cargo services also contributing to its financials. United operates through various hubs across the U.S. and globally, serving numerous destinations, which form the backbone of its revenue generation.
United Airlines stands out in the aviation industry for several pioneering achievements and substantial contributions to airline operations and passenger experience. As one of the first airlines to incorporate the Boeing 777 into commercial service, United has continually pushed the boundaries of modern aviation technology. It is also a founding member of the Star Alliance, the world’s first and largest airline alliance, which highlights its leadership in global airline cooperation. Furthermore, United’s MileagePlus program set the standard as one of the initial comprehensive frequent flyer programs, enhancing customer loyalty through innovative rewards. The airline also operates one of the world’s largest Flight Training Centers in Denver, emphasizing its commitment to safety and excellence in pilot training. Additionally, until 2017, United was a major operator of the iconic Boeing 747, demonstrating its role in shaping the history of jumbo jets in commercial flight. These elements collectively underscore United’s unique position and innovative spirit within the airline industry.
United has multiple profit centers including passenger travel, cargo transport, and ancillary services such as maintenance and baggage fees. As of 2024, United employs around 96,000 people. The company became publicly profitable in the 1960s after a long period of growth and expansion post-World War II. Currently, United carries a substantial amount of debt, typical for large airlines due to high operational and capital expenses.
United’s stock has shown resilience with a 57% gain year to date, despite industry challenges. The airline is looking forward to its Q3 earnings with positive anticipation from investors. United has announced extensive plans to expand internationally, including services to new cities in Spain, Italy, and beyond, slated to begin in 2025. This move is part of a strategy to tap into less conventional travel destinations, which could draw in a niche market of travelers.
Following operational disruptions faced by Delta, United is positioned to capitalize on these missteps, potentially attracting customers seeking reliability.
United Airlines just shared how they did financially in the third part of 2024, and things look pretty positive! They made $1.3 billion before taxes and after some adjustments, about $1.4 billion. This means they’re doing better than they thought they would since their earnings per share was higher than expected at $3.33 instead of somewhere between $2.75 and $3.25.
They also talked about making more money because they’ve been smart about which flights to offer, focusing on those that make money rather than losing it. This helped them earn more in August and September. They also made more money from their regular and cheaper ticket options.
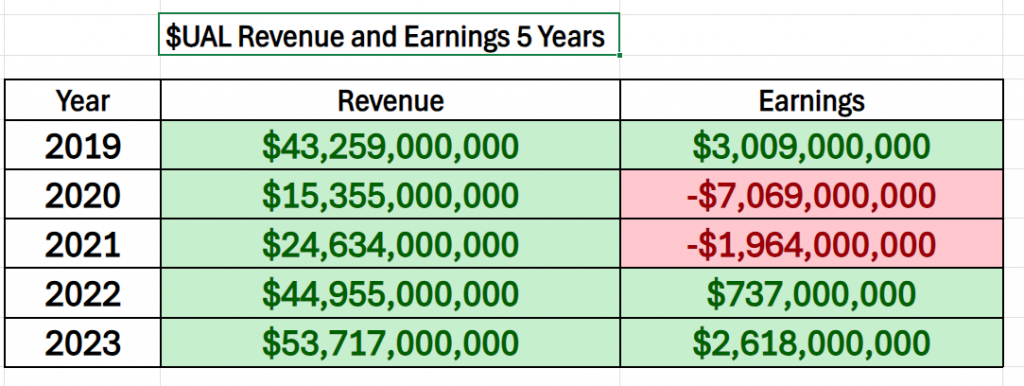
The following graphic shows you the financial volatility they have faced regarding revenue and earnings over the last 5 years. They are still generating less profit than they did pre-pandemic but have increased revenue by 24% since 2019.
Overall, United Airlines is doing well, and Wall Street is betting that the worst days are completely behind them, and they’re planning to keep improving how they serve their customers. They even teamed up with SpaceX to offer faster Wi-Fi on flights soon, which is pretty cool!
The biggest opportunity for United lies in its global expansion and recovery post-pandemic, tapping into new international routes and increasing demand for air travel. However, the risks include economic downturns, increased competition, fluctuating fuel prices, and unforeseen events like pandemics or natural disasters.
In this weekly stock study, we will look at an analysis of the following indicators and metrics which are our guidelines which dictate our behavior in deciding whether to buy, sell or stand aside on a particular stock.
- Wall Street Analysts Ratings and Forecasts
- 52 Week High and Low Boundaries
- Best-Case/Worst-Case Analysis
- Vantagepoint A.I. Predictive Blue Line
- Neural Network Forecast (Machine Learning)
- VantagePoint A.I. Daily Range Forecast
- Intermarket Analysis
- Our Suggestion
While we make all our decisions based upon the artificial intelligence forecasts, we do look at the fundamentals briefly, just to understand the financial landscape that $UAL is operating in.
Wall Street Analysts Ratings and Forecasts
Based on 12 Wall Street analysts offering 12-month price targets for United Airlines Holdings in the last 3 months. The average price target is $72.92 with a high forecast of $100.00 and a low forecast of $60.00. The average price target represents a 13.85% change from the last price of $64.05.
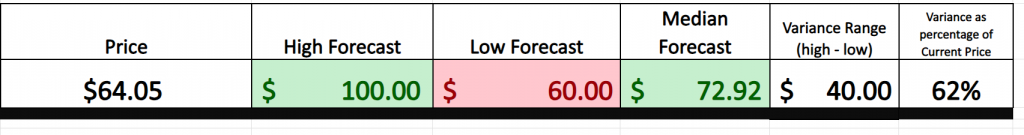
We always advise traders to scrutinize the disparities between the most optimistic and most pessimistic forecasts. This gap, now standing at $40 or 62% of the most recent closing price, is crucial. Such a stark variance is indicative of potential volatility already factored into the market price. Historically, this percentage often encapsulates the magnitude of unbroken market rallies or pullbacks, charting a trajectory from the troughs to the peaks.
This level of volatility is high and substantially greater than the anticipated price action in the broader stock market indexes as well.
52 Week High and Low Boundaries
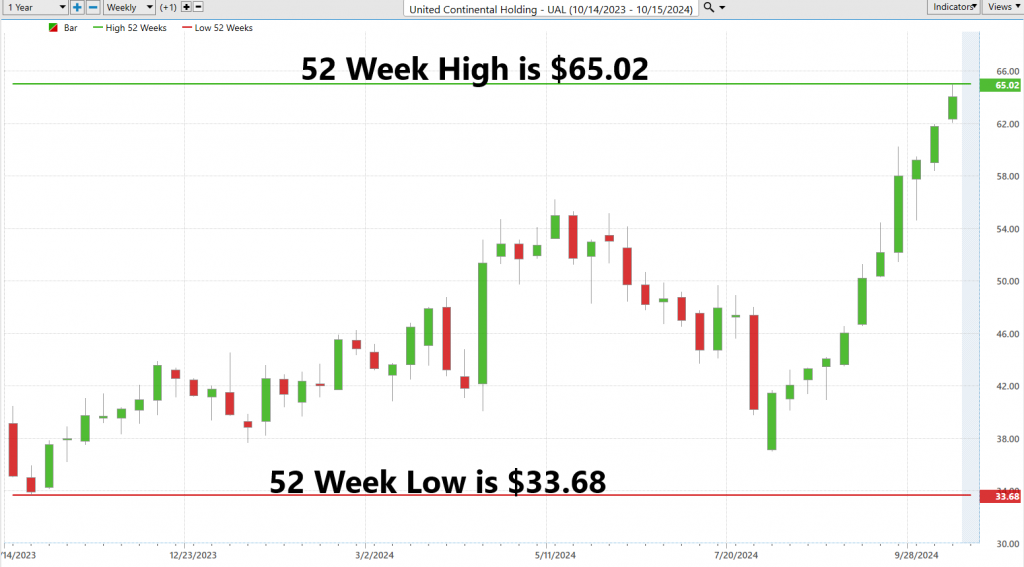
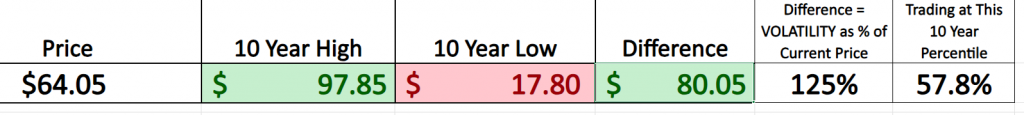
Over the last 52 weeks $UAL has traded as high as $65.02 and as low as $33.68.
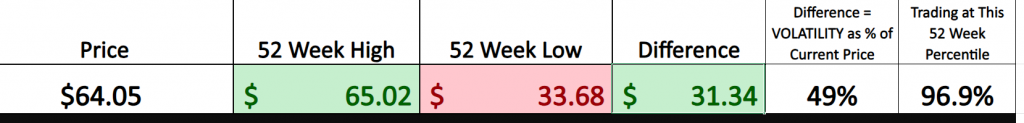
In our assessment, gauging the gap between a stock’s 52-week high and low offers significant insights. This range, reflective of the past year’s price movements, serves as a robust indicator of potential future volatility. This metric, rooted in recent market behavior, provides a foundational analysis tool for forecasting price dynamics. When we look at this variance of $31.34 as the annual trading range and compare it to the current price it represents a 49% historical volatility. Once again, this metric is very high especially when compared to the broader stock market indexes.
In our analysis, the 52-week highs and lows of a stock form a critical narrative arc that underscores the market’s sentiment and volatility over the last year. These metrics are not just numbers but pivotal benchmarks that tell us how high optimism or pessimism has reached, and they set the stage for what professional traders can expect. Consider the dynamics of a stock like $UAL, which when approaching or breaking through these historical peaks, signals robust investor confidence and continued market potential. This phenomenon is particularly compelling for stocks setting consistent new 52-week highs, as they reveal not only strength but sustained investor interest. Stocks, riding the wave of market approval, often continue their ascent, offering potentially lucrative opportunities for those looking to capitalize on this momentum. A glance at $UAL’s chart over the past year will vividly illustrate this trend.
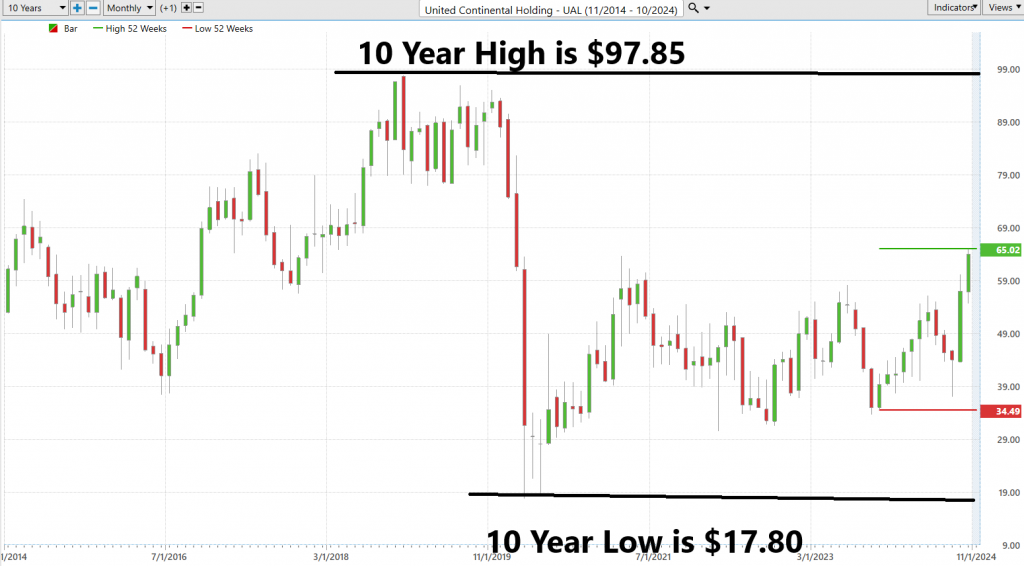
While the last 52 weeks have been stellar for $UAL we always advise that traders and investors look at the longer-term trend to understand and comprehend the longer-term volatility of this stock.
The 10-year monthly chart shows the level of volatility that $UAL experienced during the pandemic which forced the company into massive layoffs and flight cancellations. You can see in the longer-term chart $UAL dropped 80% in a period of months due to pandemic disruptions.
Best-Case/Worst-Case Analysis
One of the most practical and simple ways that a trader can understand the risk versus reward of a potential trade is to measure the rallies and declines of an asset over the past year. By doing so you begin to understand that if the future is anything like the recent past you will comprehend what volatility is and how it manifests in the price action.
To truly grasp market volatility, traders should not just skim but deeply analyze the historical price movements of stocks over the past year. This simple analysis involves mapping out the best and worst scenarios—capturing the best and worst—to visualize and understand the market dynamics thoroughly. This method allows traders to see beyond mere numbers and understand the real-world implications of market swings and their potential impact on investments and trading.
By examining both the strong rallies and the sharp declines, traders can gain a nuanced view of risk and reward. This isn’t just about making tactical moves; it’s about developing a comprehensive strategy that prepares one to handle market uncertainties effectively. The contrast between the heights of market optimism and the depth of pessimism reveals much about potential future movements and prepares traders to make informed, strategic decisions.
Such preparedness is crucial in navigating the often-tumultuous financial markets with confidence and strategic foresight. This methodical approach to understanding price actions—balancing the allure of potential gains against the sobering potential for losses—equips traders with the tools necessary for making prudent, well-informed trading choices.
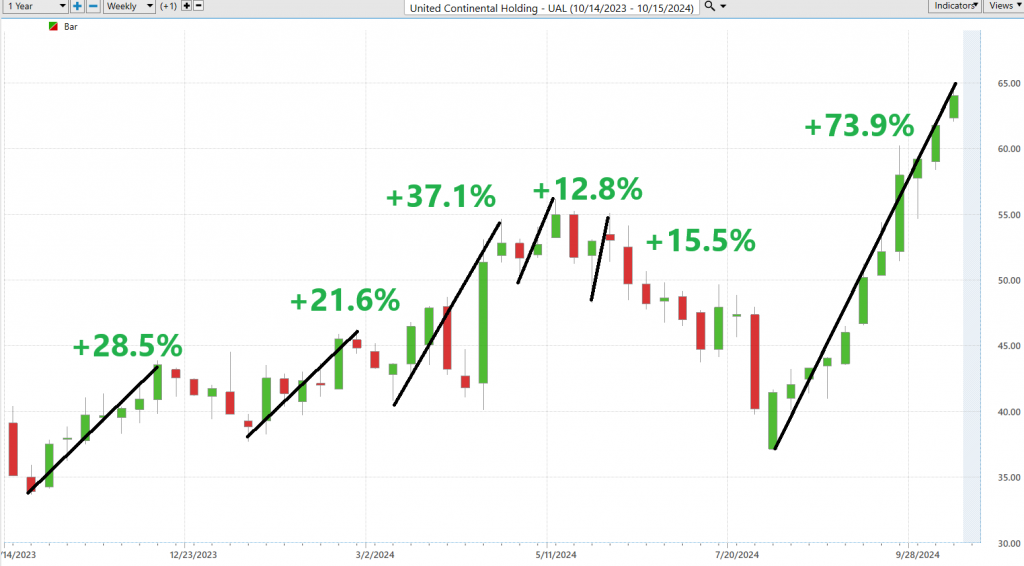
First, we evaluate the best-case scenario by measuring the strongest uninterrupted rallies.
Next, we look at the worst-case scenario which measures the magnitude of the largest uninterrupted declines.
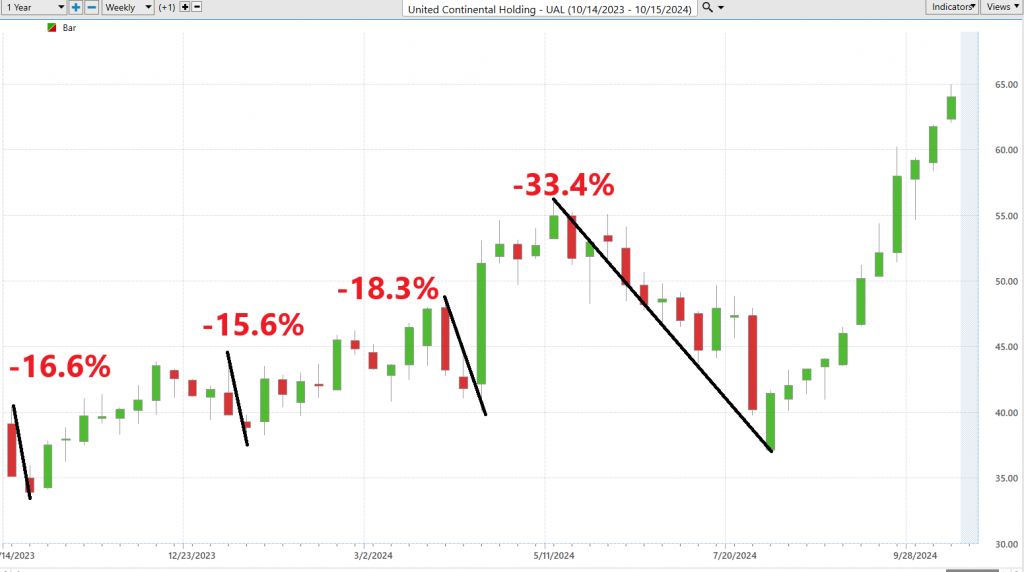
From these two charts any trader can understand the risk and reward potential in $UAL based upon last year’s price action.
Next, we would like to compare $UAL to the broader stock market indexes across multiple time frames. This exercise allows us to comprehend $UAL performance to the different stock market indexes.
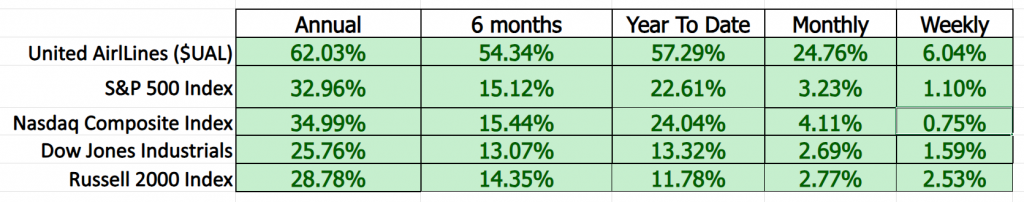
Our analysis shows a lucid depiction of United Airlines’ performance over the past twelve months, marking the stock’s trajectory through its ascents and declines, and underscoring the rapidity of these market movements. This sort of insight is invaluable for any serious trader. It’s not merely a matter of watching numbers fluctuate on a screen; it’s about a deep comprehension of the market forces at play. Understanding these dynamics can profoundly influence our trading strategies, providing us with the foresight needed to navigate the complexities of the market with confidence and precision.
The 5-year beta for United Airlines ($UAL) is 1.45, indicating that the stock is 45% more volatile than the broader market. This means that United Airlines’ stock tends to move 1.45 times more than the market in either direction. For investors or traders, a higher beta like this suggests a higher level of risk and potential reward. Specifically, when the market experiences an upturn, $UAL might see greater gains, but it could also face sharper declines during downturns. Understanding beta is vital as it helps assess the volatility risk associated with the stock relative to the market, influencing investment decisions based on individual risk tolerance.
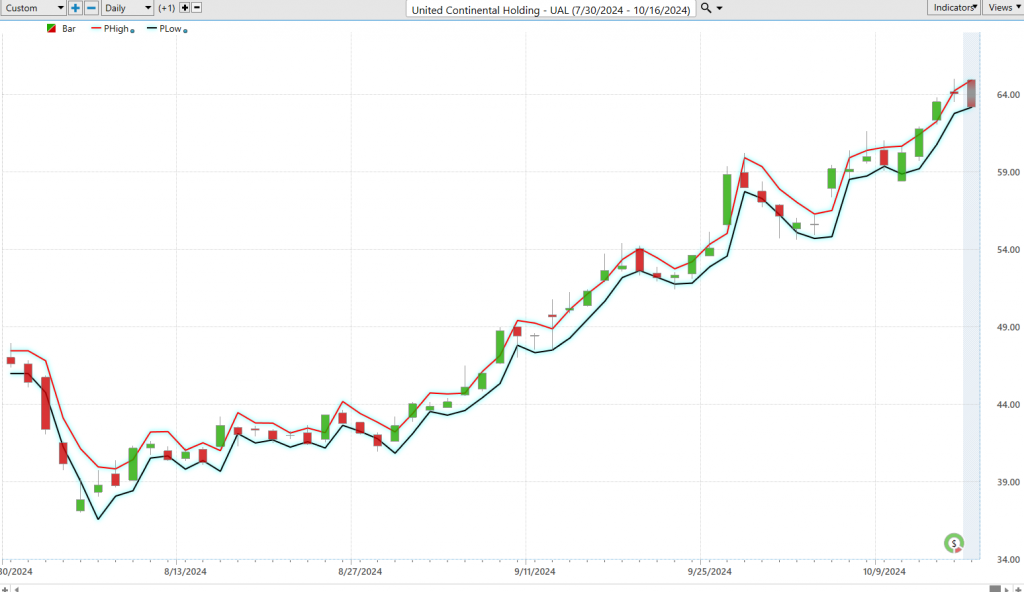
Vantagepoint A.I. Predictive Blue Line
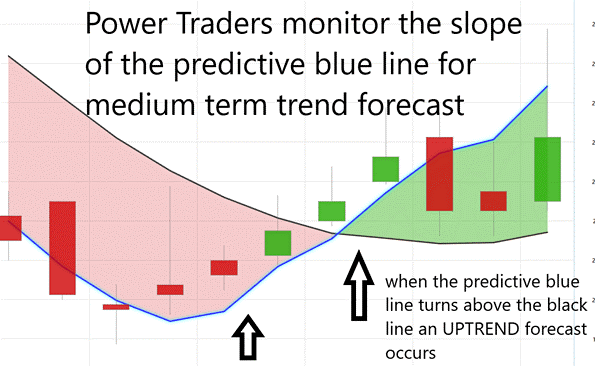
Let’s unpack the sophisticated strategy behind A.I. market predictions for $UAL, powered by VantagePoint Software. Central to this approach is the predictive blue line, a marvel of artificial intelligence combined with intermarket analysis, which serves as a beacon guiding us through the often-turbulent financial market waters.
Focus on the slope of this predictive blue line and its interplay with the stock’s price. A key indicator to watch is when the blue line crosses above the black line, which signals a shift in market trend.
Here are the core principles to guide you:
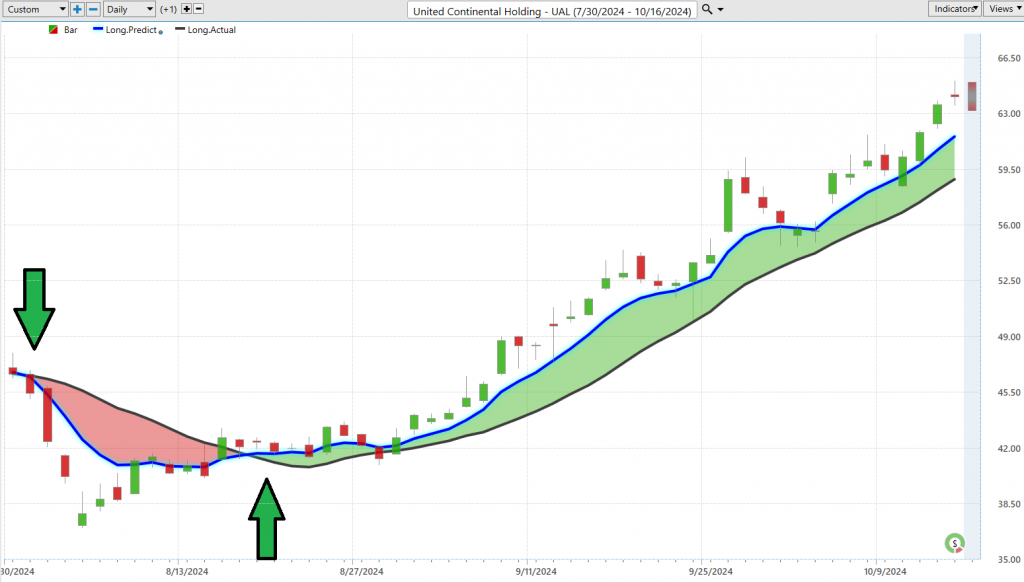
– The trajectory of the predictive blue line dictates the trend direction for $UAL, charting the course for potential market movements.
– The ‘Value Zone’ emerges as a critical area where traders might consider buying opportunities when prices dip to or below this predictive blue line, or conversely, think about selling during a downtrend when prices rise above it.
– A downward slope in the predictive blue line warns of potential price declines, advising traders to consider scaling back or hedging their investments.
With its cutting-edge A.I., VantagePoint Software continually provides traders with essential trend forecasts by monitoring changes in the slope of the predictive blue line, ensuring that investors are well-prepared to navigate market shifts.
In today’s dynamic trading environment, market participants are on a perpetual quest for tools that sharpen their investment decisions. VantagePoint Software, at the forefront of applying artificial intelligence to financial markets, provides such a resource, equipping traders with critical insights into potential risks and rewards. Central to its utility is the predictive blue line — a guide that signals upcoming market trends. An upward trajectory of this line suggests a bullish trend, heralding buying opportunities, whereas a downward slope may indicate a bearish outlook, advising caution or a potential sell-off. This sophisticated tool does more than merely forecast market direction; it strategically informs traders of optimal timing for transactions, thereby enhancing their opportunities for substantial returns.
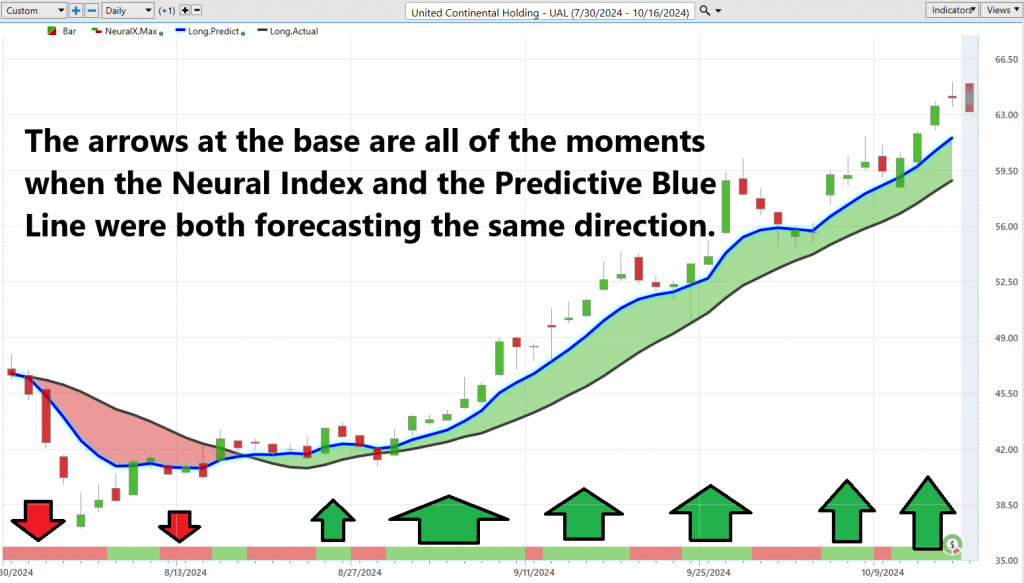
Neural Index (Machine Learning)
Think of a neural network like a giant brainstorming session, where each participant is a node, all interlinked in a vast web, just like neurons in the human brain. These nodes collaborate, analyzing vast amounts of data—stock prices, trading volumes, market trends—and learn from it to identify patterns much like a seasoned detective piecing together clues from a crime scene.
Now, why does this matter for traders? Because these networks are the secret weapon in today’s high stakes trading environment. They cut through the noise, recognize complex patterns that the human eye might miss, and guide traders with insights on the best times to buy and sell. This isn’t just about making educated guesses; it’s about making informed, strategic decisions that can lead to significant financial gains.
Neural networks are revolutionizing the trading floor, offering a combination of speed, accuracy, and continual learning. They minimize human error, ramp up prediction accuracy, and keep traders one step ahead by providing real-time insights into emerging market trends. Imagine having a supercharged co-pilot who’s always learning and adapting, ensuring that you’re equipped to make the best moves in a rapidly changing market landscape.
This portrayal emphasizes the transformative impact of technology on trading, resonating with Payne’s enthusiastic advocacy for leveraging cutting-edge tools to empower financial decision-making.
VantagePoint Software Daily Price Range Prediction
Let’s get right to the heart of the matter. In the world of trading, timing isn’t just a perk—it’s the entire ball game. For the Power Traders tuning in, I’m talking about leveraging something like the VantagePoint A.I. Daily Range Forecast. This isn’t just another tool; it’s the secret weapon that helps pinpoint the exact moments to dive in or step back—essentially, it can make or break a trade.
Now, we all know volatility is like the market’s shadow, always lurking. But having mountains of data isn’t enough these days. You’ve got to morph that data into something you can act on. Enter the heavy hitters: A.I., machine learning, and neural networks. These aren’t just fancy terms to toss around at cocktail parties; they are critical in sharpening your trading edge, cutting through the market noise to deliver clear and precise forecasts.
The challenge? It’s all about applying this data dynamically, in real-time, to nail those crucial entry and exit points. That’s where tools like VantagePoint’s A.I. software become invaluable.
Here are the daily, weekly, and monthly average trading ranges for $UAL over the past year.
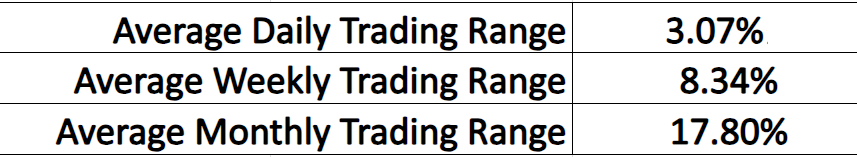
But what counts in the trading world is identifying those perfect moments for entry and exit.
Look at the Daily Range Forecast chart — this isn’t just any tool. For short-term swing traders, it’s like a predictive oracle, charting out the expected movement for each trading day. In the swift arena of trading, precision isn’t just nice to have; it’s essential. The VantagePoint A.I.’s Daily Range Forecast is powered by the latest tech to decode each trading session’s nuances. Think of it as your personal guide, helping to steer through market volatility and identify optimal trading spots. In this game, staying ahead isn’t just useful, it’s crucial.
Intermarket Analysis
Intermarket analysis is a key player in the financial playbook, giving us a deeper look at how different markets—like stocks, bonds, commodities, and currencies—dance together. It’s not just about looking at these markets in isolation; it’s about seeing the whole field play out, understanding the interactions that drive movements across the board. Pioneers like John Murphy have really opened our eyes to how shifts in one market can signal shifts in another, giving traders the kind of foresight needed to stay ahead.
Take United Airlines, for example. The interplay between market sectors is critical here. When we see interest rates climb, the cost of borrowing ticks up too, which can squeeze corporate profits and cool down investor enthusiasm for stocks like $UAL. And let’s not overlook the impact of the U.S. dollar—its strength plays a pivotal role not just in tech and finance but ripples through to commodities as well, affecting everything from fuel prices to international travel costs.
Lou Mendelsohn has taken this a step further by integrating A.I. with tools like VantagePoint, harnessing these intermarket insights to steer traders through market dynamics with unprecedented precision. So, for a giant like United Airlines, understanding these connections isn’t just beneficial, it’s essential for navigating the complex currents of today’s financial markets.
Intermarket analysis can be thought of as a strategic approach to financial markets, akin to conducting a comprehensive investigation across various financial sectors. Essentially, this involves examining the relationships between different financial markets such as stocks, bonds, currencies, and commodities (like oil and gold). Each of these markets influences the others, much like how weather patterns in one region can impact conditions in another area.
For traders, engaging in intermarket analysis involves analyzing these connections to predict future market movements. For instance, a rise in oil prices might negatively impact the stock prices of companies with high oil dependency, such as airlines. Understanding these dynamics allows traders to make more informed decisions about buying or selling assets based on the interplay between these markets.
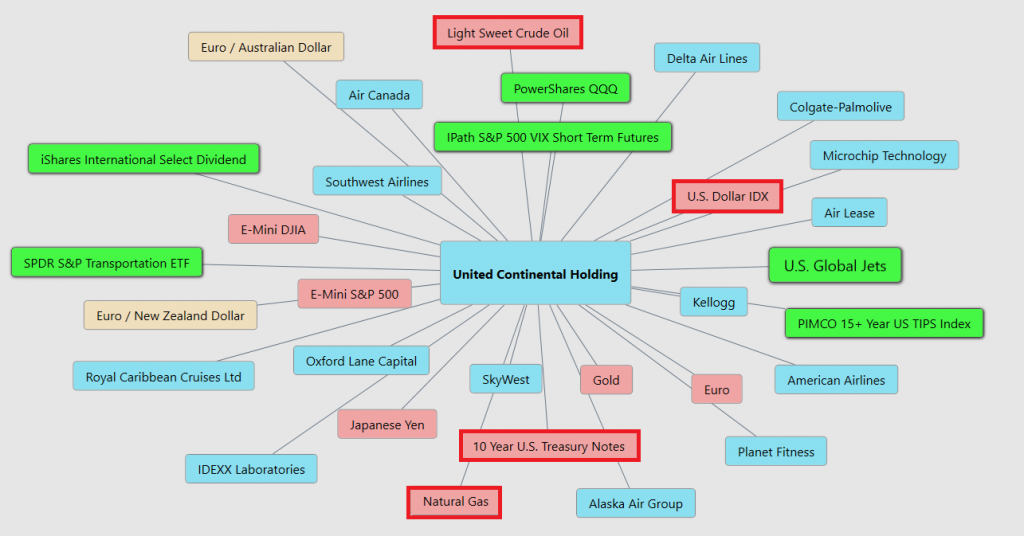
The graphic below shows the 31 key price drivers of $UAL.
In today’s global economy, being adept at intermarket analysis is crucial for identifying broader market trends and seizing trading opportunities. This analytical method provides insight into the causal relationships between different market sectors, enabling traders to anticipate significant shifts and strategize accordingly.
Our Suggestion
As we’ve seen, lower interest rates can significantly boost both consumer and corporate travel, injecting fresh vigor into an airline industry that is, by its very nature, highly cyclical. The cycle typically unfolds as follows: airlines like United see an uptick in passenger numbers and load factors, allowing them to raise ticket prices in response to robust demand. This, in turn, leads them to expand their routes to capitalize on these favorable market conditions.
However, the industry’s fortunes can quickly reverse. A downturn in demand puts immediate pressure on load factors, pricing, and ultimately, profitability. The real test for airlines is their discipline in reducing capacity swiftly enough to prevent a steep decline in profits. This past spring and summer, the market’s nerves were frayed over such concerns, particularly as talk of overcapacity by major carriers like United Airlines dominated headlines. Moreover, incidents like the July 2024 CrowdStrike disruption, which led to widespread flight delays and cancellations, only heightened Wall Street’s anxiety.
Yet, with interest rates now peaking and poised to decline, there is renewed optimism. Lower borrowing costs typically bolster consumer discretionary spending, which could spell good news for the airline sector. Additionally, an uptick in the global economy spells even better news for higher-margin corporate travel sectors, with carriers like United and Delta well-positioned to benefit.
Use the daily forecast for shorter term trading opportunities.
Practice good money management on all of your trades.
Let’s Be Careful Out There!
It’s Not Magic.
It’s Machine Learning.
Disclaimer: THERE IS A HIGH DEGREE OF RISK INVOLVED IN TRADING. IT IS NOT PRUDENT OR ADVISABLE TO MAKE TRADING DECISIONS THAT ARE BEYOND YOUR FINANCIAL MEANS OR INVOLVE TRADING CAPITAL THAT YOU ARE NOT WILLING AND CAPABLE OF LOSING.
VANTAGEPOINT’S MARKETING CAMPAIGNS, OF ANY KIND, DO NOT CONSTITUTE TRADING ADVICE OR AN ENDORSEMENT OR RECOMMENDATION BY VANTAGEPOINT AI OR ANY ASSOCIATED AFFILIATES OF ANY TRADING METHODS, PROGRAMS, SYSTEMS OR ROUTINES. VANTAGEPOINT’S PERSONNEL ARE NOT LICENSED BROKERS OR ADVISORS AND DO NOT OFFER TRADING ADVICE.


