


Imagine you have some money saved up, and you’re excited to start investing or trading to make it grow. You hear about all the success stories of people making big bucks in the stock market or with cryptocurrencies like Bitcoin. But here’s the thing: for every success story, there are also stories of people losing money because they didn’t understand the risks involved. Knowing how to balance the potential rewards with the risks is crucial. Without this understanding, you might end up making decisions that could hurt your finances instead of helping them. This is where understanding risk and reward becomes essential.
Let me start with a simple analogy to try and explain risk and reward.
Imagine a gambler playing a simple game with a single die. Every time he rolls a 6, he wins $100. Sounds like an easy way to make money, right? But here’s the catch: to really know if this game is a good idea, we need to know how much he loses every time he doesn’t roll a 6.
Let’s break it down: The die has six sides, so the chance of rolling a 6 is 1 out of 6, or about 16.67%. That means the other 5 times out of 6, or 83.33% of the time, he’s losing money. If he loses $20 every time, he doesn’t roll a 6, we can start to see a clearer picture.
In investing and trading, understanding both the potential gains (reward) and the potential losses (risk) is crucial. Just like the gambler needs to know his losses, investors need to understand the risks associated with their investments. This is where tools like the Sharpe Ratio come in. The Sharpe Ratio helps quantify risk and expected returns, allowing you to compare different investments. It shows you how much return you’re getting for the risk you’re taking, helping you make smarter decisions and choose investments that offer the best balance between risk and reward.
So, how do you figure out if an investment is worth the risk? The Sharpe Ratio compares the returns of your investment to the risk-free rate (like what you’d get from a super safe savings account) and then looks at how much the returns fluctuate. By using the Sharpe Ratio, you can see if an investment is giving you good returns for the amount of risk you’re taking, or if you might be better off looking for other opportunities. This metric can help you make smarter, more informed decisions about where to allocate your money, aiming for the best possible balance between risk and reward.
You’ve probably heard seasoned investors and market analysts talk about risk-adjusted returns. This concept is crucial in understanding the true performance of an investment because it factors in the risk you take to achieve those returns. Investments can certainly be evaluated based on their projected returns alone. But if you want to get the full picture, you need to consider how much risk you’re taking with each investment, whether it’s a single stock or your entire portfolio. This is where risk-adjusted returns come into play, giving you a deeper understanding of your investments.
Risk is the possibility that the actual return on an investment will deviate from the expected return. It’s all about volatility, often measured by what we call standard deviation.
The bottom line here is that risk measures uncertainty.
Why is this important? Because, as professional investors, we need a way to level the playing field. By measuring risk, we can balance potential rewards against the associated risks of various investments.
Why do we do this? Simple.
Risk-adjusted returns, or RaR, allow us to compare different investments even if they come with different risk levels. Essentially, it lets us evaluate whether a high-risk, high-return investment is better or worse than a low-risk, low-return one in terms of the returns relative to the risks involved.
The formula for the Sharpe Ratio might appear complicated, but it is actually pretty straightforward.
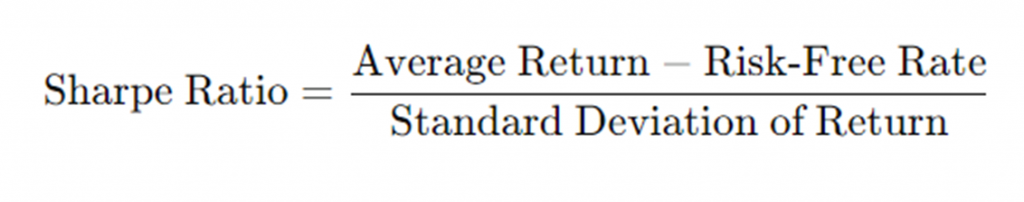
Here’s what each part means:
Average Return: This is the typical return you expect to get from the investment.
Risk-Free Rate: This is the return you would get from a very safe investment, like a savings account.
Standard Deviation of Return: This measures how much the returns of the investment can vary, which helps to measure how risky it is.
Standard deviation measures how much the returns of an investment fluctuate. A higher standard deviation indicates greater variability, which means more risk. Conversely, a lower standard deviation signifies less variability, making the investment safer.
We won’t delve into the mathematics here but understand that standard deviation calculates the spread of returns around the average, providing a numerical representation of this variance. Standard deviation is a way to measure how spread out or different the numbers are in a set. If the numbers are very spread out, the standard deviation is high; if they are close together, the standard deviation is low.
For instance, if Investment A has a standard deviation of 5% and Investment B has 11%, Investment B is considered riskier. However, this is only one piece of the puzzle.
The other piece involves the actual returns of each investment. What if Investment A offers a 2% annual return, while Investment B provides a 6% return?
Which investment boasts a better risk-adjusted return? Investment B is more volatile but yields higher returns, whereas Investment A is less volatile with lower returns. The crucial point is determining which investment delivers the best returns relative to the risk taken.
By plugging these values into the formula, the Sharpe Ratio tells you how much extra return you are getting for each unit of risk you take. The higher the Sharpe Ratio, the better the investment is considered in terms of risk-adjusted returns.
Suppose we have the following data for an investment:
Average Return: 6%
Risk-Free Rate: 2%
Standard Deviation: 11%
Summary of Steps to Calculate the Sharpe Ratio:
- Identify the average return, risk-free rate, and standard deviation from the given data.
- Apply these values to the Sharpe Ratio formula.
- Calculate the difference between the average return and the risk-free rate.
- Divide this difference by the standard deviation to obtain the Sharpe Ratio.
- 5)Interpret the resulting Sharpe Ratio to understand the risk-adjusted return of the investment.
By following these steps, you can determine that the Sharpe Ratio for the investment is approximately 0.36, providing insight into its performance relative to the risk taken.
This means that for every unit of risk taken (as measured by the standard deviation), the investment provides a return of 0.36 units above the risk-free rate. A higher Sharpe Ratio indicates a more attractive risk-adjusted return, while a lower Sharpe Ratio suggests less favorable risk-adjusted performance.
This entire concept will come to life when we compare different assets based upon their risk adjusted returns over the last decade.

So, what do we see, and what can we learn from this?
Several key points emerge.
First, even though the US Treasury is often considered a ‘risk-free asset’, the TLT has displayed tremendous volatility over the past 10 years. Interestingly, it’s been more volatile than gold. You can see that the Sharpe ratio is negative meaning that U.S. Treasuries have become the least favored asset class because risk is significantly higher than the returns.
Second, the returns on long bonds have been quite disappointing. When adjusted for inflation, they present negative real returns.
This explains why the TLT has the worst Sharpe Ratio, making it the worst risk-adjusted return among the assets listed here.
You could blame this on relentless central bank manipulation of the money supply and interest rates, but the outcome is clear—it’s not favorable. It is important to note that all asset managers are aware of this as well. It is not a subjective opinion; it is an objective fact of comparing risk and return.
Next, let’s examine Bitcoin. The annual volatility of Bitcoin is enormous. But Bitcoin’s returns over the past ten years—an astonishing 14 thousand percent!
It simply blows the competition away.
And THIS is why Bitcoin achieves the highest risk-adjusted return here, nearing that coveted 1.0 score. The Bitcoin Sharpe ratio tells traders and investors that for every unit of risk taken you are receiving an additional .93 units of reward over and above the risk-free rate of return.
Folks, asset managers rely on the Sharpe Ratio to scrutinize and compare the risk-adjusted performance of various investments. By diving into the Sharpe Ratio, they pinpoint which assets deliver the best bang for their buck in terms of returns versus risk. This critical analysis is essential for building a diversified portfolio that seeks to maximize returns while keeping risk in check. It’s all about smart, strategic investing to secure your financial future.
The Sharpe ratio is a go-to tool for investors looking to gauge investment performance. It’s popular for a reason: it’s easy to calculate and even easier to understand.
Take mutual funds, ETF’s, hedge funds, family offices for instance. They often include their Sharpe Ratio in the quarterly and annual performance reports they send out to clients.
Now, I know the math behind expected returns and standard deviation can get pretty gnarly, but here’s the bottom line: the higher the Sharpe Ratio, the better the return for the risk you’re taking. It’s a straightforward way to see just how attractive an investment really is.
When US Treasuries, the bedrock of safe investments, show a negative Sharpe ratio, it signals a seismic shift in the financial landscape. Traditionally, Treasuries have been the go-to for preserving wealth, but with returns now trailing even their own benchmark, investors face significant challenges. Also, this has had and will continue to have a toxic effect on banks, insurance companies, pension funds and the ability for retirees simply looking to preserve their hard-earned wealth.
Enter artificial intelligence (A.I.) trading software – the cutting-edge solution to navigating these turbulent waters.
Treasury returns that fail to keep pace with inflation mean your money loses value over time. It’s like putting your savings in a leaky bucket – the nominal amount stays the same, but its purchasing power drips away. Treasuries usually stabilize portfolios by offsetting riskier assets. Their poor returns now mean portfolios are more exposed to volatility, increasing the overall risk.
With Treasuries underperforming, investors are turning to higher-yield, higher-risk assets. Another way of stating this is that the financial markets have turned into casinos where everyone must participate to preserve their wealth. This pursuit of better returns elevates exposure to credit risk, market risk, and liquidity risk.
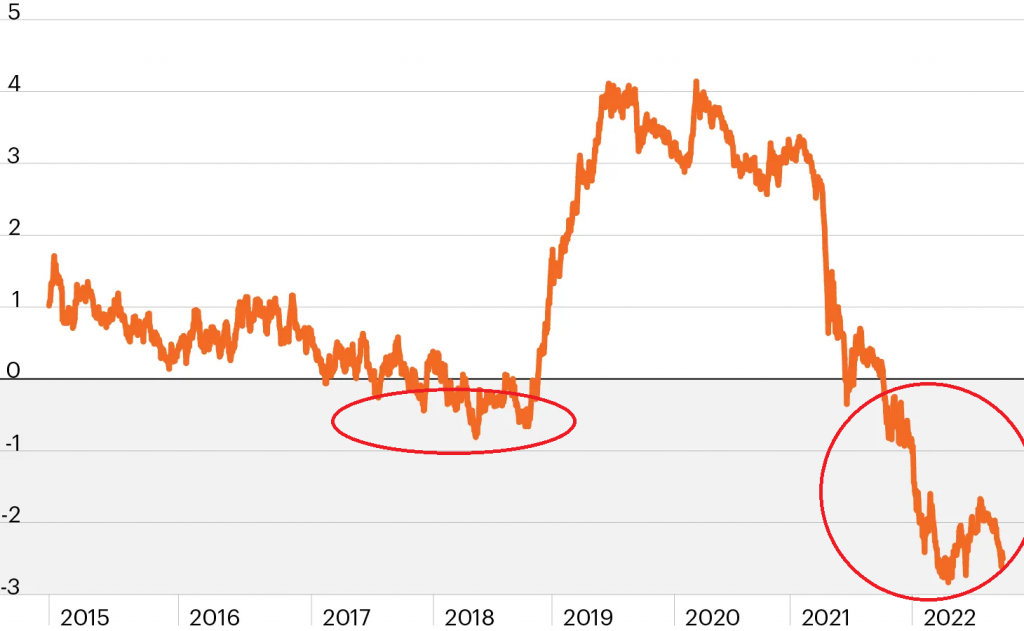
Let me share with you a chart that every asset manager in the United States is aware of. The U.S. Treasury market is $24 trillion in size. This year the Treasury has to refinance a minimum of $10 trillion in US debt. The graphic below shows you the rolling 1 year Sharpe ratio on the 2-year Treasury note.
Regardless of how a publicist for the U.S. Treasury might try to spin it, risk is greater than potential reward.
This fact alone is what is driving the price action across all asset classes. Why? Because no one knows how the Treasury will finance the operations of the US government when NO ONE wants the risky U.S. Treasury asset on their portfolio.
Rolling 1-year Sharpe ratio of 2-year U.S. Treasury note
This development has been unfolding for a long, long time.
The anticipated solution is that the Fed will run the printing press and purchase the debt. When I read those tea leaves, I anticipate another rising tsunami of inflationary pressures.
It’s not a pretty picture and a recipe for massive volatility across all asset classes moving forward.
Inflation stands to benefit those who are asset rich. Tangible assets like real estate and stocks generally rise in value with inflation. Wealthier individuals, who are more likely to invest in these assets, can use them as a hedge against inflation. This situation exacerbates wealth inequality: as inflation eats away at the purchasing power of cash savings, those without substantial investments in appreciating assets see their wealth dwindle, while those with investments see their wealth potentially grow. Over time, this widens the gap between asset owners and those whose primary wealth comes from their labor. Inflation, in effect, acts as a “hidden tax” on the less wealthy and a mechanism that increases financial disparity across society.
These dynamics spark heated debate about the health of the economy. If you’re an asset owner, rising stock and real estate prices can make you feel wealthier. But if you don’t own assets, inflation slowly but surely robs you blind.
Artificial intelligence trading software is emerging as a vital tool in this challenging environment. Here’s how AI can turn the tide:
– AI can process vast amounts of market data in real-time, identifying patterns and trends that human analysts might miss. This enables more informed decision-making, ensuring that traders are always one step ahead.
– By leveraging historical data and sophisticated algorithms, A.I. can forecast future market movements with high accuracy. This predictive capability helps traders anticipate and respond to market changes swiftly, staying on the right side of the right trends at the right time.
– One of the significant advantages of AI trading is the elimination of emotional bias. Human traders often make decisions based on fear or greed, but A.I. operates on pure data and logic, maintaining discipline even in volatile markets.
In a world where traditional safe havens like Treasuries no longer guarantee safety, A.I. trading software provides a much-needed lifeline. It offers the ability to:
– **Identify Optimal trading Opportunities:** By analyzing vast datasets, A.I. can pinpoint the best investment opportunities that align with an investor’s risk tolerance and return expectations.
– **Optimize Timing: ** A.I. ensures that trades are executed at the most opportune moments, capturing maximum profit, and minimizing loss.
– **Adapt to Market Changes: ** With continuous learning and adaptation, A.I. systems can evolve with the market, ensuring that strategies remain relevant and effective.
The negative Sharpe ratio of US Treasuries underscores the need for innovative approaches to wealth preservation. Artificial intelligence trading software stands out as a powerful solution, capable of navigating the complexities of modern markets. By leveraging AI, traders can stay on the right side of the right trend at the right time, ensuring that their investments continue to grow despite the challenges. In this new era of central bank manipulation, AI isn’t just an advantage – it’s a necessity.
Imagine a future where you not only cope but also thrive, no matter the economic challenges ahead. This is within your grasp with the unparalleled power of Artificial Intelligence (AI) in trading. Our cutting-edge A.I. trading software is designed with a single mission: to keep you consistently ahead in the market, enabling you to make the most informed, timely, and profitable trading decisions.
This revolutionary technology is at your fingertips, poised to empower you to seize control of your financial destiny. Don’t let inflation erode your hard-earned savings. Join the ranks of forward-thinking investors who are leveraging advanced A.I. to achieve extraordinary financial returns.
Act now. Embrace the power of A.I., which continually learns from its experiences to avoid past mistakes and enhance future outcomes. This isn’t merely about preventing errors; it’s about actively seeking out the most effective strategies in real-time.
Feeling excited? You should be, because A.I. trading software is transforming the trading world just as it has dominated games like Poker, Chess, Jeopardy, and Go. If AI can outsmart humans in these complex fields, imagine what it can do for your trading strategy.
Harness the sophisticated analysis that only AI can provide and step into a realm of higher probability, more informed trading decisions. AI doesn’t just offer insights—it delivers actionable knowledge that can redefine your financial strategy. Don’t wait for the economic tides to shift; take command with AI-driven trading tools.
You are cordially invited to an exclusive online Master Class: ‘Learn How To Trade With Artificial Intelligence.’ This groundbreaking session is led by seasoned experts in AI trading, ready to demonstrate how A.I. can become your ultimate ally in understanding market trends, assessing risks, and identifying potential rewards. Discover how AI keeps you ahead of the curve by pinpointing the right trends at the right time.
Join us online for this transformative event that promises to arm you with critical insights and foresight in the financial market. Register now to secure your spot in this vital educational opportunity!
Join us for a FREE Live Training.
It’s Not Magic.
It’s Machine Learning.
Let’s Be Careful Out There!
THERE IS A SUBSTANTIAL RISK OF LOSS ASSOCIATED WITH TRADING. ONLY RISK CAPITAL SHOULD BE USED TO TRADE. TRADING STOCKS, FUTURES, OPTIONS, FOREX, AND ETFs IS NOT SUITABLE FOR EVERYONE.IMPORTANT NOTICE!
DISCLAIMER: STOCKS, FUTURES, OPTIONS, ETFs AND CURRENCY TRADING ALL HAVE LARGE POTENTIAL REWARDS, BUT THEY ALSO HAVE LARGE POTENTIAL RISK. YOU MUST BE AWARE OF THE RISKS AND BE WILLING TO ACCEPT THEM IN ORDER TO INVEST IN THESE MARKETS. DON’T TRADE WITH MONEY YOU CAN’T AFFORD TO LOSE. THIS ARTICLE AND WEBSITE IS NEITHER A SOLICITATION NOR AN OFFER TO BUY/SELL FUTURES, OPTIONS, STOCKS, OR CURRENCIES. NO REPRESENTATION IS BEING MADE THAT ANY ACCOUNT WILL OR IS LIKELY TO ACHIEVE PROFITS OR LOSSES SIMILAR TO THOSE DISCUSSED ON THIS ARTICLE OR WEBSITE. THE PAST PERFORMANCE OF ANY TRADING SYSTEM OR METHODOLOGY IS NOT NECESSARILY INDICATIVE OF FUTURE RESULTS. CFTC RULE 4.41 – HYPOTHETICAL OR SIMULATED PERFORMANCE RESULTS HAVE CERTAIN LIMITATIONS. UNLIKE AN ACTUAL PERFORMANCE RECORD, SIMULATED RESULTS DO NOT REPRESENT ACTUAL TRADING. ALSO, SINCE THE TRADES HAVE NOT BEEN EXECUTED, THE RESULTS MAY HAVE UNDER-OR-OVER COMPENSATED FOR THE IMPACT, IF ANY, OF CERTAIN MARKET FACTORS, SUCH AS LACK OF LIQUIDITY. SIMULATED TRADING PROGRAMS IN GENERAL ARE ALSO SUBJECT TO THE FACT THAT THEY ARE DESIGNED WITH THE BENEFIT OF HINDSIGHT. NO REPRESENTATION IS BEING MADE THAT ANY ACCOUNT WILL OR IS LIKELY TO ACHIEVE PROFIT OR LOSSES SIMILAR TO THOSE SHOWN.


