


Welcome to the Artificial Intelligence Outlook for Forex trading.
VIDEO TRANSCRIPT
US Dollar Index
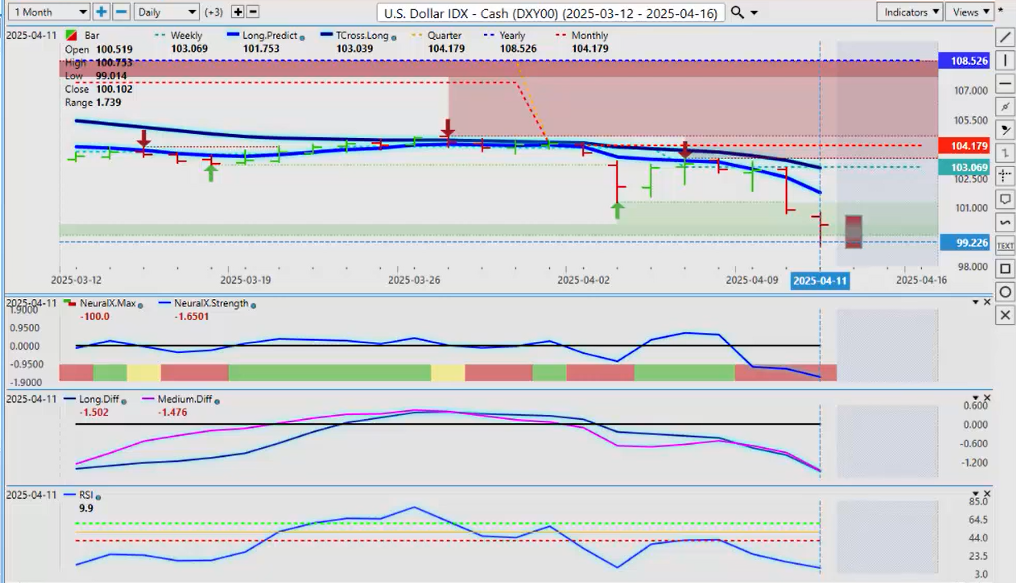
Okay, hello everyone and welcome back. My name is Greg Firman, and this is the Vantage Point AI Market Outlook for the week of April the 14th, 2025. Now, to get started this week, we’ll begin where we always do, with that very important US Dollar Index. Now, the dollar is under significant selling pressure, largely due to the confusion around the tariffs—they’re in one day, they’re out the next. But here’s where we’re at: when we’re dealing with this kind of volatility, we always want to make sure we’re going back far enough to ensure there isn’t, uh, some invisible support, if you will.
Now, looking at these verified zones, we can see that we have very, very strong support coming in at or around the 99.77 mark. We have additional verified support going back to September 2026, that’s coming in at about 148. So, if the dollar is going to stabilize, I imagine it will be around this 99.41 area, but we do need indicators from our VP software to warn us that that’s going to happen.
So, for now, you can see that we’ve retraced this past week back up to our T Cross Long and our Long Predicted. Now, this is custom—two custom predicted moving averages, one based around the long-term crossover without the black line, the other one with the triple EMA cross with only the T Cross Long. And the reason I like this setup is it gives me my medium-term pivot levels and my longer-term reversal point.
So, the theory here is, I would have to get above that predicted, uh, moving average, the T Cross Long at 103.03, to take the pressure off the downside or for the current trend to reverse. Then we look for medium to longer-term levels using those verified zones, which I just showed, that are coming in, uh, around that 99.71 area.
So again, be very, very careful on Monday trading. What I have seen over the last several years is the market does a lot of damage on Monday trading—that the high and low of the Monday bar can be relevant for the entire week. And that’s what kind of volatility you’re dealing with whenever we get these crazy announcements; they always seem to be on a Monday.
So, let the market settle, revisit it Monday night, and then apply our VP indicators. But for now, the bias on the dollar remains to the downside.
Gold
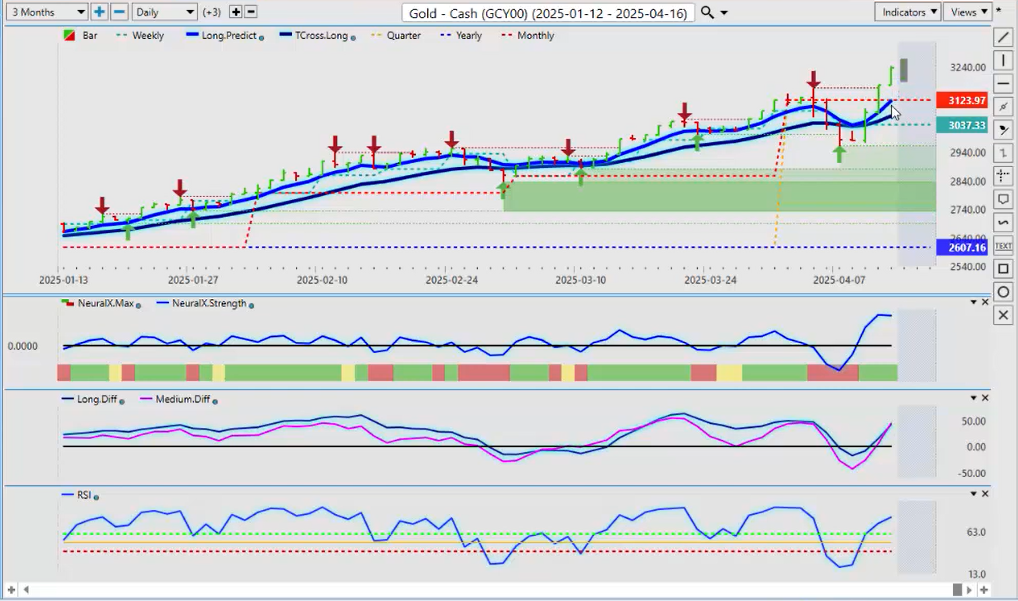
Now, with that happening, gold has spiked yet again. But let’s be clear here, guys, gold has been very bullish all year. So, for now, our yearly opening price is coming in at 2607. The monthly opening price is now the one or the quarterly; they’re both the same number for the next few months. That level is key—3123 is our main support level. Now, you can see that that’s intersecting with the Vantage Point Long Predicted, that medium-term predicted moving average. And then, my secondary one is below that, along with the weekly opening price from this previous week at 3037. So the indicators in VP are looking pretty good. The Neural Index Strength, for day traders, this is one of the most powerful tools I’ve seen in years, because we have our neural index, which is red, green, or yellow, like a stop sign, excuse me, but it also has the neural index strength, which tells us the underlying strength of that particular asset class.
So here, we’re starting to flatten out on gold. That’s another warning sign; potentially, the dollar could start to base out here, and gold could give back some of these gains. But that would just be a retracement. And those two levels, our Long Predicted at 3120 and our T Cross Long at 3067, we’re long while we’re above that area. But again, the current monthly opening price, because remember, guys, this is an outlook, not a recap of something that’s already happened. We’re looking forward; this outlook is being done on Saturday afternoon, and again, for the next week’s trading. So, we look at these levels ahead of time, so we’re prepared for trading. So that Long Predicted is intersecting with the monthly opening price at 3123, so that is the target area for potential longs, and then stops would be below our T Cross Long.
S&P 500 Index
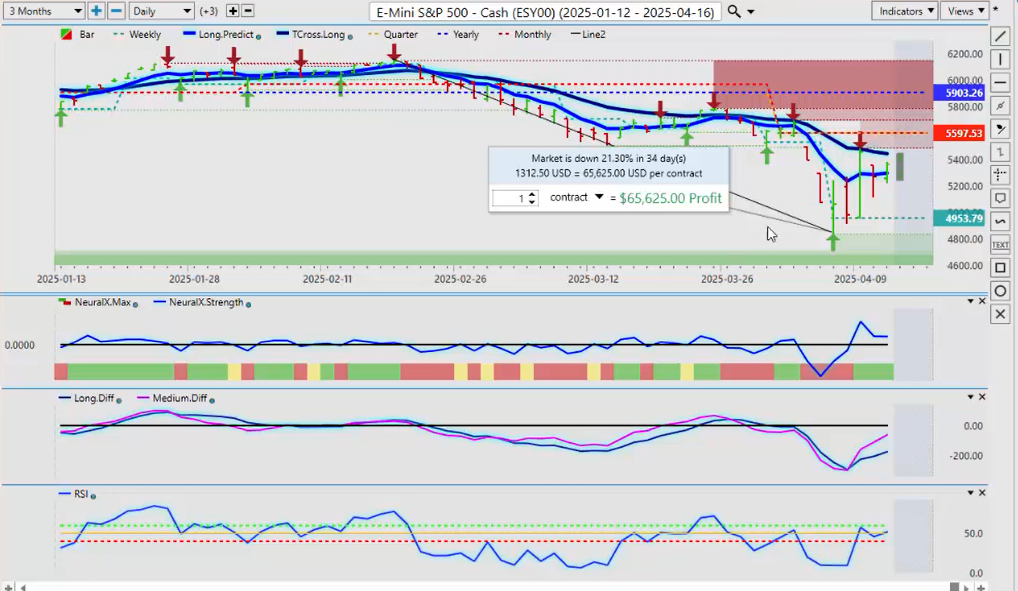
Now, the equity markets again, they’ve really been all over the place here. But the, again, the US equity markets are, in my respectful opinion, only the weaker of the group in most cases. The CAC 40, the DAX 30, the S&P, the Nikkei, uh, all the global indices are connected, but there’s been a disconnect as of late. The S&P 500 is firmly below its yearly opening price, and that’s going back to March the 3rd. So, right now, do we have a bottom in place for the S&P 500? I seriously doubt that, guys, because again, we’ve got tariffs one week, next week we don’t. There’s a lot of volatility in there, but for next week’s trading, the immediate low is 4835. So that is a main support level. You can see that we’re retracing back; we’ve closed above the Long Predicted. That’s positive, but we’ve got to get above the T Cross Long at 5443. That is your area to watch, along with 5597, the current monthly opening price.
Again, guys, the rolling performance model, be very careful about comingling dates. I’m not really concerned with what happened over the last 14, 15, 18, 30 days. Everything starts fresh on the new quarter and the new month, and that directly helps tie us to our known seasonal patterns on a monthly and quarterly basis. So again, keep a very close eye on that T Cross Long and the current monthly opening price, but I would like to get above both before I start buying this one heavily.
DAX
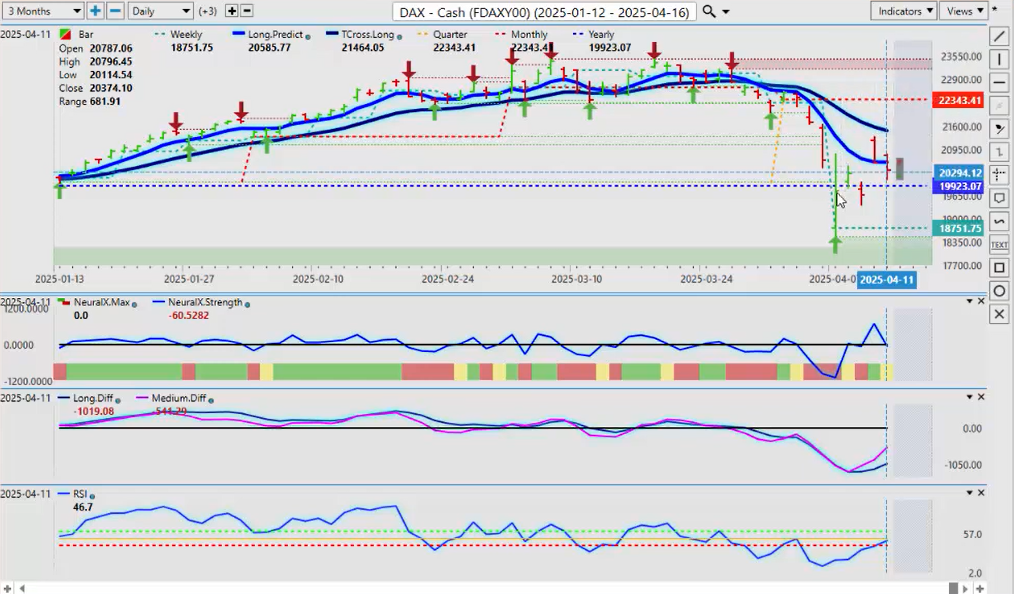
Now, on a comparative note, once again, the darling here, if you will, is the DAX 30. It’s performed far better than a number of the global indexes. We’ve managed to have a big spike lower, and that’s a positive correlation to the S&P 500, and that occurred on April the 7th, but we immediately took back the yearly opening price, so the DAX remains positive on the year. The MA Diff Cross here is warning us that we are likely going to move back to our T Cross Long at 21,464, but remember, hold off on whatever you’re going to do, wait until the Monday carnage is completed. And carnage is the only word I can use, so keep an eye on the high and low of where we’ve finished on Monday, or at least wait until well, at least an hour after the North American session opens on Monday morning, and then the price starts to establish itself as to what it’s going to do for the rest of the week.
So right now, uh, mildly bullish on the DAX. The indicators in VP are looking pretty good, again, the only one that concerns me is that neural index strength, and a caution on the main neural index. Now that slope formation pointing down, that is a concern, guys, uh, I will, I will say that, but 19,923, uh, we’re going to get a new weekly opening price, that’s going to be up above the current calendar yearly opening price, but the DAX is negative on the month. So again, this is all going to come down to investor sentiment. Are we in a, if we’re in a, if we move back to a risk-on environment, the DAX, the S&P, the Nikkei, they’ll all move up. That’s what we would be looking for, but my optimism on that, given the most recent market conditions, remains heavily guarded.
Volatility Index ($VIX)
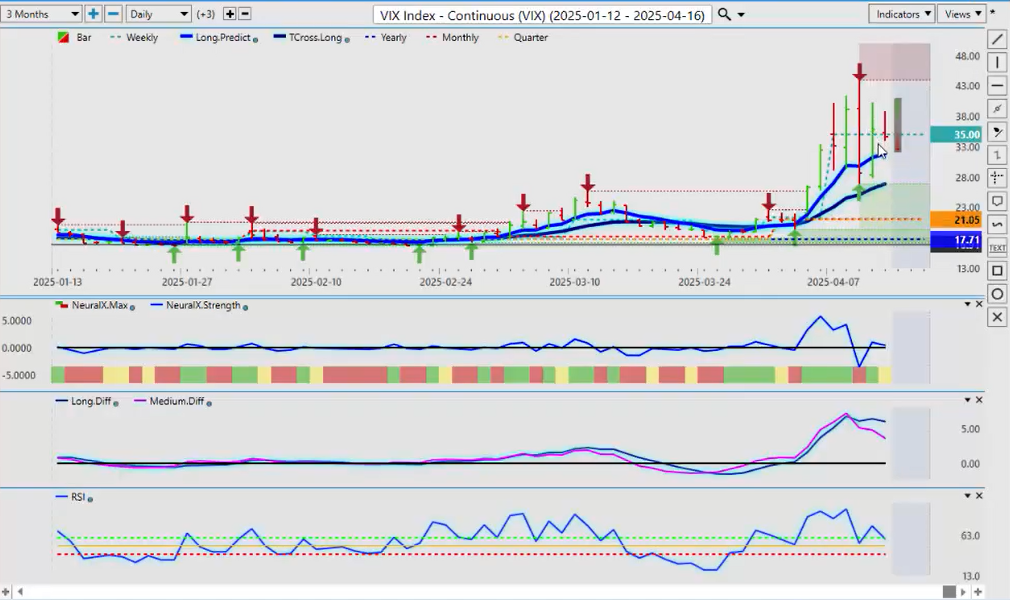
Now we should keep a very, very close eye on the VIX again, looking at all markets, not just one or two stocks or one or two Forex pairs, a broader market outlook, and we would need to bring the VIX into this. So the VIX right now, in the VP software, we can see that the pink line over the blue line is saying that the medium-term trend is weakening against the long-term uptrend on the VIX. We are still above our Long Predicted and our T Cross Long. Structurally, this looks very good, uh, but a retracement, first, probably back down into this area between 31.85 and 26.83, and then we would reassess at that area if we still have a possible buy here. So I’ll be watching these levels very, very closely, but it’s good to know where they are. The quarterly and monthly, 21.105, the calendar yearly opening price, 17.71, but I will point out that the VIX has largely been positive the entire calendar year, as you can see. And then the most recent volatility has really caused a couple of big spikes, uh, so we’ll watch it closely, but I believe that, um, the VIX is not done to the upside, uh, just quite yet.
Bitcoin
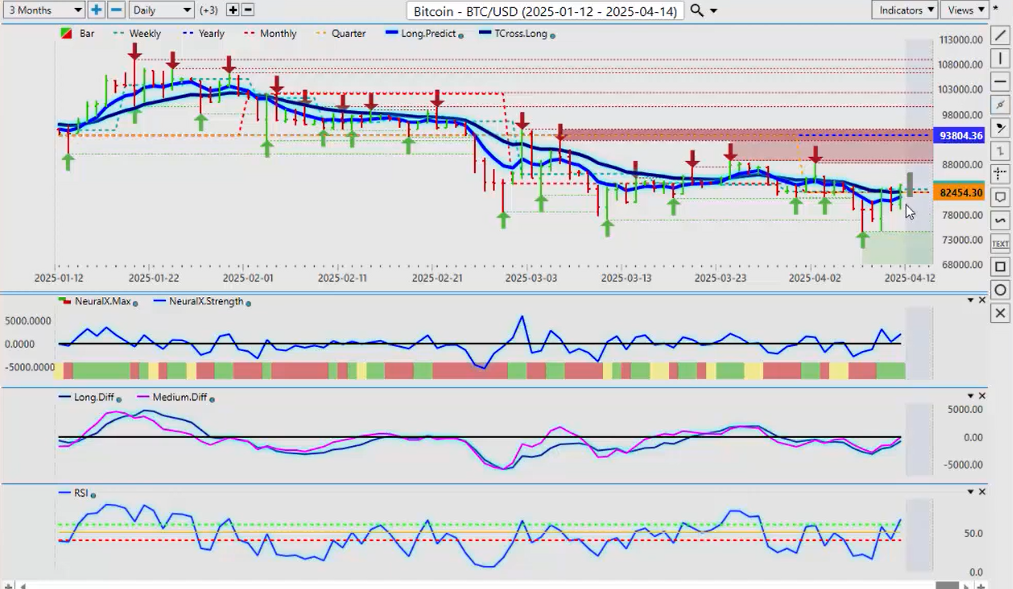
Now with Bitcoin, Bitcoin, uh, again, responding to a lot of the things happening in the equity markets in the global commodity markets. Now we’ve recovered; it is looking pretty good here, uh, we’ve just got to get above 82,466 and stay above this level in order to take the pressure off the immediate downside. We’ve got good verified support, uh, at 74,496. That’d be an awesome buying opportunity. Hopefully, we’re lucky enough to get down there again next week. But once again, look where you are midday on Monday, and then on Tuesday or Monday evening, start hitting the markets based around whatever announcement, whatever they’re going to hit us with here, guys. They’re going to hit us on Monday. Okay, so at the end of Monday, we can look and see what we’re dealing with for the rest of the week, but the VP indicators are saying that Bitcoin is going higher, so that may not be on Monday, but I suspect it will be on Tuesday, Wednesday, and Thursday.
Crude Oil
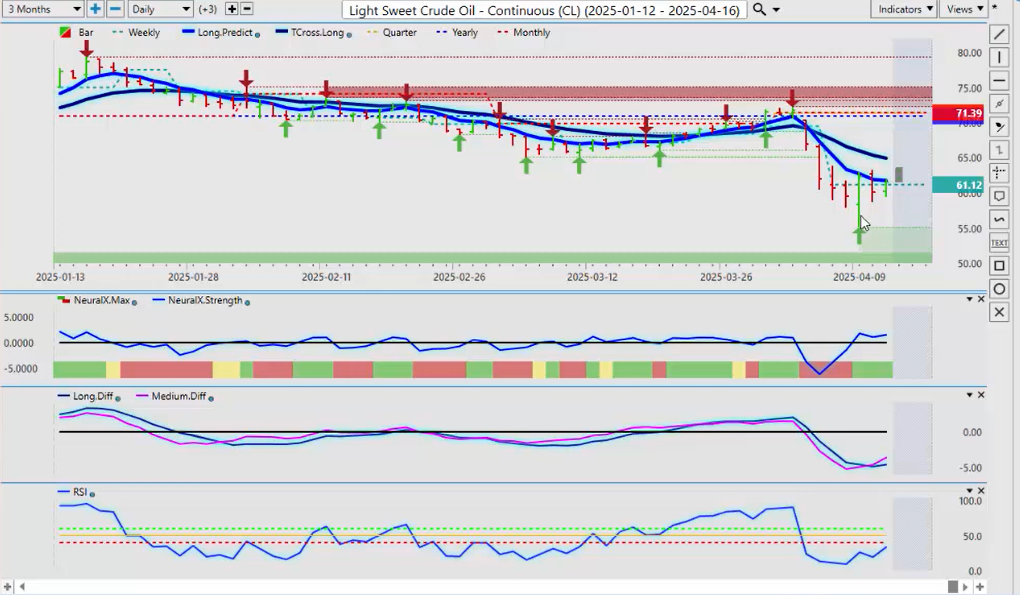
Now with oil prices again, taking a beating this past week, uh, we have a good support low now, and that’s coming in around $55 a barrel. Good buying opportunity, but again, with this being an outlook, not a recap of something that’s already happened, excuse me, we’ve got a trade potentially in progress here about to happen next week. That MA Diff Cross is a zero-lag indicator; it measures the strength of the medium-term trend against the long-term trend, so it’s looking at two different things at the same time, and that some of the people have affectionately referred to this as the death cross. So if you’re short on oil, you might want to exit that short because the probability of going higher based on these VP indicators is very high. We just have to cross our Long Predicted at 61.72, and that will open the door to 64.94 and potentially higher as we get closer to that known seasonal period in May and June on the oil contracts.
Euro versus U.S. Dollar
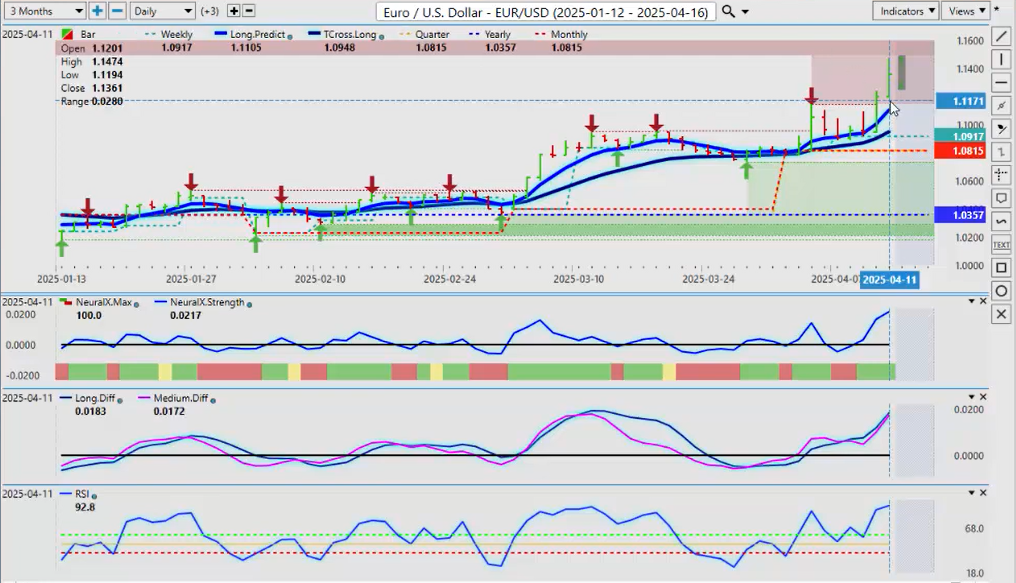
Now, as we go into some of our main forex pairs, all eyes are on the euro now. In my respectful opinion only, the euro has overreacted to a lot of the things that are happening. The fundamentals in Europe are actually worse, not better. So again, uh, we’ve made a big push off of our T Cross Long and our Long Predicted last week. We did do this in the Vantage Point live training room, and, and reluctantly, uh, I did encourage longs, but I didn’t like the long trade on this because I don’t think the dollar is down and out just yet. Now, uh, over the course of my career, I’ve traded the euro up in the 1.50, 1.60 range for many months, many years, but again, that doesn’t necessarily mean that the euro is going to retrace back to those particular levels. When we look at this from that perspective, the euro has suffered a significant decline, much like the US dollar, so trading them against each other very often can be, uh, difficult at times, like right now. So, I believe the euro, if nothing else, has the ability to retrace back to a minimum of the 1.11 area, potentially even 1.0948. But the immediate target for retracement next week is not based on Fibonacci or wave theories or any of this stuff, guys. It’s based on real the correlation to 31 other markets when we’re trading that target market that are built into the predicted moving average. So 1.1105 is a very reasonable retracement point. The, the Neural Index is grossly overextended, as is the predicted RSI. Now, that doesn’t mean it can’t go higher. If it does go higher, it likely will be on Monday, but it’s Tuesday, Wednesday, and Thursday that’s where you’ve got to be careful. And if you see the Neural Index Strength starting to, to, to flatten out and turn lower, that’s your opportunity for, if nothing else, a retracement.
U.S. Dollar versus Swiss Franc
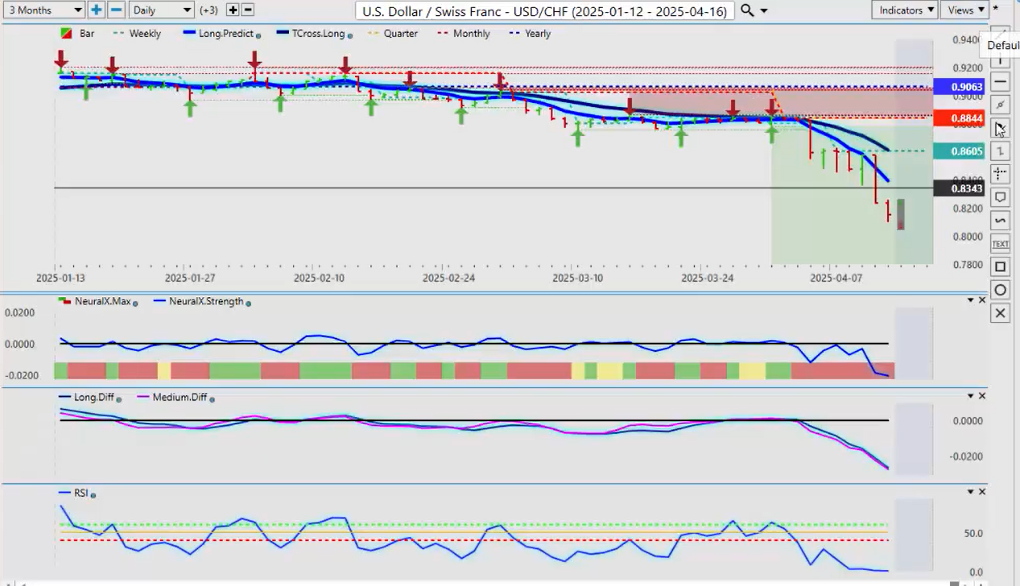
Now, the same thing would have applied to US Swiss Franc, where it basically is the same trade. We’re grossly overextended here, and again, that predicted Neural Index, we’re looking for it to start to turn and point back up. That’s what we would be looking for here, guys, to tell us that okay, we’re going to come back to that Long Predicted at 0.8393 and potentially even 0.8613 if things start to settle down. The, the VP Predicted RSI is at 1.1, that’s the lowest I think I have ever seen the Vantage Point Predicted RSI. Again, that doesn’t mean it can’t go lower, guys, the, but the question is, when is it going to retrace? So, we’ll keep an eye on our Neural Index Strength, but I suspect that that would be Tuesday or Wednesday of next week.
British Pound versus U.S. Dollar
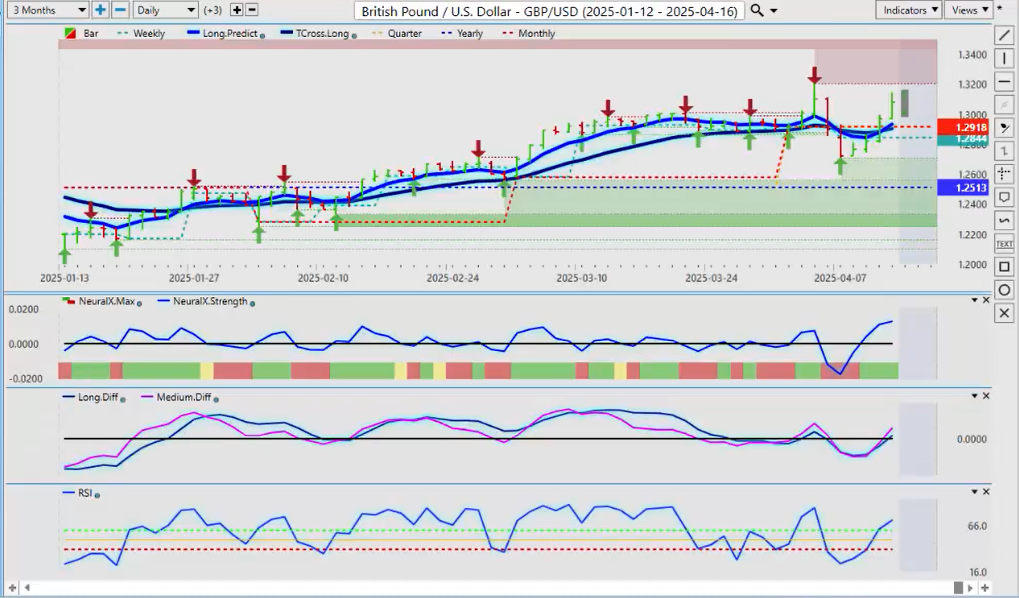
Now, the British Pound/US Dollar has not enjoyed the same type of rally as the euro and some of the other currencies, uh, and that’s because of what’s going on in the UK, the tariffs, uh, so we have immediate resistance up here at the high, which is 1.3206. We would need a sustained break of that to keep buying this because again, things are not exactly rosy in the UK here, either, uh, but I will concede, we’re above our monthly and quarterly opening price, our yearly opening price, 1.2513. We do have an MA Diff Cross saying that, okay, the initial push on this pair is going to be to the upside, but once again, uh, keep it, always have a point in time that you can gauge, okay, is this a real break? So, let’s say, for example, we break above 1.3206, which I believe we will on Monday, but the question is, is that a bull trap up there? Well, I guess we will see, but for now, that is the level for the week. And again, once we get our Monday bar, then we can make a decision on, okay, what are we still bullish on this, do we have room to extend, but in my respectful opinion, based on what’s going on in the UK, it is going to be difficult to hold above this particular level, and as soon as we start failing on that, our retracement points are going to be back down at 1.2935 and 1.2908. So if we’re closing out the week, uh, at 1.3084, then we’re really not that far to those particular levels, uh, so keep an eye on that, but for now, I believe, uh, the initial move will be up, and then midweek, we turn back down.
U.S. Dollar versus Japanese Yen
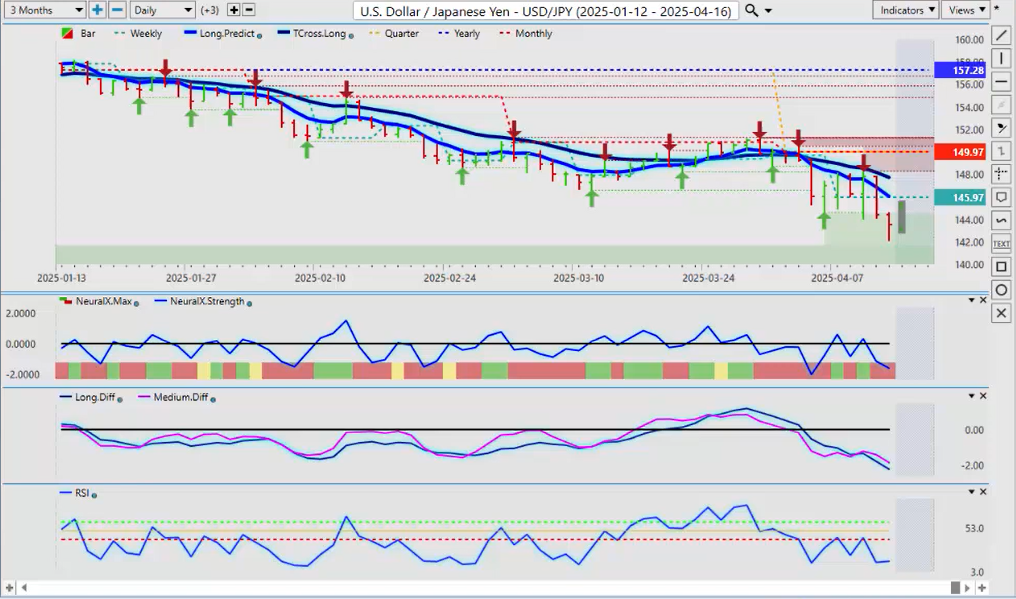
Now, the Dollar Yen, once again, the Dollar Yen is going to be fully susceptible to these tariffs, but beside, uh, away from the tariffs and everything else, I will point out that I’ve been, uh, especially on the, on the VP Weekly Outlook, uh, I’ve been very, very pro-Japan on this actually, that, uh, this pair has been grossly overextended for a very long period of time, all to do with a very confused Fed. He’s cutting, he’s hiking, he’s cutting, co, uh, but when the equity markets slide, the yen and the Swiss Franc strengthen, in most cases, so does the US Dollar, but they’ve fallen out of the world is now questioning if the US Dollar will remain the reserve currency. That’s a whole separate presentation, guys, but for now, uh, structurally, this pair is very weak. Yearly opening price, 157.28, new quarterly opening, and new monthly opening. I cannot stress enough how important those numbers are, 149.97, uh, short while below this particular level. Our Long Predicted and our T Cross Long, 146.2 and 147.73, those are immediate sell zones for us, and the very minimum stop should be above 149.997 because we don’t want to get prematurely stopped out, uh, on what could be a very good short going into year-end.
U.S. Dollar versus Canadian Dollar
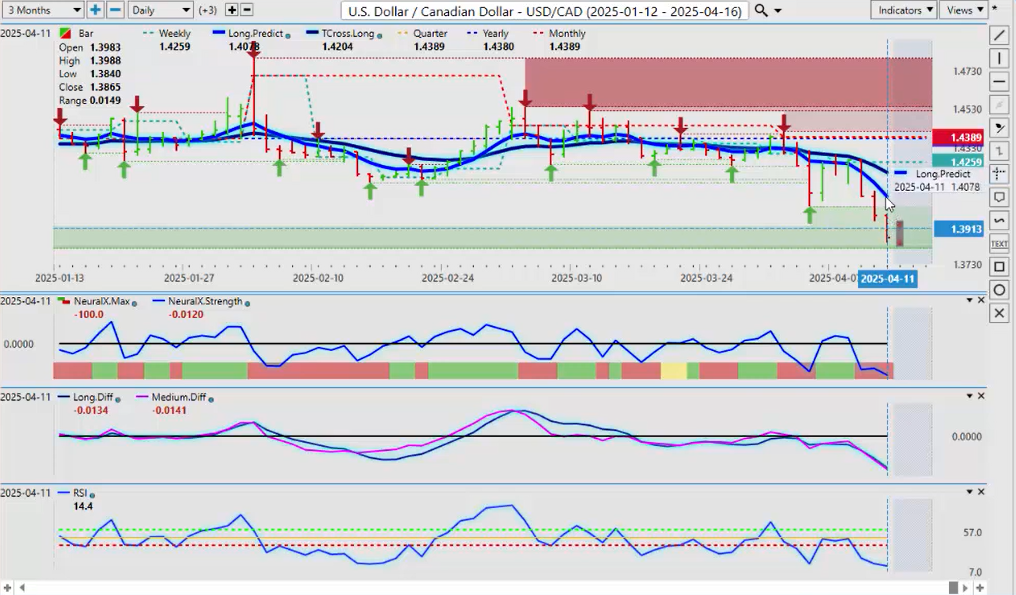
Now, going into our main equity commodity-based currencies, the Canadian Dollar has got a bit of a bump, uh, there is an election this month, but again, uh, very, very few reasons to be buying the Canadian Dollar, uh, aside from the election. Oil prices are soft, that you’ve got a trade war going on here that I don’t see that Canada can win, so, uh, the market is a little optimistic, but that correlation that the Canadian, the Aussie, and the Kiwi have to things like the S&P, the NASDAQ, uh, it’s quite interesting, guys, intermarket correlations can, uh, really can preside over the market, and most never see it. So if the equities continue to move higher, that actually could be a positive for the Canadian Dollar, even though, fundamentally, there, like I said, there’s very few reasons to be buying Canadian Dollars at this time. But we are coming into a seasonal period with oil, gold is strong, the commodity
side is strong, and maybe the market is banking on a change in government in Canada. That’s pro-oil, and again, if that’s the case, then maybe it is a good time to buy Canadian Dollars, but I would prefer we get past this Canadian election first before we make that decision. So for now, uh, a retracement looms quite large here, guys. The minimum retracement, 1.4073, followed by 1.4204. We are negative on the quarter below the quarterly opening and the yearly opening price on this, and they’re basically intersecting at almost the exact same area, 1.4389, and 1.4380. That’s where all the lines are drawn. So if you’re maybe on, like me, well, I’ve got buy limit orders sitting right above the 1.44 area, so if we break above that, then again, like I said, this is an outlook, not a recap of something that’s already taken place. I want a plan in place for what’s about to happen, not looking back at something that’s already taken place. So again, uh, one could argue, could tighten that up a little bit too, and have your, your buy limit orders just above the T Cross Long at 1.42, and then you fill the gap between that and the current monthly opening price, and also a very, very powerful strategy.
Australian Dollar versus U.S. Dollar
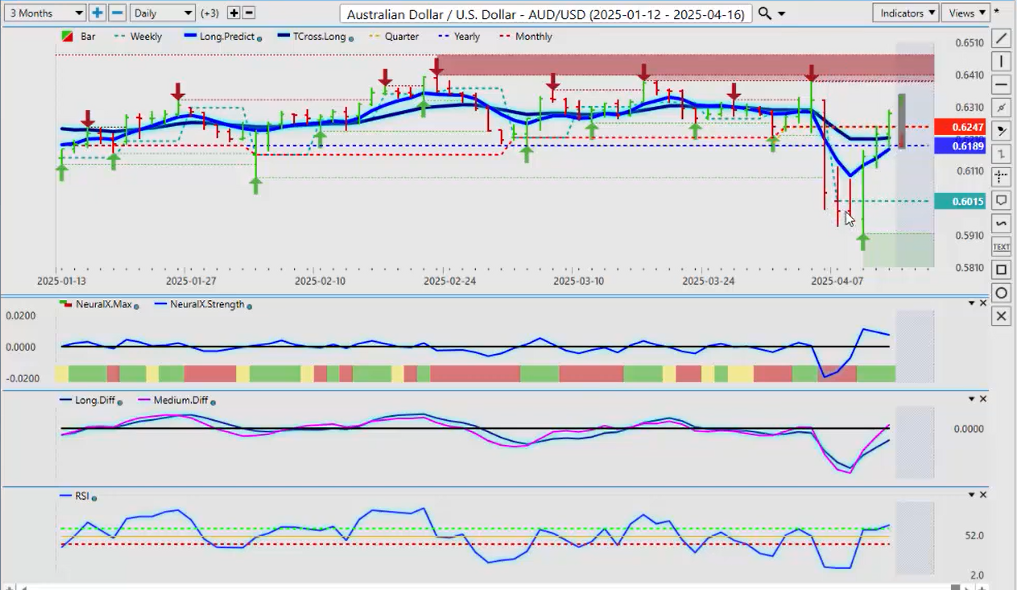
Now, the Aussie, you’re going to see something very similar. The Aussie has rebounded, uh, into the end of the week, but these four bars, right, daily bars right here, are very concerning. So understand what will trigger another sell-off in the Kiwi, the CAD, and particularly the Aussie, and that’s more China-US rhetoric on tariffs. I think if it, this heats up, it’s not going to be good for any of these three currencies, particularly the Aussie. So if, uh, things start to smooth out, we get a risk-on environment, then it will benefit the Aussie, but always understand that you’re trading under a guillotine here, guys, that if the, if Trump powers up on the tariffs with China, China retaliates, Aussie is caught in the middle here, so is technically, so is the Kiwi, and arguably so is the CAD. So again, we, our main level, 0.6189, our yearly opening price, uh, we’re so far so good here, uh, we’ve closed two days above our T Cross Long, so 0.6212, if you’re a buyer, that’s where it is, uh, but again, for the savvy trader, you can buy one, have a stop loss ready to go, and a sell limit order just below the yearly opening price, or the Long Predicted at 0.6177, either one of those areas, guys, because if it starts to crash, these bars tell you how fast that crash is going to be. So one could just sit on the sidelines, even for now, and say, “You know what, uh, if this is going to fail, I’m going to put my sell stop right below the calendar yearly opening price.” And I know that if it breaks that, uh, potentially, I’m going to run down two, 300 pips very, very quickly, and the same strategy would apply to the Kiwi, guys.
New Zealand Dollar versus U.S. Dollar
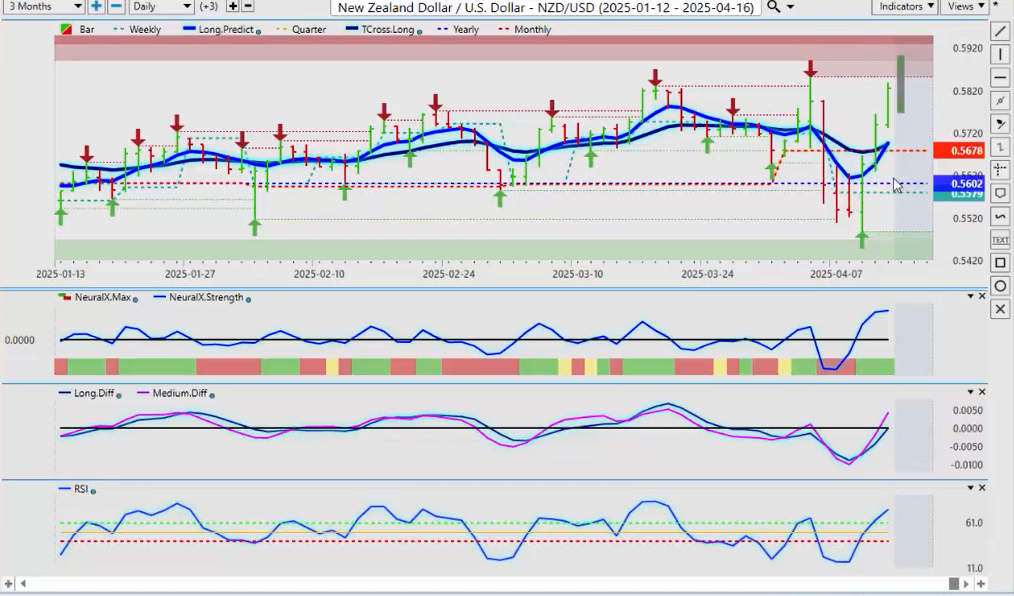
Right now, the Kiwi structurally looks a little stronger, and that’s because of Aussie’s ties to China here, right, so if you’re going to buy one of these two, I would argue probably the Kiwi is the slightly safer bet, but they’re both going to be affected. You can see the breakdown below the yearly opening price, equity markets recover on Wednesday, and so do the, so does the Aussie, so does the Kiwi, so does the Canadian Dollar for a broader dollar sell-off. So I would expect another volatile start to the week on Monday. My strong recommendation is, is let all markets come in, assess where we’re at at say 11, 10:30, 11:00 a.m on Monday, and then look, then look to enter into the markets on Monday evening or Tuesday morning. So, with that said, this is the Vantage Point AI Market Outlook for the week of April the 14th, 2025.


