


Welcome to the Artificial Intelligence Outlook for Forex trading.
VIDEO TRANSCRIPT
US Dollar Index
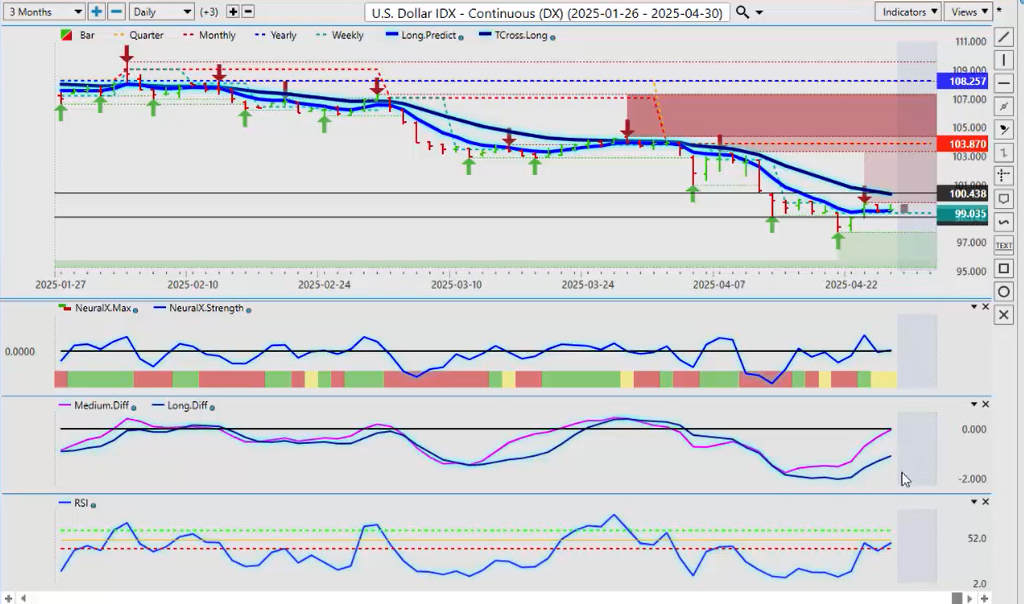
Okay, hello everyone and welcome back. My name is Greg Firman, and this is the VantagePoint AI Market Outlook for the week of April the 28th, 2025. Now, to get started this week, we’ll begin with the US Dollar Index. Now, a choppy week, uh, for sure, but the Dollar is holding some gains here. Our MA diff cross continues to point higher. We’ve got a rising predicted RSI, and we’re coming into a period of known US Dollar strength. Now, uh, Trump is always going to be the wild card here, uh, with the tariffs and everything else, but we’re holding. We’ve got a new verified support low, that area coming in at 97.68, and we’ll use that for our baseline for next week’s trading.
Because again, this is an outlook, not a recap of something that’s already happened, guys. We’re pointing to next week’s trading throughout this entire outlook. So the indicators are somewhat neutral on a Friday, but you’ll see that the medium-term strength is rising, and that’s what we’re looking for — that strength to build into that first week of the new month.
S&P 500 Index
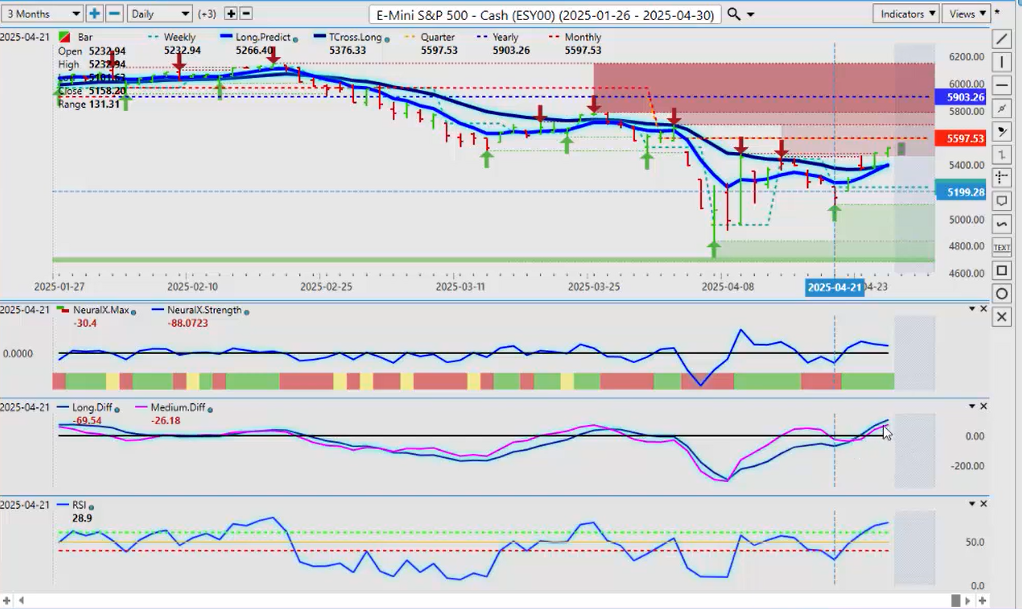
Now, when we do a comparative analysis to that with the S&P 500, now the stock markets — again, a tough week, but they are recovering. You can see that we’ve got a new verified support low that’s coming in around 5101.
The main indicators here are pointing higher. We’ve got momentum building with that predicted RSI breaking the 60 level, but we’re still below the monthly opening price and the yearly opening price. We’re still negative on the year. However, things are looking pretty good. And with the S&P 500 positively correlating to the US Dollar Index, that means they can both go up together potentially next week — and that’s what we would look for. Now, Wednesday, I believe, Wednesday of next week — which is May 1st — we’ll get a new monthly opening price, and that will shift. So be mindful of that; when the new month starts, we’re going to move that monthly opening price to that new level.
Bitcoin
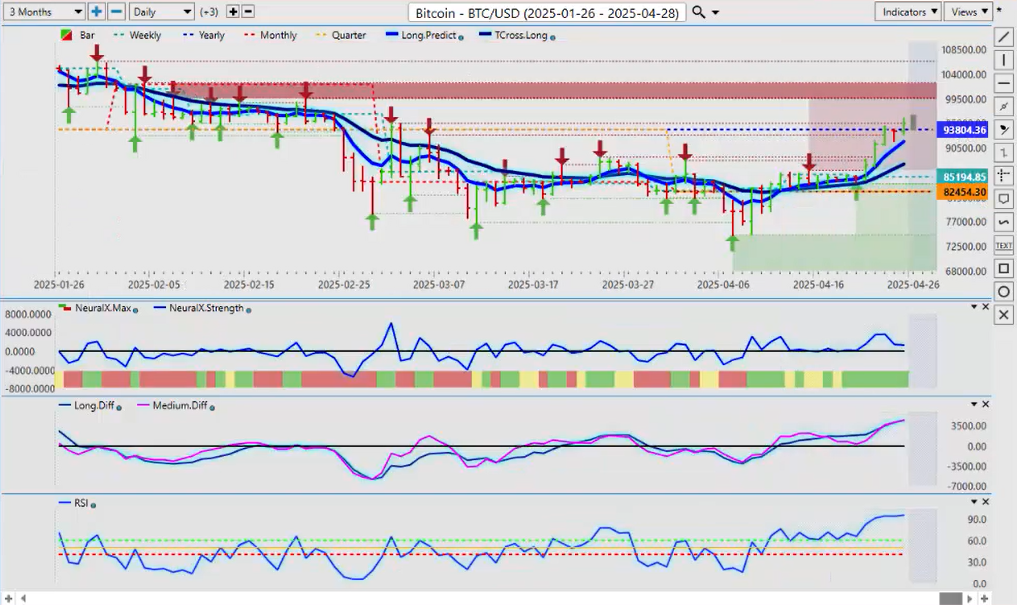
Now, with Bitcoin, Bitcoin on a real tear here over the last couple of weeks as gold fails again. Now, Bitcoin really is at a crossroads right now. We’re at the yearly opening price, 91,592. We’ve had a very, very good close here, but we’ve got to hold above this level, guys. My only bit of a concern is that we’re going to get a significant pullback before we go higher again, based around that period of Dollar strength — but not necessarily. But if we do, our downside support levels for next week are 95,592 and 87,545.
Uh, and excuse me, that calendar yearly opening price is 93,804. That is the level. Sorry — we want to make sure we’re keeping a very close eye on that. If we can hold above that, then Bitcoin has plenty of room to extend.
DAX
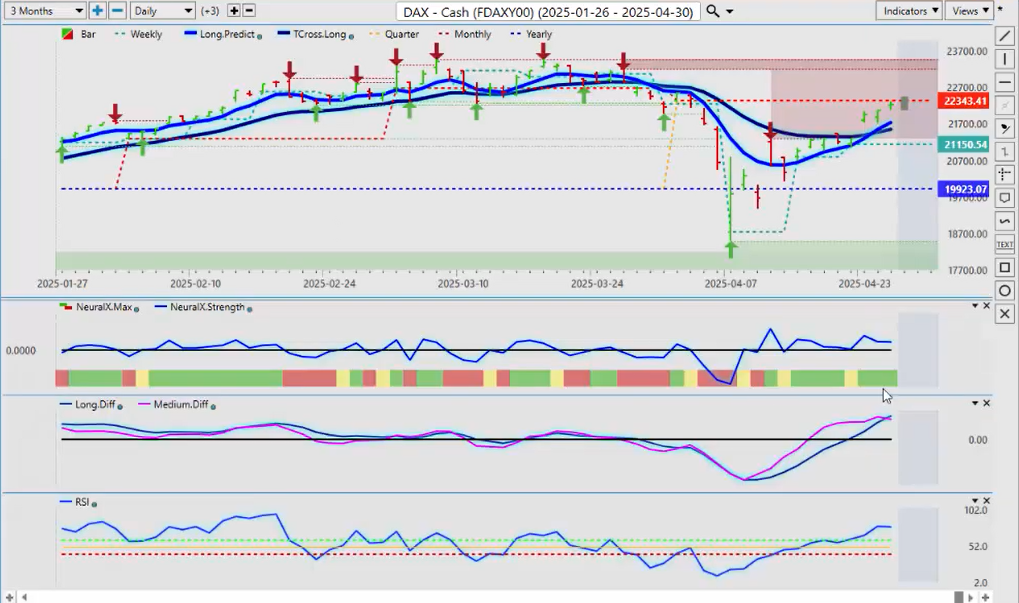
Now, when we look at some of the additional markets, the European market, the DAX — once again, I’ve been a strong advocate on the buy side of this. We’ve had our corrective move lower, but the DAX has held up far better than any of the US indices or some of the global indices, for that matter. So again, we’ve had our significant selloff here from the current monthly opening, but we’ve recovered from that, unable to hold below the calendar yearly opening price. Now a firm buy signal is forming. The only thing I would advise my friends in Germany — and you know who you are — be careful of that death cross right there. That is a potential warning sign that the upside, at least for next week, could be limited.
That’s the pink line over the blue line. So be very, very cautious with this. You can see that the DAX has parked itself right under that current monthly opening price. But our TCROSS long, now that’s coming in at 21,562. I believe that level will hold, and we should see further upside. But again, let’s let it correct a little bit lower first before we jump into this any further.
Gold
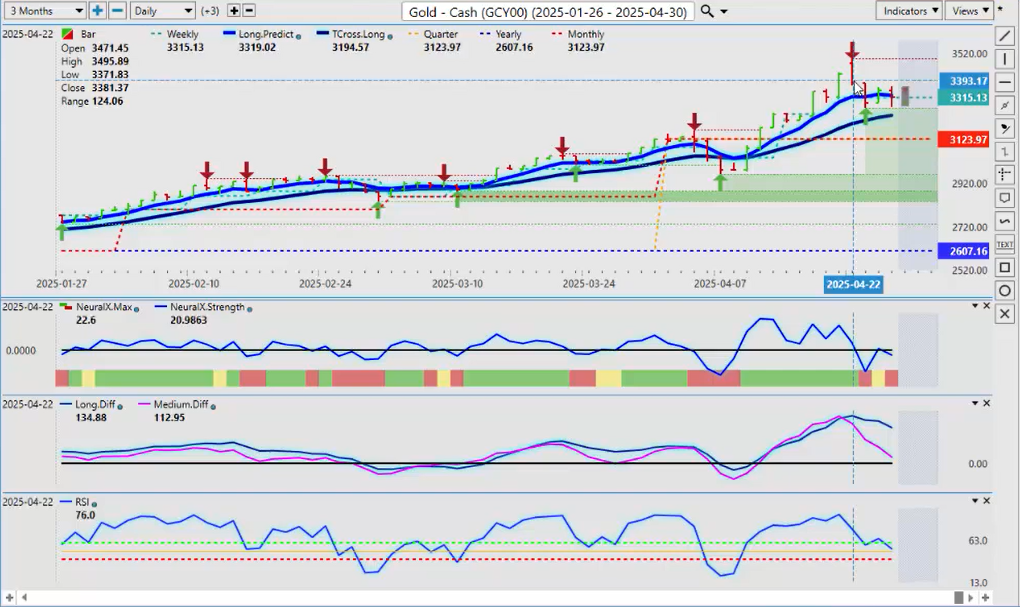
Now, when we look at gold contracts this month, again, gold was doing very well. But this is a very clear pattern that’s forming with gold at the end of the month — and in my respectful opinion only — it’s tied to that period of known US Dollar buying at the end of the week or the end of the month into the first week of the new month. We’ve had a retracement here, but I think we have further downside at least for the week. That death cross, as some of you guys love to call it — I love that name — the pink line over the blue line. You can see that happened actually before gold made that all-time new high.
We were actually doing this one in the VantagePoint live training room, and I warned everybody in that room — be very, very careful here because I don’t think we’re going higher. So this will be corrective in nature. Our tcross long, that’s going to come in at about 3,291. If that can hold, we can go higher. But I do think that gold can still go higher, but we’ve got to see what the Fed is going to do this month. What is his game plan here? Is he going to hold? Is he going to talk about potential cuts, inflation with the Trump tariffs? We don’t know. So either way, I think gold is going to benefit from that, but we need a significant retracement first and get past that period of known US Dollar strength.
Light Sweet Crude Oil
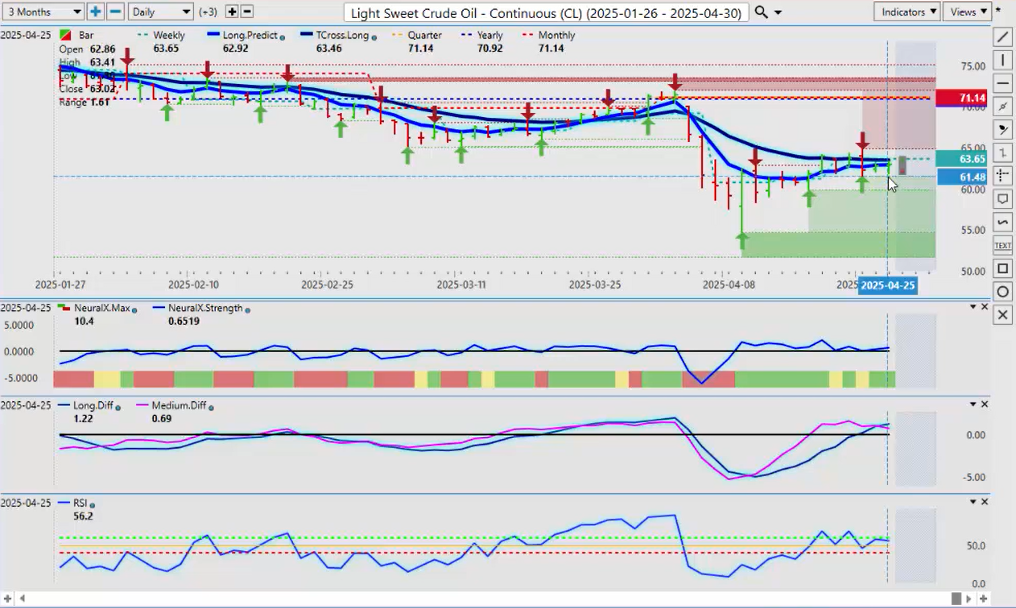
Now, we also want to make sure we’re monitoring Light Sweet Crude Oil in the coming weeks, because in most cases, that seasonal pattern kicks in when oil is strong — mid to late May through mid to late July, even into August. So, we’re pressuring that VantagePoint TORS long every single day last week, guys, banging into that TORS long. Usually, when I see this, a bigger move is forming — meaning that we are getting ready for a bigger move to the upside or it’s going to collapse and fall lower.
Now, we do have an MA DIFFF cross here that’s pointing lower, but we’ve got strong verified support down to 59.87, where I will definitely be a buyer into that area with that known seasonality getting ready to kick in here soon — probably within the next 2 to 4 weeks. So, I think it would be very difficult for oil to get below 54.64. If you are a buyer in this area, just make sure your stops are below that verified zone.
Volatility Index
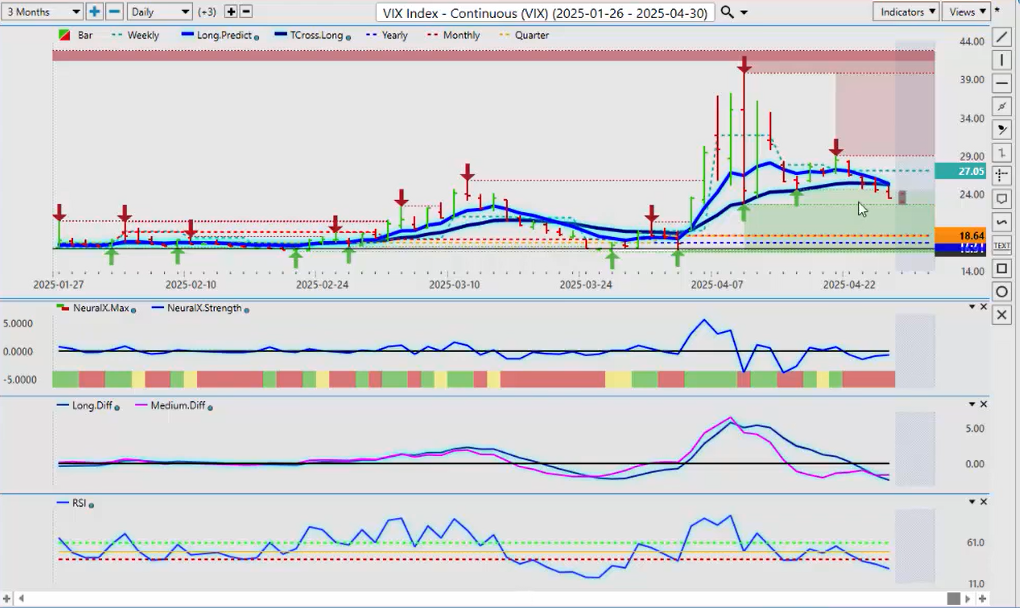
Now, we should also monitor the VIX. If we’re thinking about buying equities, then we want to have a very close look at the VIX. As you can see, once again, a little bit of a concern with that MA diff cross pointing back to the upside. Now, the VIX is still very much positive on the year — above the monthly and the yearly opening price — but the question is, can it hold above that? So, this is going to be up to what we get out of the tariff war — whether he’s going to back off on this a little bit, which I think he might. That should push the VIX lower, and then we’ll reassess this down around 18.64 or, more specifically, the current calendar yearly opening price at 17.71.
But the indicators are again very mixed here, but our resistance for the week next week — the TCROSS long — that will come in at approximately 25.23.
Euro versus U.S. Dollar
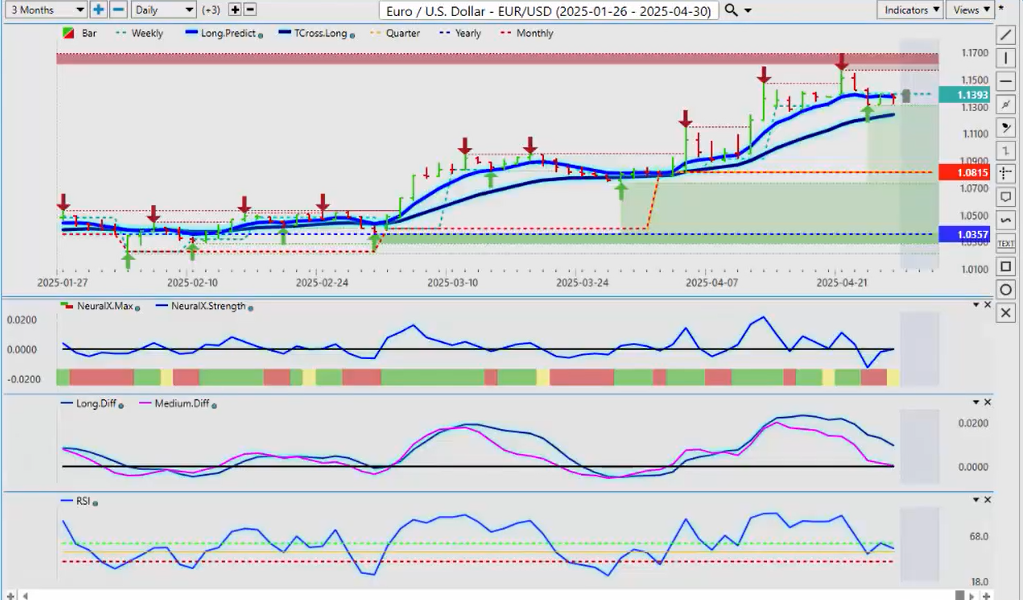
Now, when we look at some of our main forex pairs once again, warning everybody last week that in most cases the Euro — like gold contracts — there’s about a 90% positive correlation between the Euro and gold. So if gold tanks, it’s likely going to drag the Euro down with it. And that is exactly what happened. But structurally speaking, the Euro still looks pretty good here. The monthly opening price is 1.0815, the yearly opening price 1.0357.
But for next week, our TCROSS long — I can all but guarantee — we are likely to test 1.1242. But be careful next week around that particular area because it could be just corrective in nature with that period of known Dollar buying. So if we hold 1.1242, the primary trend in the Euro will continue to the upside. But my optimism again on that remains heavily guarded. Despite what’s happening in the US, in my opinion, the Euro is in worse shape than what the US is.
So, it could be a somewhat of a theory of “prettiest horse in the glue factory,” so to speak, but again, watch that key level.
U.S. Dollar versus Swiss Franc
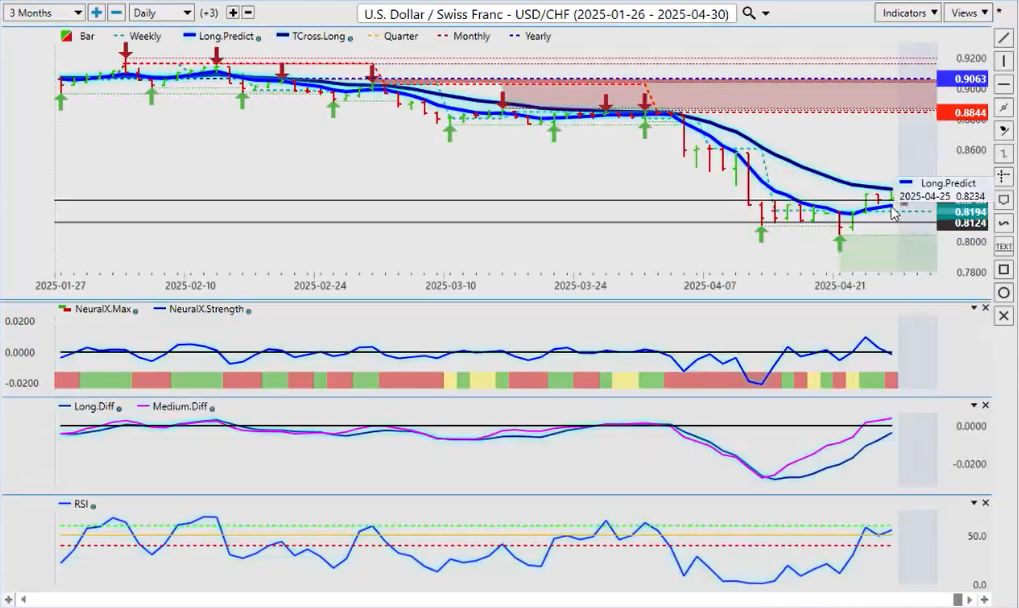
Now, the US Swiss Franc — once again, if the Dollar Index can pull higher, then US Swiss Franc will break through the TROSS long at 0.8340, but that is our main area that we have to watch more specifically for next week. If we can’t break through it, then the primary trend will remain to the downside. But with the pink line crossing the zero line, the MA diff cross warned us not to buy down here.
You can see I’ve even drawn a line right across here. Last week, I’m buying this every single day based on that pink line crossing the blue line. What that’s doing for new viewers is it’s showing the medium-term trend against the longer-term trend. So, the trend has clearly been down, but that medium-term trend is weakening, and it’s showing that there’s a move back to the upside. That is what occurred.
So again, the only way we can continue buying this next week is if we can break through 0.8340.
British Pound versus U.S. Dollar
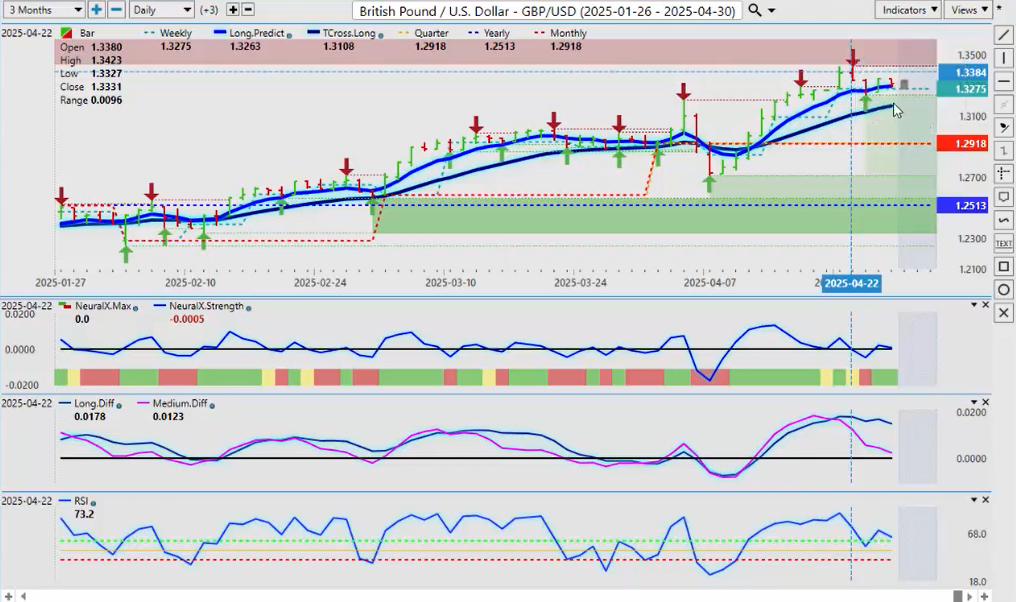
Now, the UK — again, not in much better shape than everybody else here — and I think they will start to cut soon. So, very few buyers up here. We have a verified resistance high that’s coming in at 1.3423. I do think that next week we will move towards a corrective move towards 1.3164, and then we can reassess.
But if we can break through that TCROSS long, we will very quickly run down to the 1.29 level. Just to be clear, the primary trend on this is still up. We’re positive on the year at 1.2513. We’re looking for that corrective move so we can pick up longs again. But let’s assess what we get from the Fed here.
There’s going to be a lot of Fed chatter next week. We’ll see what transpires. But for now, a retracement is very likely based around the core VantagePoint indicators.
U.S. Dollar versus Japanese Yen
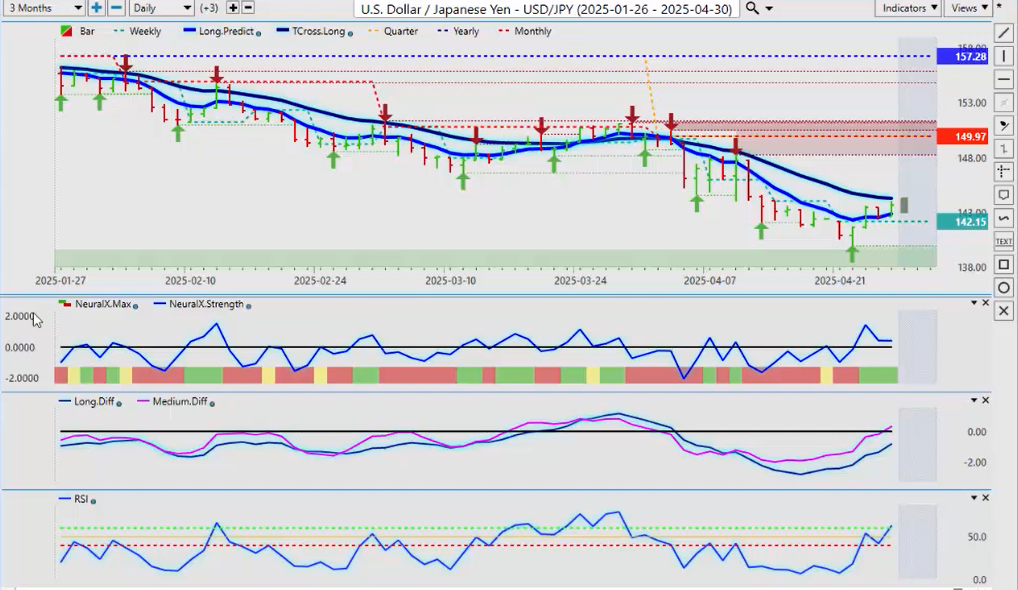
Now, the Dollar Yen — I’ve been a relatively strong advocate of shorts on this particular pair. You can see that structurally we’re below the yearly opening price and the monthly opening price. But that’s April — we’re going to get a new monthly opening price, I believe, on Thursday. Excuse me.
So on Thursday, we’re going to get a brand-new monthly opening price. But the bias is still lower after a corrective move higher. However, if equities continue to advance — the S&P 500, the Nikkei, the DAX — if the global indices can move higher, then that could pull this pair back up. But again, it would absolutely be corrective in nature.
The only thing that could offset this is the market being susceptible to the carry trade — meaning buying dollars, selling yen on the borrowed money. But again, that’s a very volatile trade these days, and there’s a lot of people that are nervous about this particular trade, much like the basis trade — they’re very nervous about that too. So, we’ll continue to monitor this.
But the TCROSS long is our line in the sand for next week — 144.26. Now, it is likely that we would move higher, but we would be looking for a selling opportunity as the carry trade comes apart. So again, if we can hold above 144.26, we may be able to start to slowly grind toward 149 by Thursday. It’s possible, but I think very, very unlikely.
I think more than likely after we’ve had a corrective move higher, the primary trend this year will continue as bigger traders start to exit the carry trade, forcing most of your Japan pairs — Euro Japan, Great Britain Japan, Canada Japan — and of course they all stem from US Japan — pushing all of these pairs lower. So we’ll monitor that for now, but we are likely to see some potential upside at least for the next week.
U.S. Dollar versus Canadian Dollar
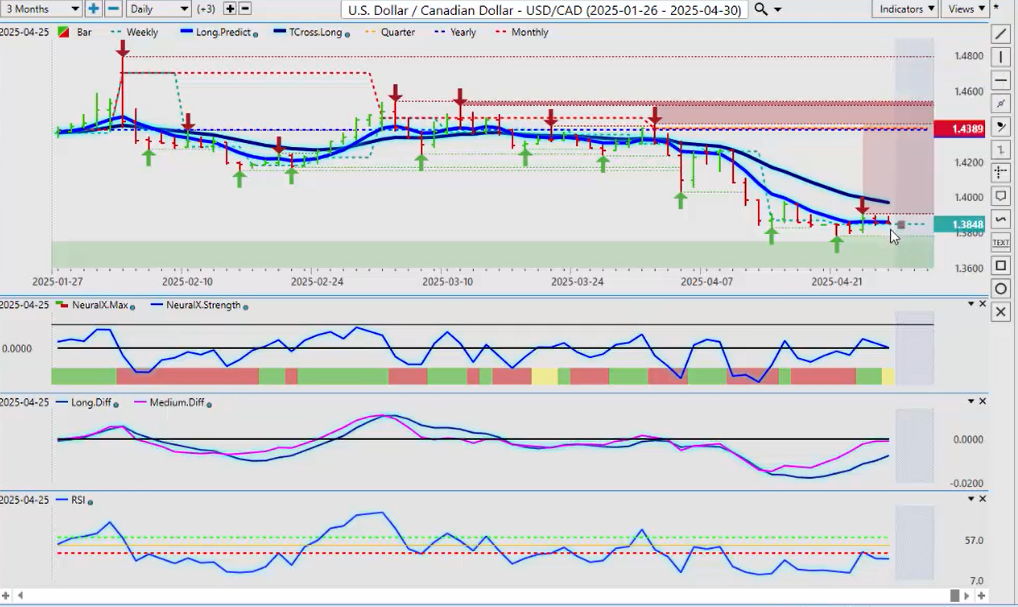
Now, the Canadian Dollar — likely to see some volatility next week. The Canadian election is on Monday. We’ll know who the next prime minister is. Economically speaking, that will set the tone likely for the Canadian Dollar, whether it’s either going to rebound or it’s really going to come under selling pressure.
So for now, the US Canadian — the Canadian Dollar is relatively strong against the US Dollar for now. But I would look for a retracement to the Tcross long next week at up to 1.3970. Then we can reassess if we want to continue to buy this pair.
But I think it’s unlikely there’ll be a big move to the downside regardless of which party gets in. In Canada, there’s going to be a cooling-off period. We’ve got to see if it’s a minority government or a majority government. But that will set the tone for the Canadian Dollar, in my respectful opinion, for at least the next six months.
Again, expect volatility in the Canadian Dollar across the forex market and the cross pairs. But I believe selling the Canadian Dollar is still the better play — or buying US Canada, Euro Canada, Great Britain Canada, Aussie Canada, New Zealand Canada. All these pairs are basically run off of the US Canadian pair.
Australian Dollar versus U.S. Dollar
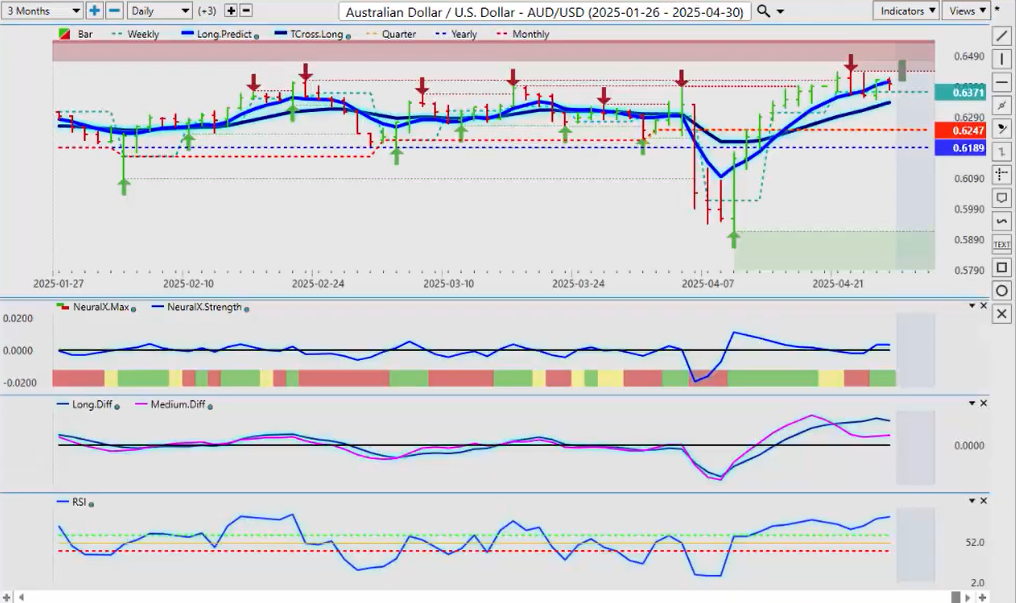
Now, when we look at the Aussie and the Kiwi — once again, if stocks continue to go higher, then the Aussie and the Kiwi will follow. A little bit of concern here. We’ve got a new verified resistance high, 0.6439. I’d like to see us get above this quickly and get out of this area here.
But we are positive again on the year, 0.6189. But you can see how quickly that can change if there’s more tariff talk between China and the US. If they don’t put this thing to bed soon, that actually could really hurt the Aussie, the Kiwi, and the Canadian Dollar — a number of different currencies. So we’ll see what we get next week.
Things have cooled off a little bit, I would say, between China and the US. If it continues to point towards a resolution — you know, on these tariffs and the trade war — then the Aussie could easily extend higher. But just know what is the driver here between the Aussie and the Kiwi: the driver on both of them is going to be the tariff war — the trade war — between the US and China.
So if it settles, then the Aussie and the Kiwi will go higher. But for now, they both look a tad overextended here.
New Zealand Dollar versus U.S. Dollar
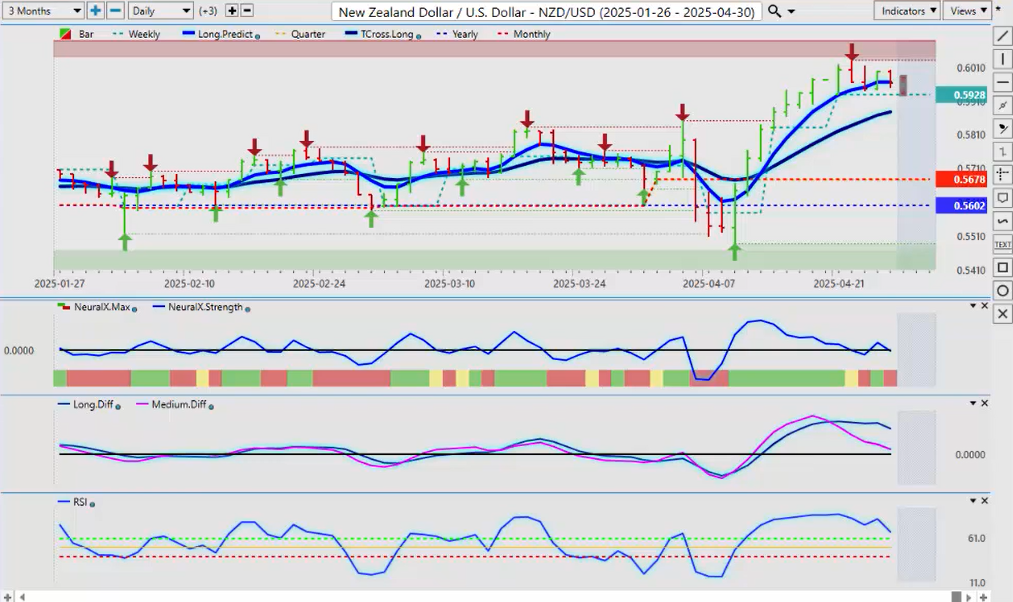
I’ve got an MA diff cross on both. So, I would look for a retracement back to the TORS long potentially on the Aussie and the Kiwi.
But then we would also be looking for a potential buying opportunity here because either way, the Aussie and the Kiwi — their trading partner is still China, and China is still doing very well. So I believe that these currencies have room to extend. They just need to correct a little bit lower.
So, expect another choppy, volatile week next week. But with that, there will always be opportunity based around the intermarket correlations.
So, with that said, this is the VantagePoint AI Market Outlook for the week of April the 28th.


