


Welcome to the Artificial Intelligence Outlook for Forex trading.
VIDEO TRANSCRIPT
US Dollar Index
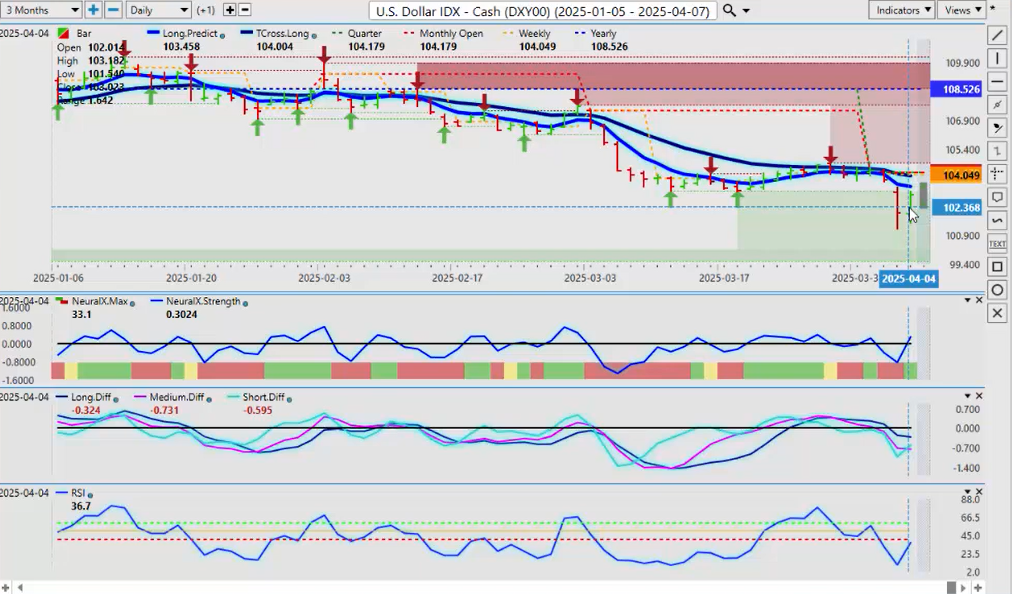
Okay, hello everyone, and welcome back. My name is Greg Firman, and this is the Vantage Point AI Market Outlook for the week of April 7th, 2025. Now, to get started this week, we’ll begin where we always do with that very important US Dollar Index. Now, no shortage of volatility this past week, that is likely going to continue into next week. Now, the dollar selling off on the tariffs but quickly recovering on Friday after the non-farm payroll number and after the Fed comments about inflation and potentially looking at keeping rates where they are or increasing rates. So, that supported the dollar indirectly and caused a significant sell-off in Gold. Now, that’s the fundamental side of this, but when we look at the dollar, we’re negative on the quarter, we’re negative on the month, the quarterly opening price 10417. I do anticipate the dollar can retake this level. If we look at the Dollar Index, not just with what’s with the Euro, the British Pound, the Yen, the Canadian Dollar, but if we look at the Aussie and the New Zealand, they’re getting absolutely pummeled by this tariff news with China and the US. So again, the dollar holding its ground, coming out of the gate here. Reverse check mark on the predicted RSI suggesting we’re going to recover if nothing else back to our TCROSS long at the 104 level. Now again, this is all news-driven, these prices in the equity markets, the commodity, particularly the currencies, all of this, even Oil being affected by the tariff war. So right now, that T cross long, we need to break through this particular level if the dollar can hold its ground.
Gold
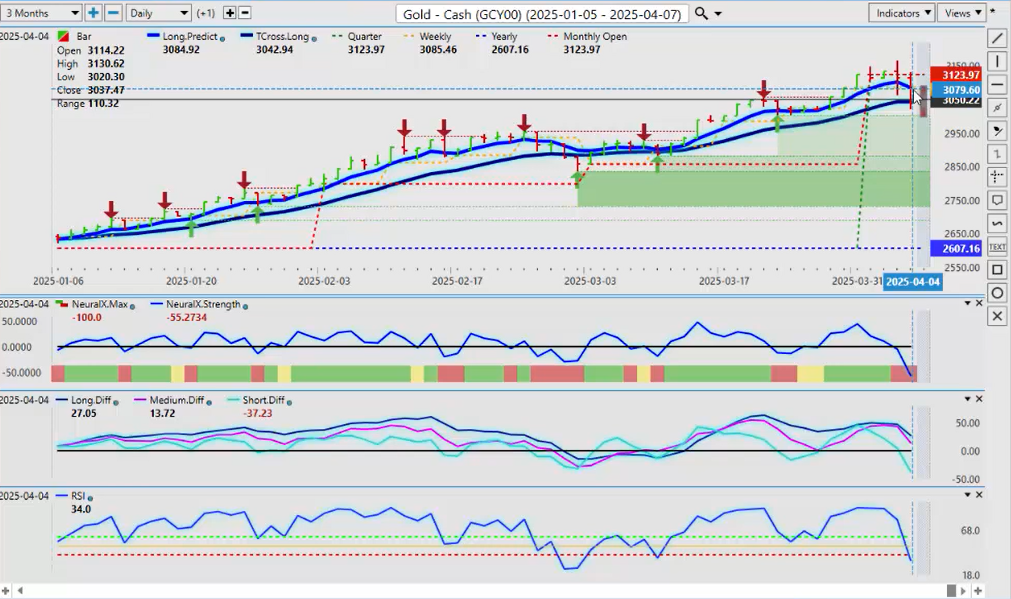
Now, with the Gold Contracts, we can see that they were hit pretty hard with the Fed comments last week at the end of the week discussing inflation rates. All of these things were very negative for gold. Now we’re finishing the week on our Tcross long, 3,042—that’s the level to keep your eye on. Gold, unlike the Dollar, still remains very bullish on the year. We’re above our yearly opening price, 2,607. That yearly opening price still very strong here, guys, but again, the fundamentals are putting pressure on it. We’ve given up the quarterly and the monthly opening—that would be our retracement point back to 3,123, but it could be very difficult for Gold to do that based on the current headlines.
S&P 500 Index
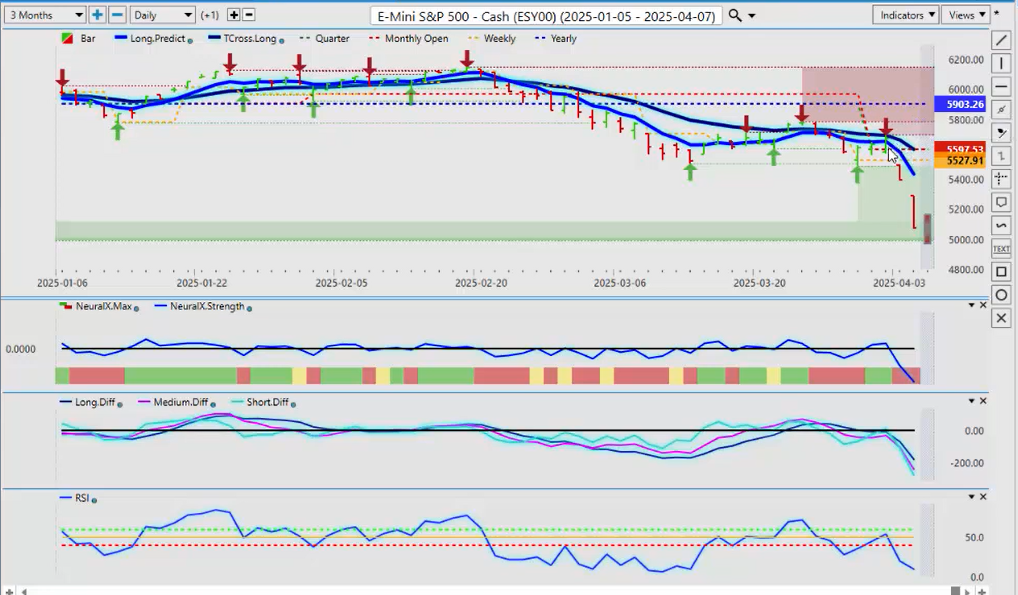
Now, with the S&P 500, once again, we want to be very cautious about using short-term indicators like the New York Stock Exchange BPI indicator, stochastic, some of these very reactionary indicators. Again, as I had discussed last week, the S&P 500 was already bearish going into this week to begin with. There were also short-term indicators from VP that the stocks could go higher, but again, using that TCROSS long, the predicted moving average based on the correlation to 31 other markets—that’s the difference between these different types of technical indicators. By bringing in those correlated markets, so while an index like the New York BPI may say okay, well these stocks in here are bullish, that’s all it’s looking at. It’s not looking at correlated markets, the Dollar, Oil, Gold, stocks from other sectors, and it very often will produce a false signal. So again, as per last week’s outlook, saying that we have to clear that T cross long, the market retraced exactly to the VP predicted moving average with the correlation to 31 other markets, and it was rejected at 5,693 and down we’ve had a significant selloff. So again, there’s a lot of doom and gloom out there, guys. Right now, let’s see what we get next week; let’s see if we can find a bottom. So if we go back in our charts, we look for additional verified zones here, and as you can see, we’ve got a fairly significant one down here, and that’s at 5,119. So again, we’re closing below that area of 5,074, so be very, very cautious of a bear trap down here. Now I perfectly well aware that everything is negative, and the media is certainly fueling this narrative that it’s everything is horrible, but very often that can be a buying opportunity. Now we would watch our VP indicators very, very closely next week for any kind of potential reversal here. Again, I think this is a little bit overdone, but that would be an opinion, a subjective opinion. Is there room for the S&P 500 and the global indices to go lower? Yes, of course, there is. So the additional support that I can see, going back to actually April—and this is where it gets kind of interesting using seasonal patterns—last April, this is April 19th, we had hit a bottom, and again, that bottom came in the low of 4,953. So I believe we can get to that particular area, but just be careful when we get there because again, you can see that it was last year at the end of April that everything turned around, and we started going back up again. So we’ll watch this area very closely. I would certainly agree at this time that the indicators in VP remain very bearish at this time.
Bitcoin
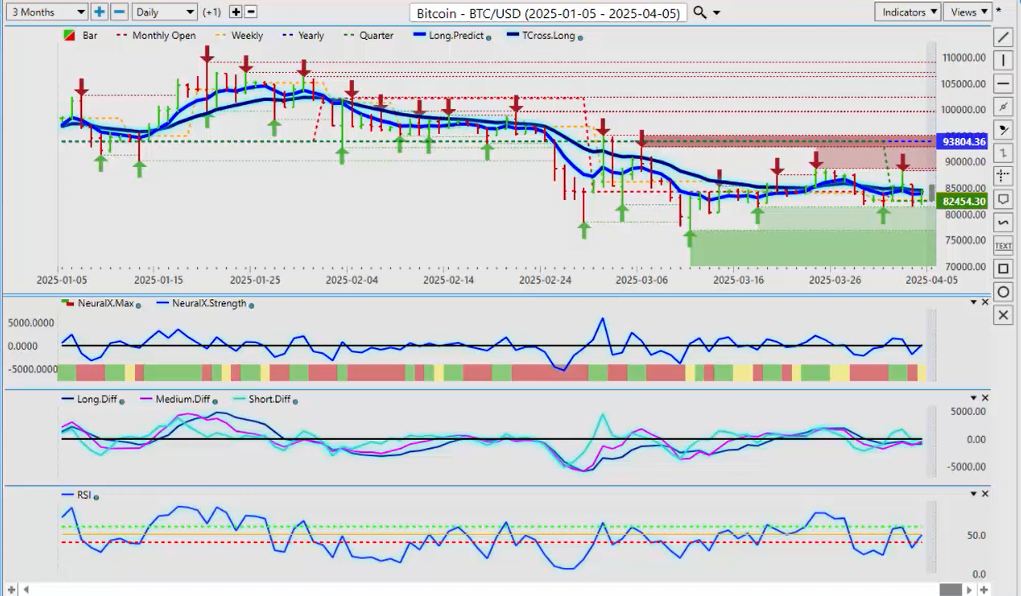
Now Bitcoin, actually coming out of this pretty good here, guys. It’s not bad at all, a little bit of a rally actually, closing the week out at 84,153. Money coming out of Gold but it’s not coming out of Bitcoin. Money actually starting to go into Bitcoin. So the indicators here on VP are saying that Bitcoin is neutral to slightly bullish, but again, we’re going to watch that quarterly, monthly, the quarterly and the monthly opening price in April will be the same number, as you can see, 82,454, and the monthly will come in at the exact same number. So that’s our support level. We, as long as we’re holding above that level, then the biased is to the upside for the month of April. But again, we are negative on the year, but not by a lot. So again, we’ll see how this one plays out, but there is an MAF cross forming on Bitcoin. The pink line over the blue line, suggesting that Bitcoin could actually start to move up from here. So again, keep an eye on a hard anchor point, guys. We’re starting a new quarter, that quarterly opening price above it long, below it short. We want to keep it simple, use our correlated markets with hard anchor points. The last thing we want to do is get into a rolling performance model, where we’re moving the opening price around, the random 15 days, the last random 30 days. No, guys, we are starting a new quarter, we want to focus on this level, and see if we can remain bullish on Bitcoin going forward.
Light Sweet Crude Oil
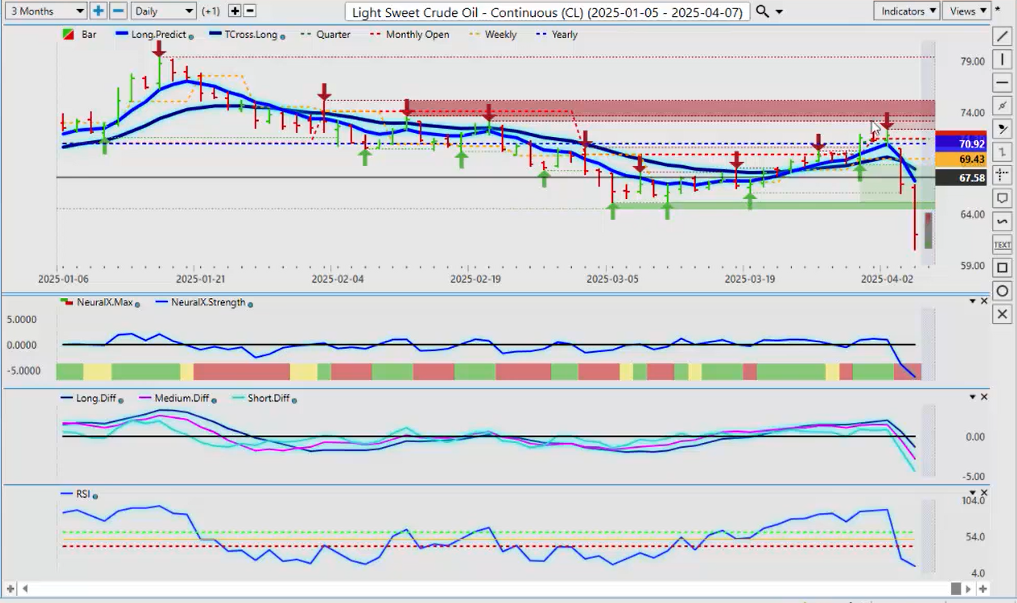
Now, with Light Sweet Crude Oil, a very difficult, very much follow the equity markets down with the dollar. I believe that oil can recover here. Recessionary talk, yes, there could very well be a recession, but the market needs to adjust to the new environment we’re in. But that is a significant sell-off, and 90% of the time, guys, I would never buy or sell a bar, excuse me, that looks like this because it’s a panic reaction, profit-taking, margin calls potentially. There’s a lot of rumors, by the way, that there were heavy, heavy margin calls on gold contracts on Thursday and Friday last week, again accelerating that move to the downside. I suspect Oil could be very similar to that. So we’ll see if this can play out, but again, we always want to make sure we’re going back to where we were a year ago, and you can see that oil was moving lower a year ago at this time anyway. So again, I believe that the market, Monday will be a very, very—I would strongly advise to just go to the sidelines on Monday, let this thing shake out a little bit, and see where we’re at on Tuesday, because again, this is an outlook, guys, not a recap of something that’s already taken place. I need to point that out on a weekly basis. We’re looking forward, so again, we’ll see what we get for a Monday high and low, and how broad the range is for a single day, and then use those levels for the remainder of the week to buy and sell from. Right now, the indicators in VP are pointing lower, and volatility has certainly increased.
Volatility Index ($VIX)
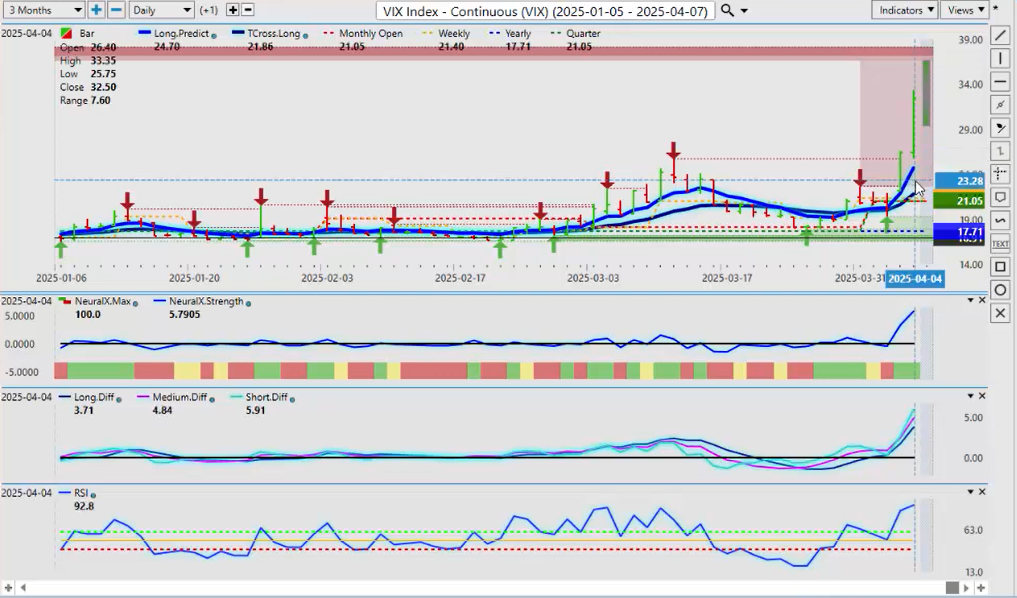
When we look at the VIX, the VIX basically right off the chart here. So again, would we buy, continue buying the VIX on a bar that looks like this, on a panic selling in the equity markets? Respectfully, no, I wouldn’t. I suspect that we will have a retracement back down to our long predicted, the additional predicted moving average from Vantage Point. That level coming in at 2,470, that’s our retracement point. Again, we don’t want to bring in random Fibonacci numbers and all these things. We need correlated markets, guys, to see that. So I think that the market will likely rethink its position, but it depends on what the rhetoric comes out of the White House, out of China. Not overly concerned with what’s coming out of Canada, but some of the other countries globally, we do want to pay attention to this next week as to what their plan is. Right now, one could say the VIX is heavily overbought at 92.8, but that’s meaningless, guys, if the market continues to get into panic selling on the main indexes.
DAX
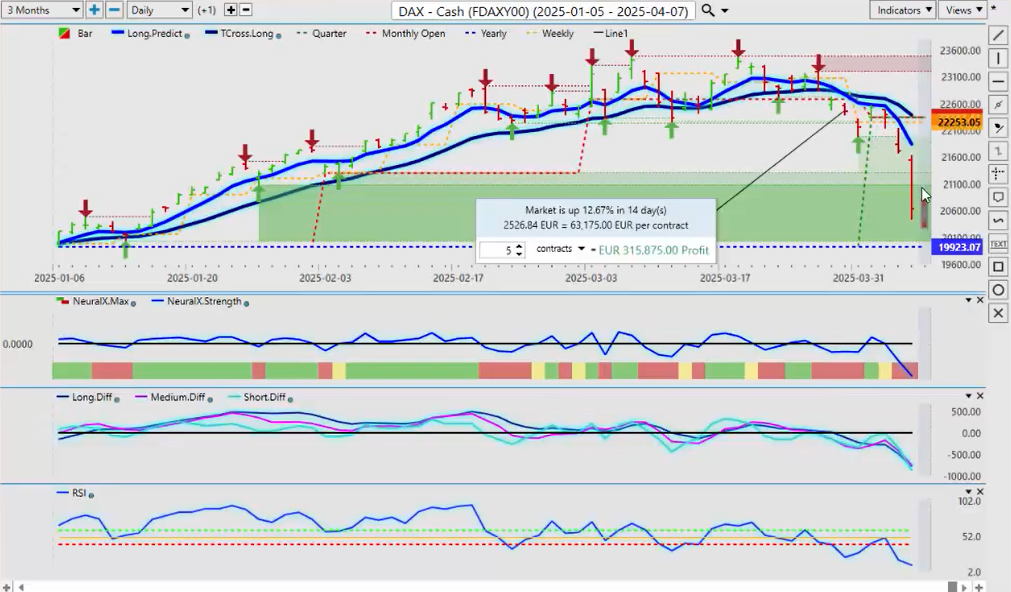
Now the DAX again, following that S&P 500 down hard. This is all a fundamental event here, and I believe that the DAX is held up very well. We’re still positive on the year. I will point out that the S&P 500, the NASDAQ, have not been positive on the year for an extended period of time. The last time, when we look at the S&P 500 again, when we look at the last time we were above the yearly opening price, that would go all the way back to February 28th, when we actually do a comparative analysis to the DAX, it has never been negative on the year, and even after the utter carnage this past week, then we want to make sure we’re looking at this from an accurate standpoint and saying, ‘Okay, well, what’s interesting here is that the DAX remains positive on the year.’ So when I look at the profit calculator, it’s still up 3.56%. So, when you do a comparative to the North American equity markets, there’s a very significant difference there, and I suspect that the European equity markets like the DAX and the CAC 40 may be able to hold and stay positive on the year. But either way, that is the focal point at 19,923.
Euro versus U.S. Dollar
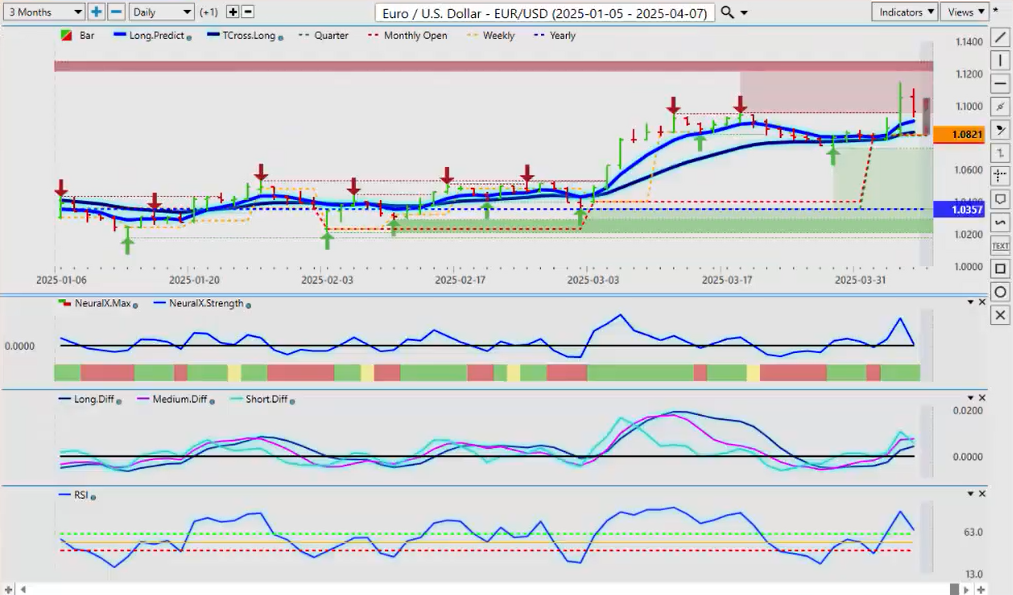
Now, as we go into some of our main forex pairs here, guys, they’re all basically showing something very similar, except for the Aussie, the Kiwi; they are really taking a hit with that correlation to the Chinese market. So again, when we look at the Euro, it is immediately reacted, but now the fundamentals are going to kick in here, and the question is, are they going to rethink being long on the Euro if the Fed is turning hawkish, talking about higher inflation, not cutting rates? So it’s going to be a very fundamentally driven trading couple of weeks here, maybe even longer. But for now, I anticipate that we are going to retrace to the quarterly opening at 10,815, and then we’ll see how the pair reacts to this. If that level holds, then we can go higher. The Euro is positive on the year; it’s above our Tcross long, and again, that Tcross long pivot level, that’s coming in at 10,833, that is basically intersecting with the current quarterly and monthly opening price. So very important that this area holds. I have no problem buying this pair if I can hold above that level, and if the VP indicators and their 31 with the correlation of 31 other markets remain positive. So my optimism on that, based on the Fed’s comments, remains heavily guarded.
U.S. Dollar versus Swiss Franc
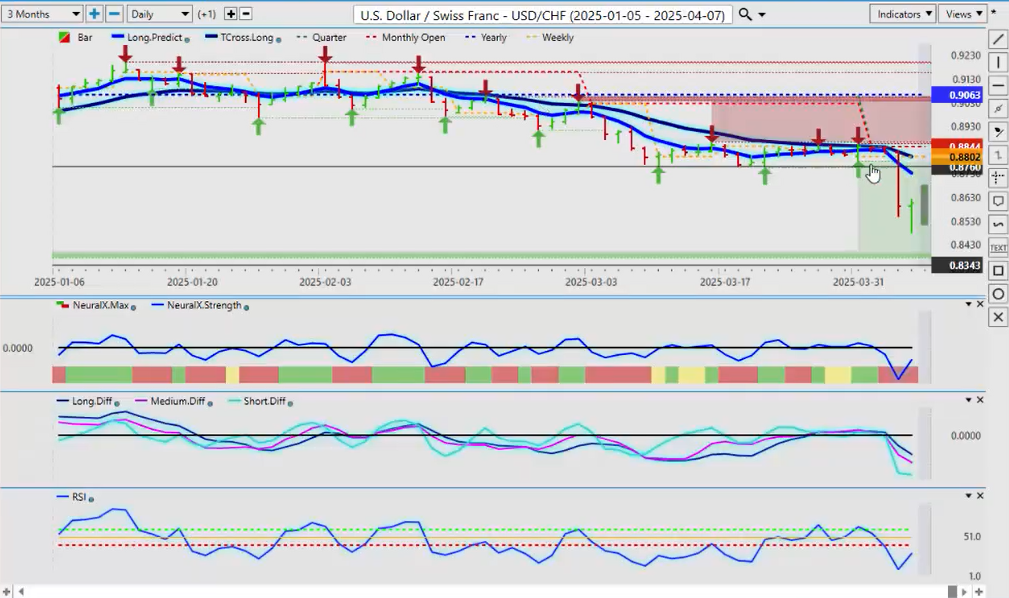
Now US Swiss Franc has plummeted also. Now, one of the questions I was asked the other week is, if the Dollar is strong, why doesn’t US Swiss Franc go up too? Well, the answer to that, guys, is correlations. The Swiss Franc and the Japanese Yen have a very high inverse correlation to the stock market or risk on risk off. So if those equity markets plummet, money goes into the Yen, usually the Dollar, and heavily into the Swiss Franc, neutral currencies, neutral countries. So again, that’s what’s happening here, and the question is, will it remain? Well, we’ve got a reverse check mark on the neural index strength, suggesting that well, wait a minute, maybe this can recover, but it’s going in order for this pair to move higher, you’re going to need the stock market recovering. So how much further can stocks go? Well, that’s what we’ll see. I’ve given you a rough idea to gauge it with the S&P, and if that level holds, then this would start to turn around. But right now, the bulk of the VP indicators are bearish. We’re below the yearly and the quarterly opening, and the monthly opening, so it’s been negative for some time here. But I would be looking for a corrective move if nothing else back towards 8,732 once things settle down.
British Pound versus U.S. Dollar
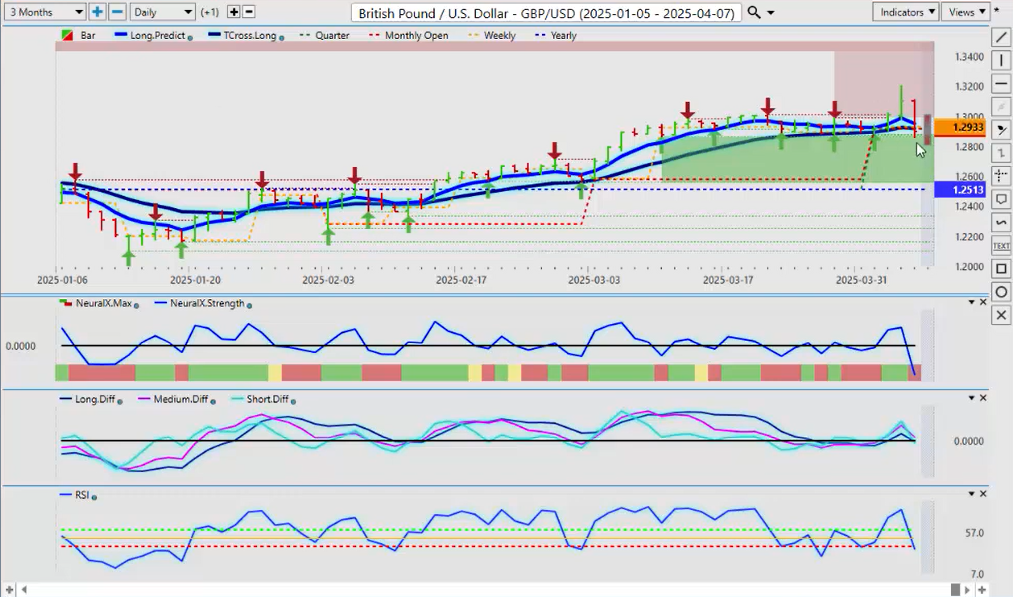
British Pound here did not do as well as the Euro did, and now we’re starting. We’ve closed below a critical level, 12,918, not by a lot. We’re closing at $129.99, but these tariffs are going to affect the UK also, and they’re likely going to retaliate too. So there’s going to be a lot of volatility, but this is what I would look at from conventional indicators using a predictive RSI with a 60/40 split. So that is telling me momentum is building to the downside here. So I think the Pound could be in a bit of trouble next week, and our retracement point would be back to the calendar yearly opening price, 12,513. Again, I will stress it very clearly that we need to not monkey around with random anchor points, the last 30 days, the last 60 days, the last 15 days. We need to keep our anchor points solid. We know where our quarterly opening price is up here, and we know where our next target is down here at 12,513. So again, watch your Monday bar, the high and low of your Monday bar, and then start looking at the market on Tuesday. I would strongly recommend to be very cautious on Monday because it will be very volatile, but there is a downward biased here for sure.
U.S. Dollar versus Japanese Yen
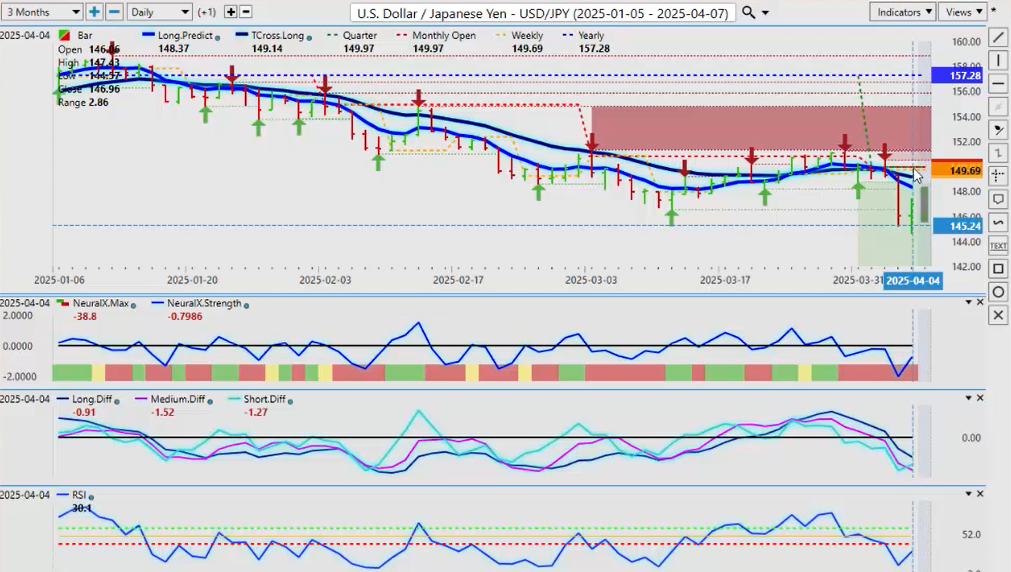
Now, when we look at the Dollar Yen, again, the Yen is going to fall into that same category as the Swiss Franc, and that’s the nugget you’re looking for there, from a correlation standpoint, is that equities down, Swiss Franc, Yen, and usually the US Dollar up. That’s how this game works, guys, based on correlations. And so again, that labor report definitely helped the Dollar on Friday. It was a reasonably good report; there were positives and negatives there, but overall, it was a pretty decent report, but there were downward revisions. So again, what is the Fed going to do here? If the Fed is not going to cut, it could send this back up. So our retracement points will be 14,837 and 14,914, and again, that’s exactly where our yearly opening or, excuse me, the new quarterly opening and monthly opening price are residing right at that level, $149.97, slightly higher, excuse me, but that’s where all of our resistance is. So if we’re going to sell, I would prefer to sell up near this area instead of way down here. But again, if the equities continue to crash, then money is going to go into safe havens, Yen, Swiss Franc, and potentially the Dollar.
U.S. Dollar versus Canadian Dollar
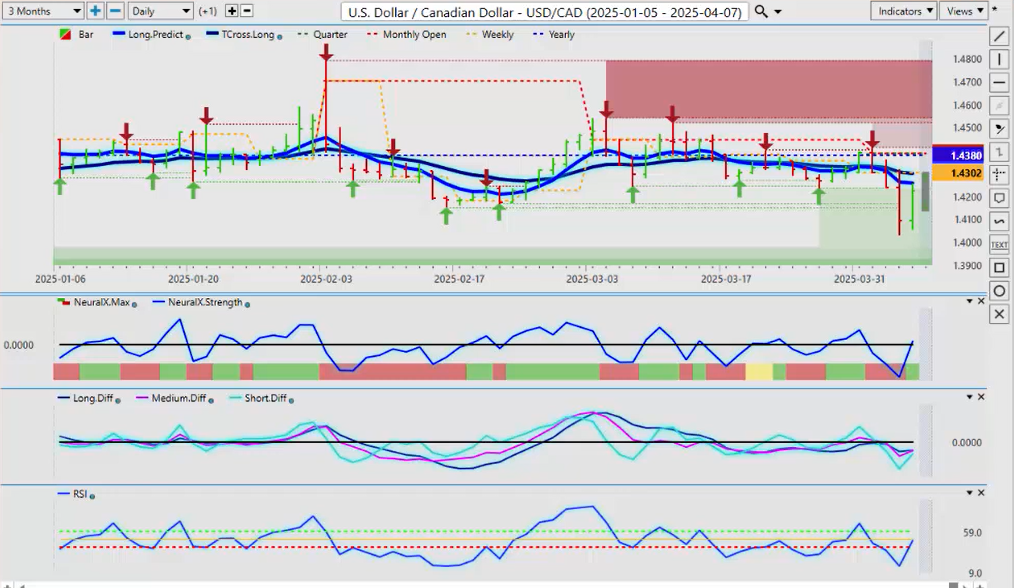
Now the US Canadian pair, Canadian Dollar, have been in the headlines a lot lately. Some tough talk coming out of Canada on these tariffs, but Canada took the least amount of tariffs there, but they still got them, and it’s a very complex thing with the automotive industry and everything. But right now, any gains the Canadian Dollar made, it immediately gave them back on Friday. So right now, with this pair, the savvy trader can use the TCROSS long and the long, the current quarterly opening price. Why that’s why it’s so important because they’re intersecting at each other, 14,389, the T cross long at 143. So there’s a lot going up, or excuse me, the monthly opening and the quarterly opening up at 14,389 with the quarterly. So again, the TCROSS long coming in right at that particular area. So if you’re going to sell, that’s where it would be. But again, that is a high-risk betting on the Canadian Dollar. The Fed is—I can almost guarantee the Bank of Canada is going to be looking at cuts, not hikes, where the Fed now is saying no cuts, potentially no cuts. So that interest rate differential favors the US Dollar here. So again, putting buy limit orders just above the monthly opening price at 14,389 would be a reasonable strategy. Just be careful around that yearly opening price. If we get through both of those two levels, then you’ve got yourself a long trade with this US Canadian pair potentially reaching 150 or higher.
Australian Dollar versus U.S. Dollar
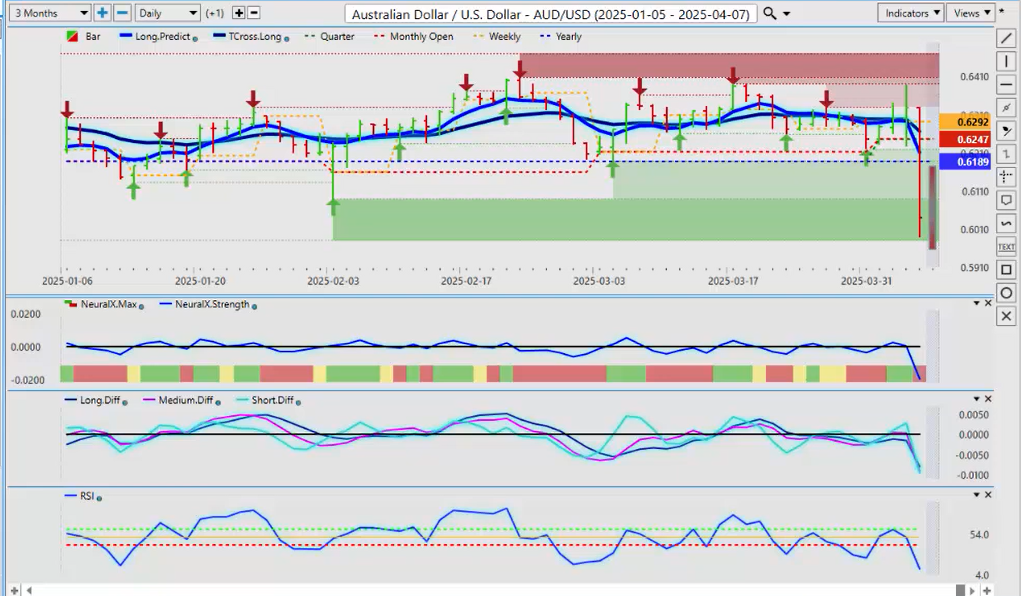
Now the Aussie and the Kiwi are the exact same trade, guys, and they’ve both taken a massive hit from the tariff announcement. So one is the same as the other; they’re still showing downward momentum, but again, selling a bar that looks like this is usually does not work. The amount that this is given up in one day is because, with all reality, the Kiwi and the Aussie US pairs, they usually move around anywhere from 20 to 60 pips a day, very slow-moving currencies, but they’ve taken a big hit because of China putting the tariffs onto the US, the retaliatory tariffs, and how is that going to affect Aussie and the Kiwi?
New Zealand Dollar versus U.S. Dollar
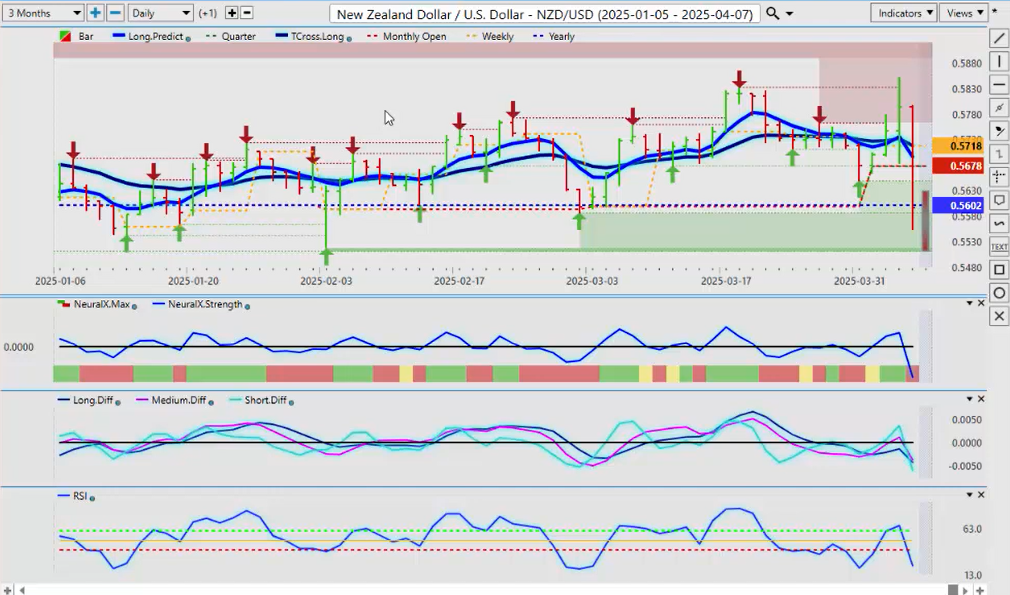
Well, they are directly tied to that Chinese economy, right? So they have reacted. So watch for a potential reversal on both of these pairs in the latter part of next week, but use the yearly opening price as your guideline, 5,602, and you can see we just barely closed below that on Friday. So watch that area. We’ve got some additional verified support this year, that’s down to a low point of 5,517. It is very likely we will get down to that area on Monday or Tuesday, and the Kiwi, we look at it the same way, but you can see that the Aussie took the brunt of that sell-off on Friday. So it also has more to recover back to the upside if things start to calm down. So it will be a very choppy, volatile week, but I do think we will have some opportunity will surface come Tuesday or Wednesday, but be very, very cautious prior to that. So with that said, this is the Vantage Point AI Market Outlook for the week of April 7th, 2025.


