


Welcome to the Artificial Intelligence Outlook for Forex trading.
VIDEO TRANSCRIPT
US Dollar Index
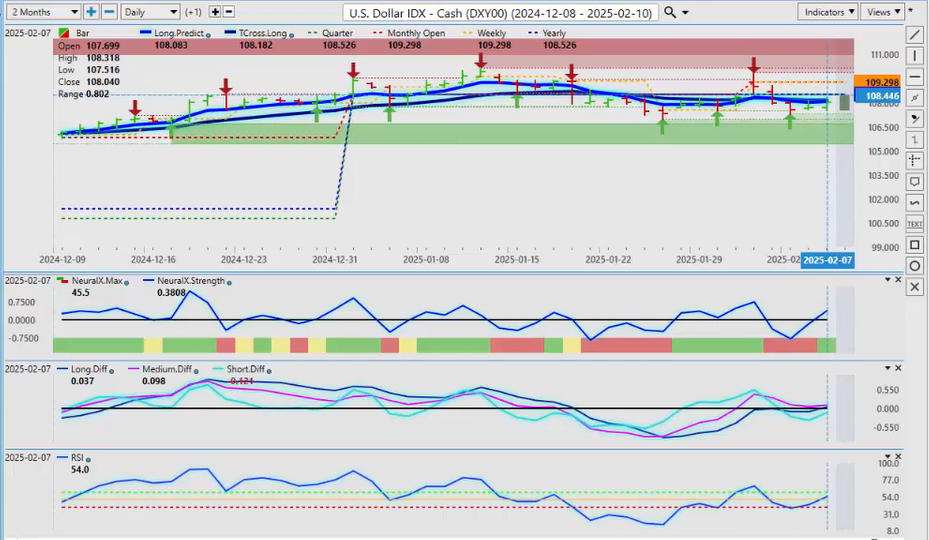
Okay, hello everyone, and welcome back. My name is Greg Frrman, and this is the Vantage Point AI Market Outlook for the week of February the 10th, 2025. Now, to get started this week, we’ll begin where we always do, with that very important US Dollar Index. Now, a bit of a mixed bag with that payroll number: there were some good points, some bad points, a lot of revisions, but here’s where we’re at. Our predicted differences are not showing a lot of downward momentum on the predicted RSI, suggesting there is still some life in the dollar for now. Our neural index and our neural index strength both are looking good, but we’re holding below the calendar yearly opening price.
Once again, I’ve shortened my charts up here this week to two months so we can very clearly see where we’re at on a yearly basis. We don’t want to move these targets off; we want to know where we are in the current month, the current week, the quarter, and, of course, the yearly being very important. So, when we look at our monthly opening PL price in the red here, once again, not looking very well at all, that monthly at 109.29. So, in order for the dollar to get moving, it’s got its work cut out for it. Now, Mondays have been notoriously volatile. I probably will see the same thing this coming Monday, so be careful. Let all markets come in before you start executing trades, but for now, the chart is showing that the dollar is not quite finished yet because again, a lot of volatility last month with the tariffs. I believe that those tariffs are still in place; they’re still going to affect things. They’ve been suspended for a month, but they’re still there, guys. So, the volatility is still going to be there for now. A slight bias for the dollar to start the week stronger, but again, in most weeks, the US Dollar is the strongest, or in most months, excuse me, the dollar is the strongest at the very end of the month into the first week of the new month until the Tuesday or the Wednesday after the non-farm payroll numbers. So again, be very careful on a potential Monday Tuesday reversal coming up.
Gold
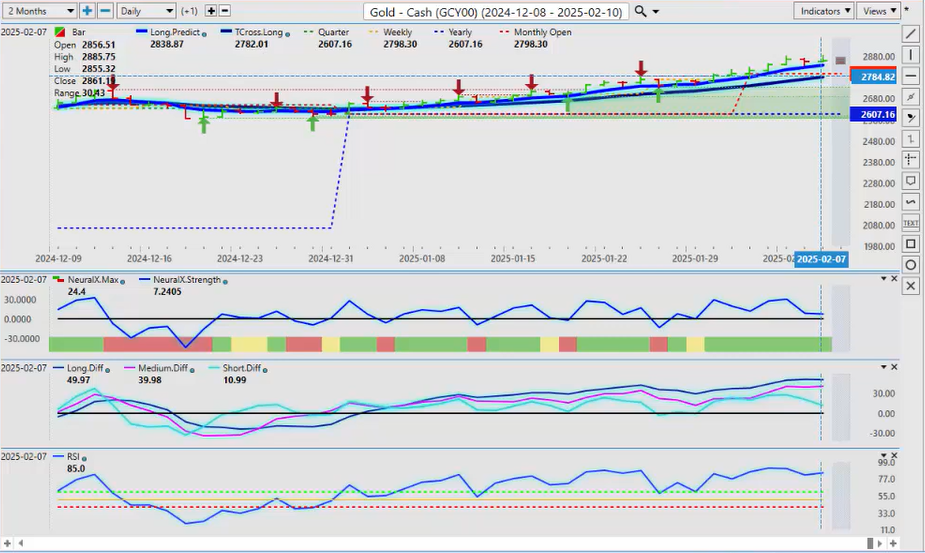
Now, when we look at gold prices, again, gold prices still continuing to advance. Here, our Tross long is at a very lofty 2782, our TR Cross, or our long predicted, 2838; those are our two main support levels. I do believe that gold will retrace back to these levels on even a shorter-term bout of dollar strength. Now again, the monthly projected targets on gold have largely been hit; potentially, we could hit as high as 2974 this month, but we have to break through the 2900 level to even have a shot at a target like that. The indicators in VP are starting to flatline; our predicted differences are running sideways here, predicted RSI 85. It is overbought, but again, guys, overbought, oversold tools in a momentum-based market, we want to be very careful because, technically speaking, the gold contracts were overbought two weeks ago, and they continued to advance, and we’re again at all-time new highs. So, we use our staggered levels here, 2607 the yearly opening price, our monthly opening price also very good, 2798. We connect that to our VP long, predicted NRT cross long, and we can very quickly identify some very significant support down near the 2782 there, or we can just round it out and say the 2800 level. That is our retracement point, and I do think we can get back down to that level on a retest if nothing else.
S&P 500 Index
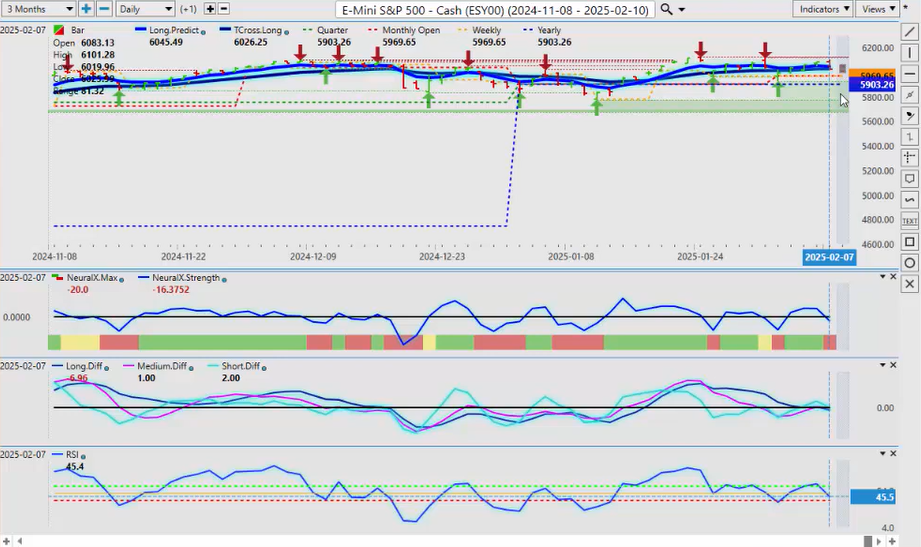
Now, when we look at the equity markets, once again, they still have a very strong structural bias here. When we look at factual levels, we don’t want to get into the rolling performance model here, guys, where we’re moving our targets around from 5 days to random 30 days. We want to keep them locked, so we can see very clearly where the S&P has been on the year, and the bulk of the trading has been to the upside. Right now, we’re holding above our monthly and our yearly opening price, but again, a little bit of caution here. Our neural index strength is pointing down. Now, that could be just from the payroll number and people being spooked that the Fed is not going to cut, but in my respectful opinion, only the data will inevitably catch up to the Fed, and he will be cutting. But again, we’ll play it month by month and see what the data is showing. But again, it’s a bit of a mixed labor report there; it’s not super strong, it’s not super weak either, it’s just kind of right in the middle. So, for now, the equity if the dollar is to rise, that could put some downward pressure on the equities to start the week, and that is what the VP indicators are showing, but there isn’t a lot of downward momentum. That’s the key point that I want to make. We would need that RSI breaking down below 40, our predicted differences extending lower, but that’s a tall order here. Again, another starting at least starting off the year pretty strong on the S&P, but again, watch those medium-term indicators to see what direction is the Fed going to be taking here.
Light Sweet Crude Oil
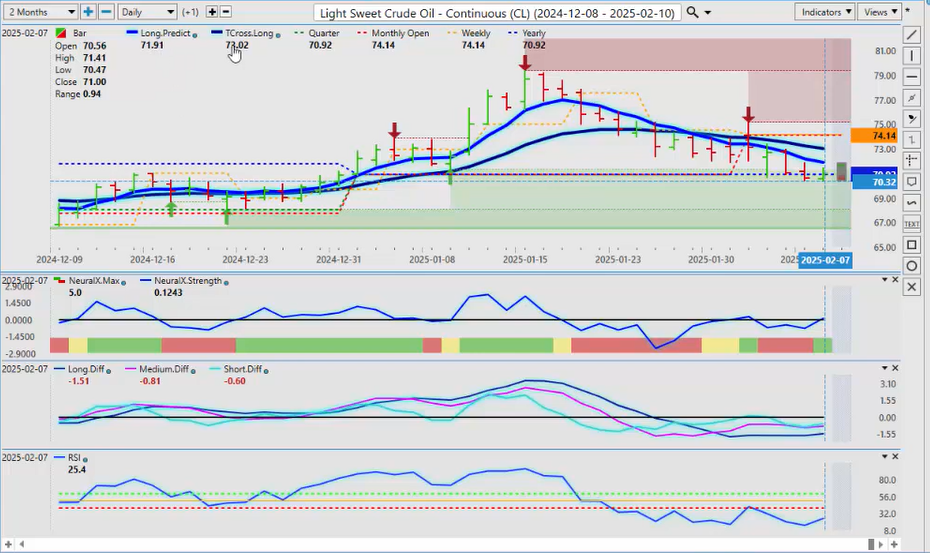
Now, when we look at lighted crude oil, again, it gets very interesting here because once again, we’re sitting on the calendar now. You’ll get a different yearly opening price depending on which broker you’re on, the data, but for the sake of argument, and I know there can be a slight variance, we are going to use the yearly opening price of 79.2, so we can see that we’ve been stalling out down here for the better part of last week, now has been very underlying bearish tone, but in the VP indicators, they’re actually starting to turn bullish on oil. We’ve had our MA diff cross, had our retracement backup, but we couldn’t break through the long predicted or the T cross long. Now, for people looking at this, because again, this is an Outlook, guys, not a recap of something that’s already taken place, we want to get out in front of these things, and we need to know where our target prices are. So, what I’ve done is created my own predicted moving averages using the VP software, so I use the long-term crossover, which is the lighter colored Blue Line. The black line is removed. I come down to my triple EMA cross and uncheck these two, and I use just the long, the T cross long, so I’ve got basically a very interesting setup where you can see how the market is reacting to that. So, in order for oil to really start to move, we need to first break through that long predicted at 71.91, so we can target again back to the 73 level. I can see that happening probably by midweek. We’ll see; nothing is certain, but the main thing is we have proper anchor points in our trading 70.92. If we, the main thing we want to look at, guys, is getting back up and holding above that price. We’ve managed to just close the week at 71, so we could see some action in the energy sector next week, and if we do, then we’ll know why because we predicted it on a Saturday. Again, not recapping things that have already taken place, we’re looking forward and saying, okay, where is there some potential opportunity. So again, we’re still barely positive on the year, but again, the MA different cross has taken place. We’re looking for that pink line to cross the zero line, and the predicted RI to start rising in order to confirm that we actually do have a trade here.
Bitcoin
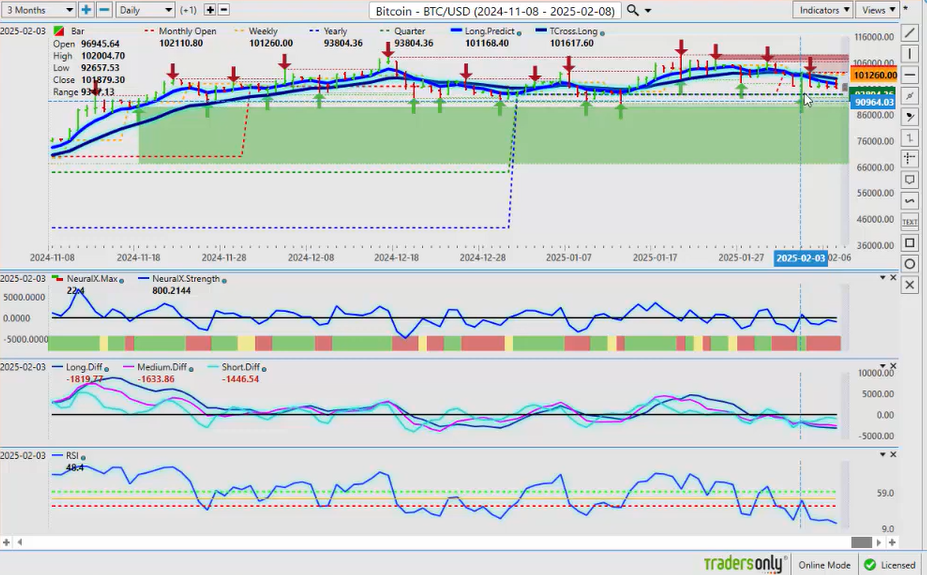
Now, when we look at Bitcoin, a very wild ride this past Monday, but we’ve recovered. We’re back up here. We do need to get moving on this, is what I will say. The yearly opening price, 93,804, we’re looking to hold above that particular level. We still closed again 96,000. I believe potentially this month we can push towards the 130 area. We just have to get back up above 100,000, stay above that, and then we’re literally in a very short period of time, we could hit the 132, 140 area. So, keep an eye on that, but for now, the indicators are saying we’ve got a little bit more downside here before that takes place. So again, what I will caution everybody is there was a lot more going on in that Monday bar from last week than what the average person would see, and there were some very strong projected levels down there. There’s also a couple of verified support zones at the low around 92,000, and as it came down there, it immediately RI back up. But again, we could come back down on more tariff noise, so we’ll see how this all plays out, but for now, a little bit more downside, and then I think we should be getting ready to start moving back up mid-Monon off that very important yearly and quarterly opening price at 93,587.
DAX
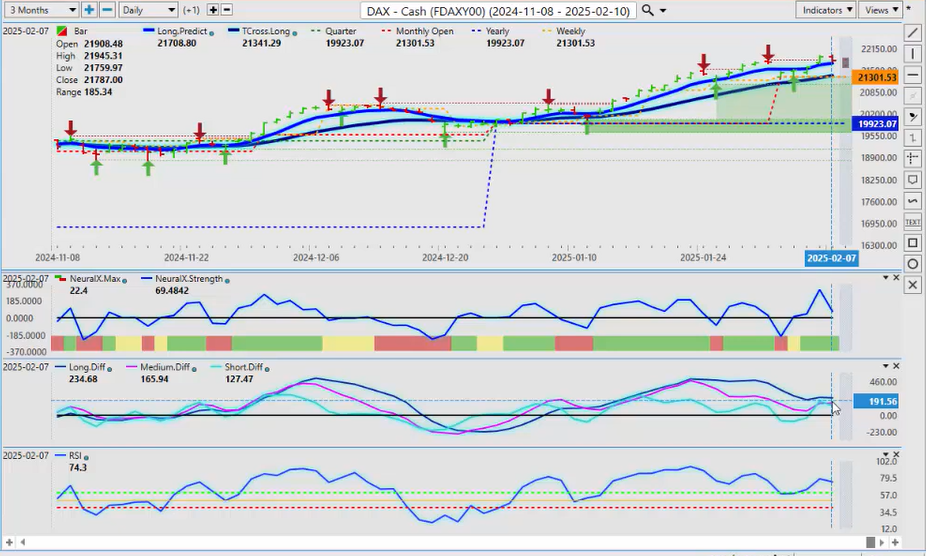
I do like to bring in the European Equity markets because they are important, guys; they’re globally connected. The Dax continues to advance higher, despite a softening S&P 500, but both are doing good. But if we look at the performance basis here, and we use that calendar yearly opening price, not a random model here, we don’t want to move that anchor point, right? We can see that the Dax is up 9%, just over 9% on the year. So yes, we could see some shorts there, but we did get that retracement back to our T cross long earlier in the week, and despite that carnage on Monday, the Dax held up quite well. Again, coming off that T cross long, that area at midweek, 21,1161. So for this week, our T cross long is 2,708. We remain long while above that area, but we are getting a little bit lofty up here. Our neural index strength is picking up on something, but the predicted differences are still saying we have more upside. So again, there always seems to be some kind of announcement on Monday, guys, so be very cautious, and I would actually recommend that you stay out of the market until about 10:00 AM Eastern on Monday. Let all markets come in, let Europe go home, and then we see what we’re dealing with for the week because very often, it’s setting the tone as to which way the rest of the week is going to go. Now, we would also want to make sure we’re looking at the VIX here, and the VIX remains again below its current yearly opening price but 1771. You can see we’ve closed at 1735. We’re right on this area, so we want to be cautious. The VIX is showing, and again, this may help your Dax shorts and maybe even the S&P shorts, but Vantage Point is forecasting that VIX to potentially rise in the first part of next week. That would be consistent with a stronger dollar. I think I’ve shown on here before the very high correlation between the dollar index and the VIX and the inverse correlation between the dollar and the global indices. So for now, I would be very cautious because the VIX is again not showing a lot of downward momentum here. It’s unable to break through that 40 level, so just a word of caution there. And again, let’s see what we get, what kind of Monday carnage they are going to cause this coming week.
Euro versus U.S. Dollar
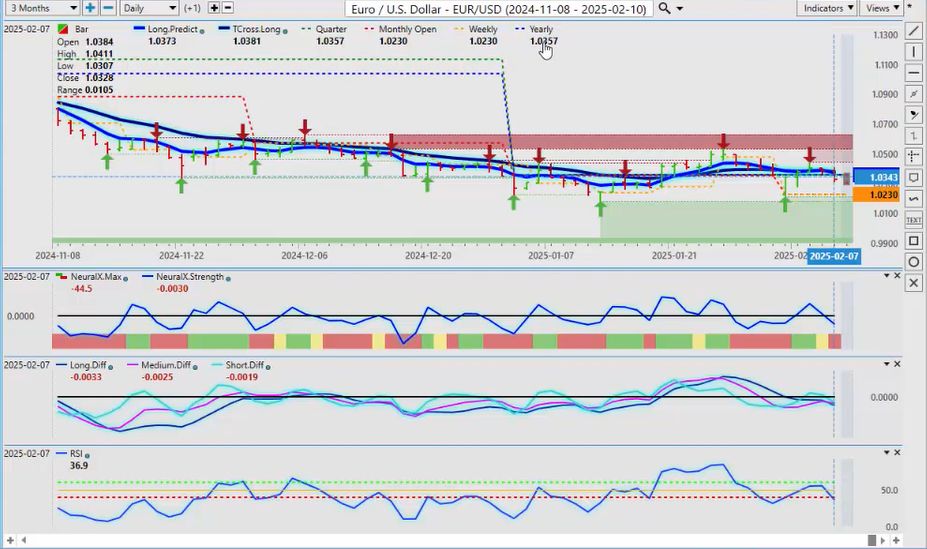
Now, as we look at our main Forex pairs, the Euro started the week off very good but then had an epic failure above 104 and caught the market a little bit off guard. So going into live trading next week, because again, guys, this is an outlook, not a recap of something that’s already taken place, we’re looking at real levels on a Saturday going into the next trading week. The calendar yearly opening price is a very important level for next week’s trading 103.57. They’re going to probably try and run both sides of this on Monday and maybe even Tuesday. If we’re holding above the yearly opening price, you have a long trade, but if we’re not, then the dollar strength could kick in again, and we could see further downside. I think the latter is more likely because I think the dollar was a little bit late strengthening. So, when I look at the combination of the VP indicators, they are all pointing down. Now, be careful, because again, in most months, the week after the non-farm payroll number, the dollar usually is weaker, but we are in the month of February, between mid-January and mid-March is a stronger period for the dollar. So, there’s a slight advantage to the dollar strength for part of next week. The question is, is it sustainable? So again, if we know our levels, we have an awful lot going on here. The T cross long 103.81, long predicted 103.73, and, of course, that very, very important yearly opening price at 103.37. So, either we go higher next week, guys, or we don’t, but the main thing is to know your levels.
U.S. Dollar versus Swiss Franc

The US Swiss Franc, should the Euro break down, you will see the US Swiss Franc rise. The VP indicators are already predicting that. Our neur index strength, the predicted differences, the predicted RSI, is recovering; we’re at 60.7. So, if the dollar is going to break higher, then it’s suggesting it’s going to be right out of the gate in these very powerful Vantage Point predictive indicators. Now again, I have no like vantage point; I have no control over some of these announcements that are taking place on Monday, every single Monday. There’s something, guys, so I don’t anticipate anything different. That but by Tuesday and Wednesday, the market’s forgotten about it, and it reverts back to the primary trend. So for now, it does look like the US Swiss Franc is getting ready to turn higher, but be careful because again, something fundamental could trigger a reversal, but for now, we are above the yearly opening price at 90.63. We are above the T cross long and the long predicted, so there is a slight bias for further upside, at least until midweek.
British Pound versus U.S. Dollar
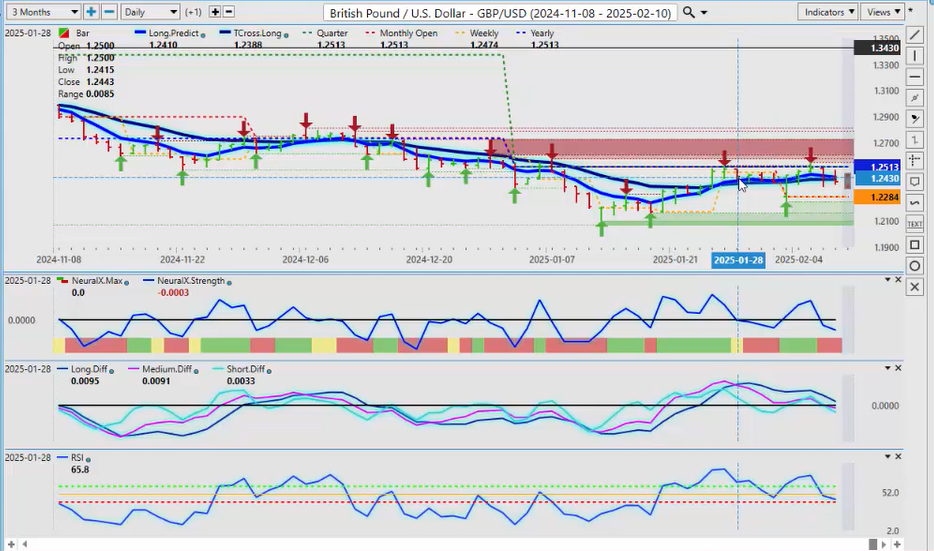
Now, the pound dollar, this past week, once again demonstrating the power of using the current calendar yearly opening price as a way to determine the primary trend. Now, you’ve probably heard a lot of chatter, like me, about how bullish the pound dollar was this year when, in actual fact, that is factually not true. It’s repeatedly failed at the calendar yearly opening price. Now, if you’re a buyer of this pair, it’s a pretty easy trick, guys. We simply put buy limit orders above the current yearly opening price at 125.13, but as you can see, we’ve had multiple, multiple failures here. So now, the Bank of England cutting rates, but there is three days in a row where we have failed on what most people will never see. Using the yearly opening price is a pivot level to gauge or to confirm a trend. In this particular scenario, we can see the MA diff cross crossing the trigger right on the yearly opening price, three days in a row makes for a very easy short here, guys. Okay, so right now, we need to stay below 125.13, and I would certainly respect anybody that disagrees and says no, the pound is bullish. Then if again, if you believe that, that’s fine, but just make sure you know how to confirm that. We need to break through this level, guys, and we have additional verified resistance up to 125.75. I would like to break right out of this area to confirm a long trade, or if I’m going to do a counter-trend, I would use the verified zones down here, but that’s a fairways down, guys, 121 from 124. That’s a pretty substantial move for a currency, but again, to start the week, our neural index, our neural index strength, our predicted differences, but once again, that predicted RSI using a 60/40 split is saying we don’t have a lot of momentum down here, so that’s where I would warn everybody, and even after the after a central bank is cut, very often, the currency has turned around and got stronger temporarily, so be careful of that, but the main thing is to know your level here.
U.S. Dollar versus Japanese Yen
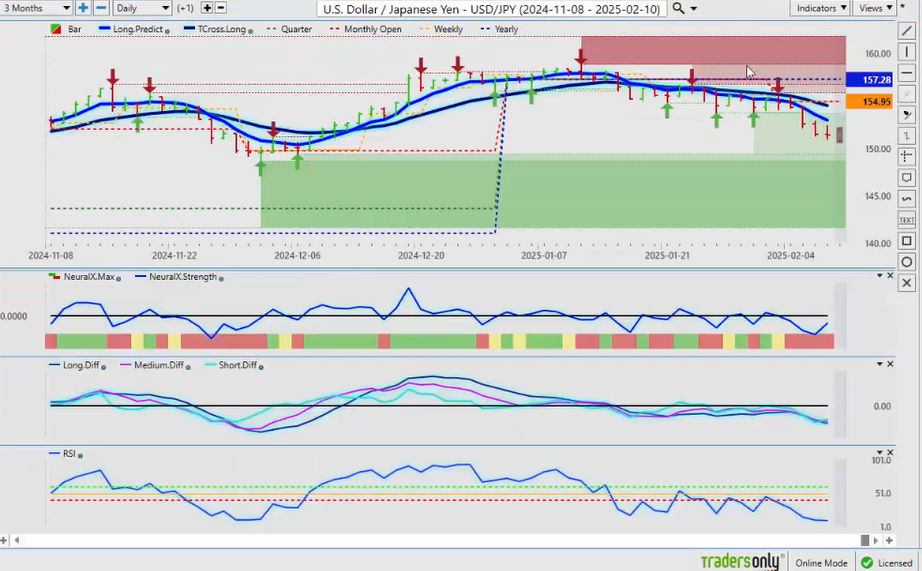
Now, the dollar yen has had somewhat of a recovery this past week, but not a lot. It’s holding below the calendar yearly opening price. You can see right at going back to January 1st, we were trying desperately to hold above here, but my view is the market believes the Bank of Japan is going to hike, and it’s going, and the Fed is going to cut. That changes the carry trade, the interest rate differential between the two banks. So again, we’ve got to allow for that, but right now, this currency pair is grossly overvalued still, or the yen is undervalued at 151 to the dollar. I still can’t believe we got up here, but we got up here because of COVID and the Fed hike, cutting then the Fed hiking back and forth, flip-flopping, but ultimately going crazy with those rate hikes, so it’s pushed it all the way up here, but there’s a long way for it to go down. So, be mindful of that, but the bias remains to the downside while below 157, but while below our T cross long at 54.54, but you can expect further volatility going forward with this pair with a very heavy downside biased.
U.S. Dollar versus Canadian Dollar
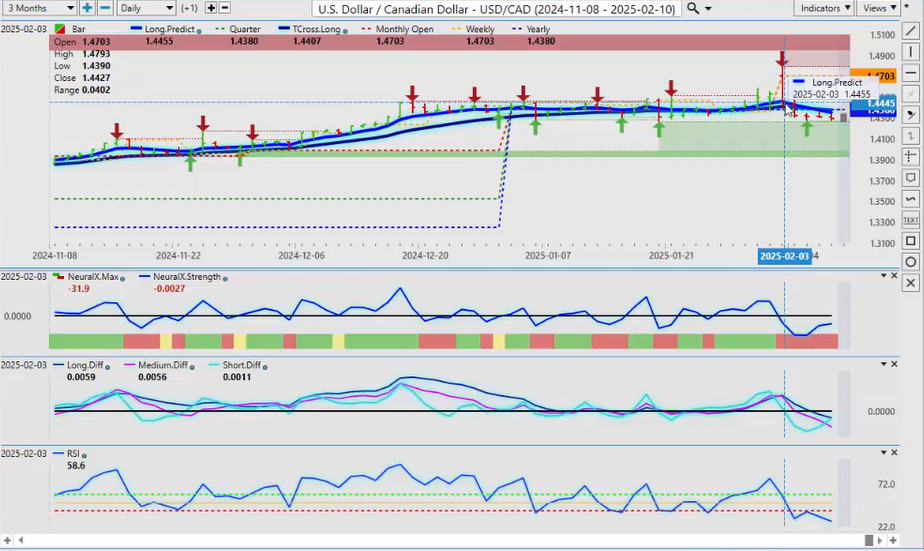
Now, the US Canadian pair, all over the map. Again, there’s our bar from Monday. We’ve got tariffs; we don’t have tariffs; we’ve got a delay for a month. I believe those tariffs are going to come back, and I believe it will continue to weaken the Canadian dollar until we get past this or New Deal permanent deal is signed, and I’m not convinced that that’s going to happen. So, I would recommend extreme caution with this particular pair and the Mexican peso. So for now, again, the indicators in VP are pointing down, but just remember that tariff threat is hanging over Canada like a guillotine. So if those tariffs come back on, we go right back up into the upper 140 area. I believe there is a very strong possibility of that, the closer we get to the 30-day cut-off point. So yes, it shows bearish here, but again, let’s identify our levels, guys. The yearly opening price is very important, 143.80, our T cross long is very important, 143.75. Yes, you can short that while we’re below these levels, but you should always have a contingency plan ready to go because one more word about these tariffs, and any downside is gone, and we’re right back up again. So, in my respectful opinion, I don’t like trading under a guillotine like that, so I will focus a little heavier on some of the other pairs like, for example, the Aussie.
Australian Dollar versus U.S. Dollar
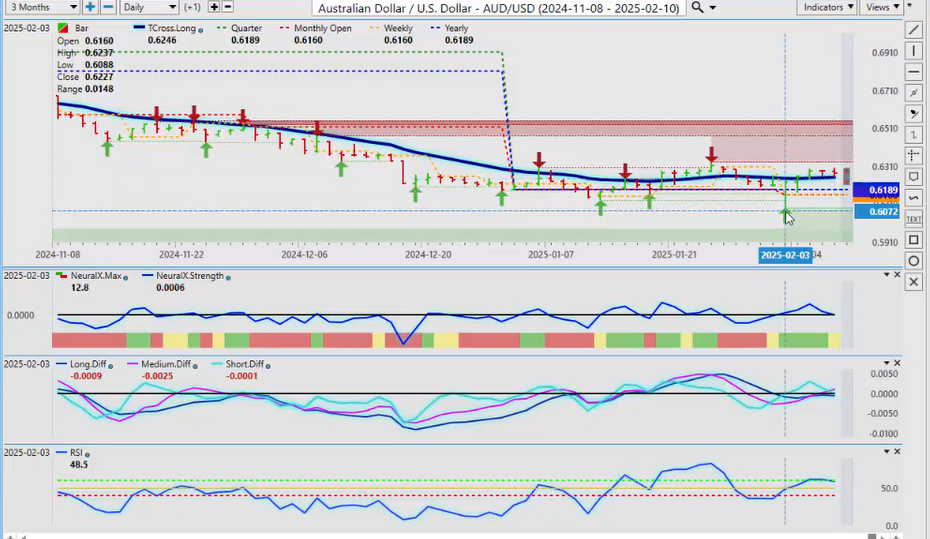
The AIE has had a pretty decent recovery this week. We’re holding the better part of the calendar year. This is how we gauge real performance, guys. You can see we’ve had a couple of little dips right here, and of course, last Monday, we had a big dip below the yearly opening price, but predominantly, the Aussie looks, uh, it is channeling in the first two months of the year, but it looks reasonable to be long while above the yearly opening price at 618, 6189. But we can make an objective view on what the primary trend on this, which is up, and we know exactly where our stops should be. I would argue now they should be if you’re going long, should be below 60.88. If you’re not comfortable with that, then see if we get more tariff talk and pushes it back down, but that those tariffs are even affecting the Aussie, and that’s what I wanted to show you here. But for now, going into next week, we are still channeling. We’ve got a high point, and I will concede there is significant resistance above the 63 mark, but we also have very heavy support, and that’s coming in around 61.32. So this channel will ultimately break, and I believe it will ultimately break to the upside.
New Zealand Dollar versus U.S. Dollar
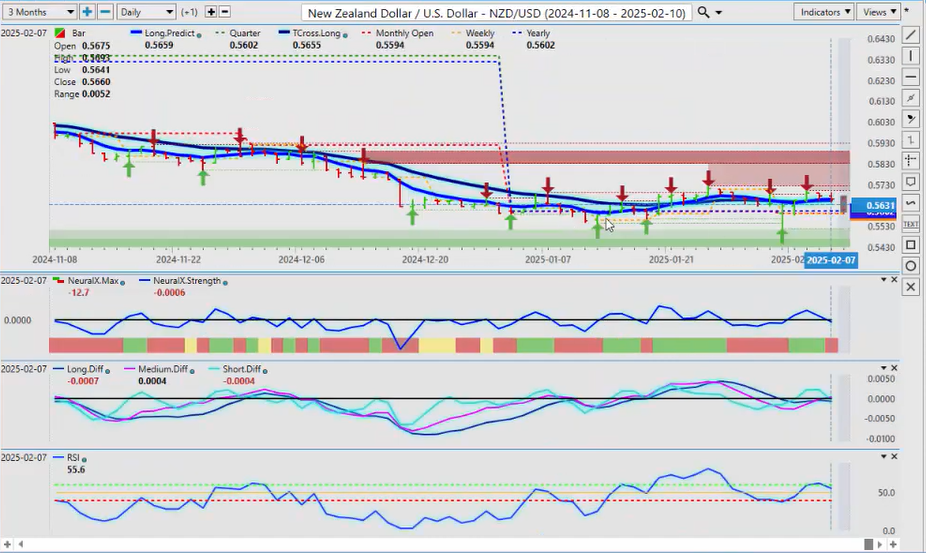
The Kiwi is going to be, you can see, mirrors the Aussie, the same type of channel formation, the big drop on the tariff, tariffs, no tariffs, additional verified support. But as you can see here, they’re equally, both of these currencies have been relatively strong for the better part of 2025. That’s not subjective what I said, it’s objective because we have a proper anchor point to measure that from the calendar yearly opening price. I don’t care what this did 60 days ago, 65 days ago, or 90 days ago, or even five days ago. I want to look at where am I trading in 2025, am I trading that short or am I trading it long, and if we have an objective way to do that, that is price-based, the only thing we really have to worry about here, guys, is the fundamentals of protectionism, the tariffs. It’s causing a lot of volatility, but with that, there still remains opportunity. So, with that said, this is the Vantage Point AI Market Outlook for the week of February the 10th, 2025.


