


Welcome to the Artificial Intelligence Outlook for Forex trading.
VIDEO TRANSCRIPT
US Dollar Index
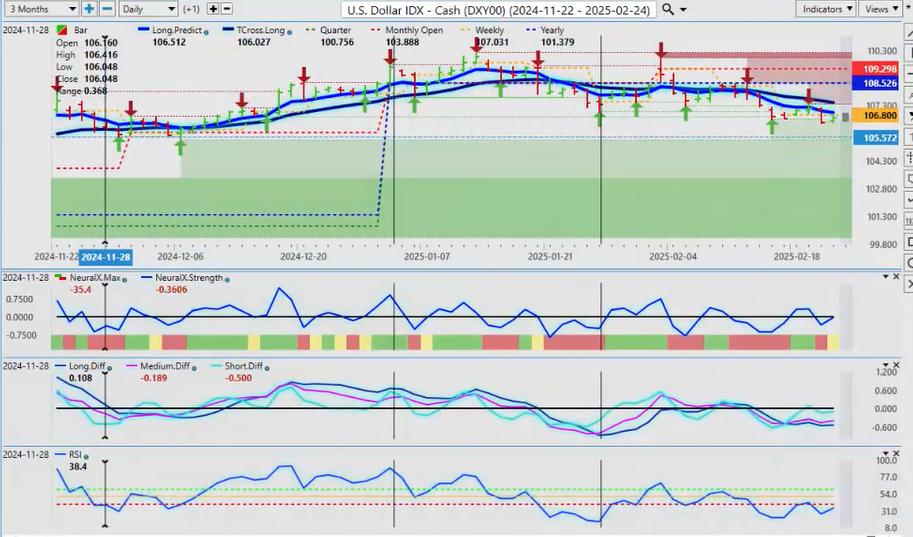
Okay, hello everyone, and welcome back. My name is Greg Firman, and this is the Vantage Point AI Market Outlook for the week of February the 24th, 2025. Now, to get started this week, we’ll begin where we always do, with the US dollar Index. Now, what I’ll do a little bit differently this week is show you guys patterns that usually occur every single month, around the same time, give or take a few days, but a period of dollar buying at the end of the month into the first week of the new month, till the week after the Tuesday after the non-farm payroll number. So, what I’ve done is highlight some of the current indicators through the chart over a 9-month period, so we can see over this 9-month period that there’s always something funny going on.
Now, this dollar buying can be four or five days, can be eight days, can be three days, but as you can see, going back over a 9-month period, it regularly occurs around the 26th, anywhere between the 26th and the beginning of the new month. So, this is highlighted over the 9-year period, and again, what we want to do is watch the VP indicators very, very closely this coming week because what usually happens is we will see a rather severe bout of dollar weakness for a day or two and then a pretty vicious reversal.
So, right now, looking at the VP indicators closely, we can see we have an MA diff cross to the upside, the short-term predicted difference is starting to rise, but the predicted RSI, you can see this over a 9-year period, it’s very interesting for the Forex traders watching this, that usually, it comes out of nowhere, all of a sudden, something will crash the dollar, and I believe they use that crash to pick up real long trades or pick up a discount price buying dollars. So again, you can see that this line runs right down through the VP indicators all the way down to the predicted RSI.
So, as it sits right now, that predicted RSI is already showing signs of life here, very much like what it did last month at the exact same time. So, with all of that, taking all of that into consideration, I would respectfully submit there’s a very high probability of a dollar sell-off this week, earlier in the week, but then significant dollar buying near the end of the week. So keep that in mind. The indicators are technically bullish, to some degree, on the dollar, so we’ll monitor this, but at the very least, we are likely to get a retracement back to the T cross long at 10746, but if we see more buying than that, we could retest the yearly opening price, which is entirely possible by the end of next week, up around 10852.
Gold
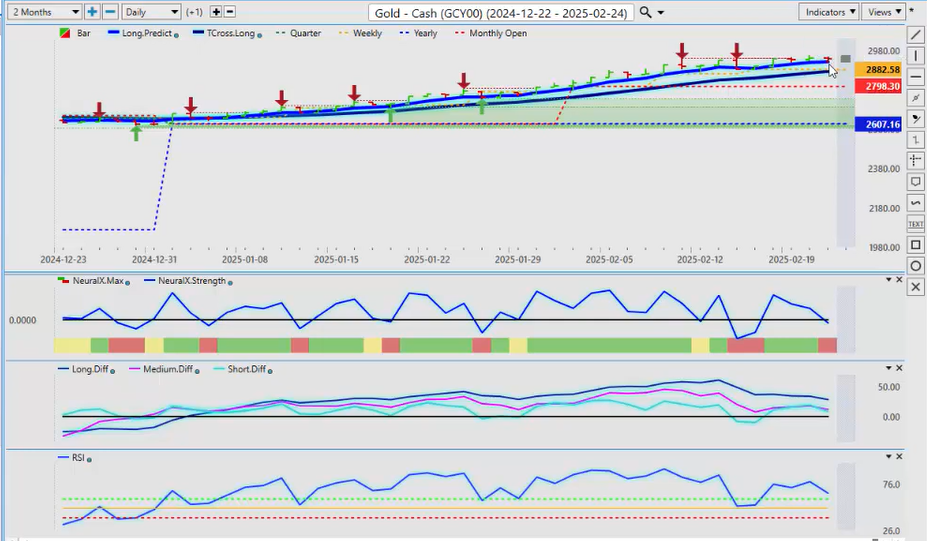
Now we want to do a comparative analysis of this to gold. Now, gold continues to run on the high side, but in most cases, what we’ll see is gold weakness at the end of the month into the first week of the new month, which is, to some degree, I believe the dollar is affecting that. Now, there’s a lot of rumors circulating about gold right now, that somebody’s taking big deliveries of these contracts, which is probably true. So we’ll see, but for now, again, the VP indicators, the neural index strength, which is the inside view of the neural index, has been pointing down for over a week, and now we’ve crossed the zero line, and the main neural index reading has gone from green to red, the predicted differences are slipping lower, and the predicted RSI is also pointing down.
So, this would tell me that even with the rumor circulating of somebody buying, taking delivery, excuse me, of big gold contracts, there’s still something funny here. So, I would anticipate that potentially we can move back to the Tross long at 2873, but if we lose that area, then we would look at the monthly opening price at 2798. So, if you have a big round of profit-taking on these contracts, you could see gold actually move lower by mid to late week of next week when that dollar potentially turns higher.
S&P 500 Index
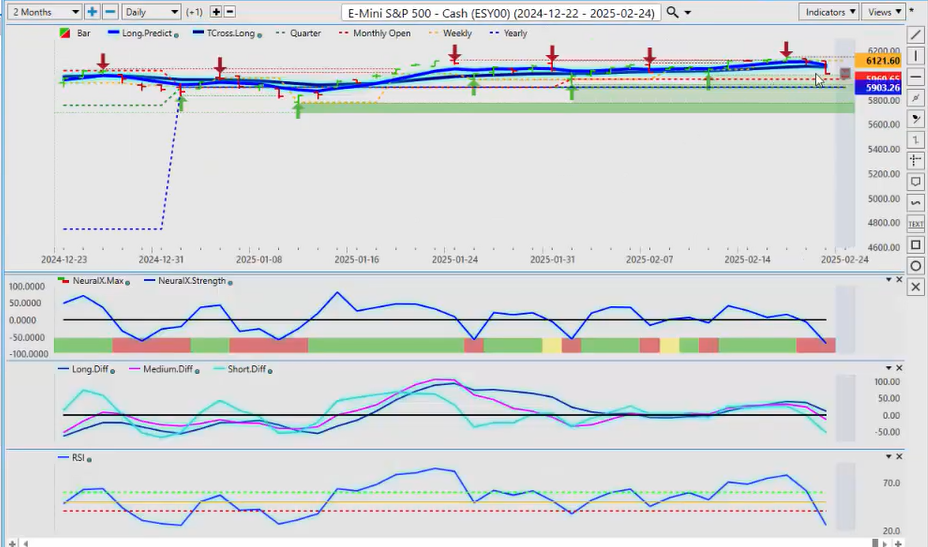
Now, for the S&P this coming week, we can see this is another warning sign of pending dollar strength when the S&P, the NASDAQ, some of these markets turn lower, and again, that would be more or less a short-term play, but we can see that our strength and the medium-term crossover, the short-term crossover, they’re both crossing over the zero line, telling us we do have a crossover, but the long-term is not. So again, the S&P 500 remains bullish while above the calendar yearly opening price at 5903. So, if we do get a bigger sell-off this week, in my respectful opinion only, we would use that as a buying opportunity. So, remember, don’t let conventional tools trick you into thinking something is in a downtrend when, in actual fact, the S&P is not in a downtrend; it’s been in a pretty solid uptrend for years and years, even through COVID. So again, I would be a happy seller of this main index, but I’ve got to be below 5903 to even consider that, respecting these substantial moves higher when we look at it from even one year ago. You can see that, actually, you’re coming into a stronger period. So again, if we monitor the short-term play of buying dollars, once that’s exhausted, then I believe the S&P can continue to climb.
Now, this is at very lofty levels, but we’ve seen this do nothing but move higher for probably, I would argue, respectfully, over the last, at least since the financial crisis of 2008, the equities have really just gone higher. There have been substantial pullbacks, but they’ve always extended higher. So, right now, our T cross long, that’s coming in at or about the 6066 area, that’s our resistance for this week. We are likely to move lower, but that’s a short-term play, a week, week and a half.
Light Sweet Crude Oil
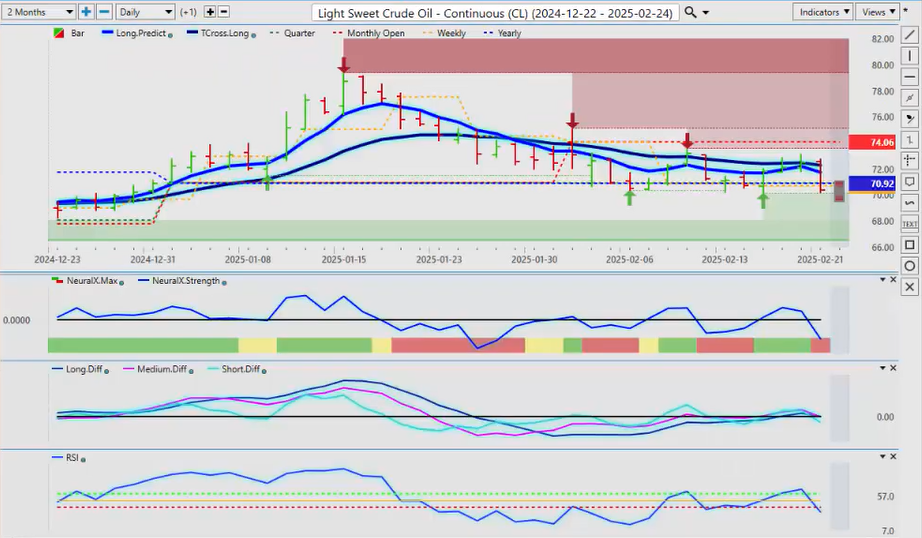
When we look at light sweet crude going into this week, I think we’re seeing a pretty decent round of profit-taking on the Nat gas contracts. I would anticipate we can recover on oil prices; the dollar moves higher, I believe that oil will follow it. So again, we’ve really been fighting it out, and this is why it’s very important to avoid that rolling performance model. I say this every week, I know I sound like a broken record, but I’m warning you not to move to random 30 days or ‘this is what it did for the last 30 days or 5 days.’ We need anchor points, and we need to know our levels here, guys. The start of the new month, the start of the new quarter, even the new week, is very important, but the yearly open, the current calendar yearly opening price, is a very powerful indicator that probably 80% of the market doesn’t even look at. They get caught up in that rolling performance model, and it’s just a distraction. So, again, the yearly opening price, 7092, if we can stay below this level, then sure, there’s a short there, but we have not been able to do that. So the T cross long, I will definitely concede that point that it’s containing. So, right now, for next week, what you’re dealing with is a range between 7092 and the T cross long at 7225. A sustained break and close above either one of these two levels will tell us what the real trend is, and I believe ultimately oil goes higher as we get closer to April and May and June. So for now, we could see a bit of downside here, but it’s not a very strong signal at the current time.
DAX
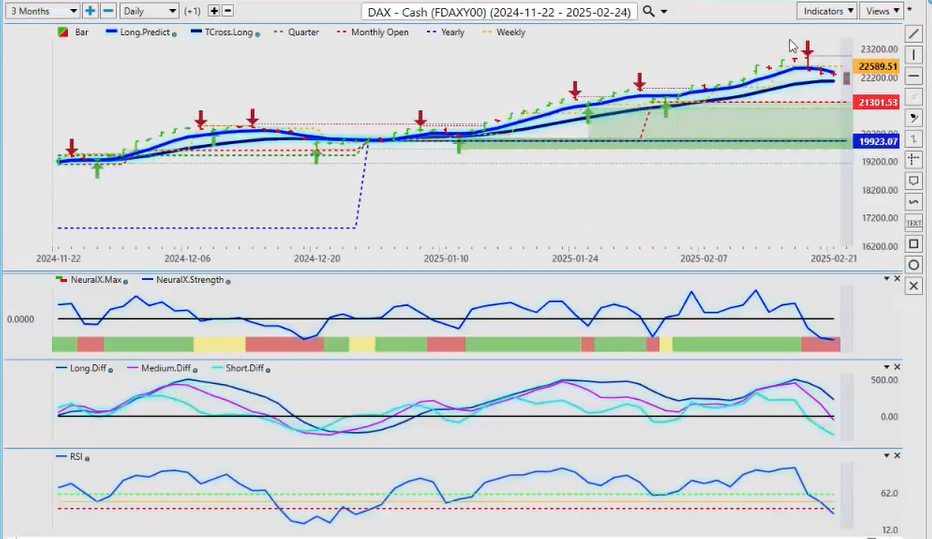
Now, when we look at the European markets, and we do cross-reference to that, the Dax is starting to feel a bit of pressure here. Now, it is in better shape than the S&P 500; we’re above our T cross long at 22054, that’s our key level there, but the structural bias of this Dax has me buying on dips, not selling into rallies. That’s just the way I would do it, but if, as we come into that potentially coming into that period of dollar strength, then that would put a little bit of pressure. Now, this is going to be a volatile start with the Europe, with the German, I think, believe it’s elections in Germany and Europe this weekend. So, it’ll be interesting to see how this one all plays out, but it will be choppy. The Euro will also be affected by this, but the structural bias of this index, night above the yearly opening price, above the monthly opening price, didn’t have much of a week there, we lost the weekly opening price, but we’re holding above 22054.
Volatility Index ($VIX)
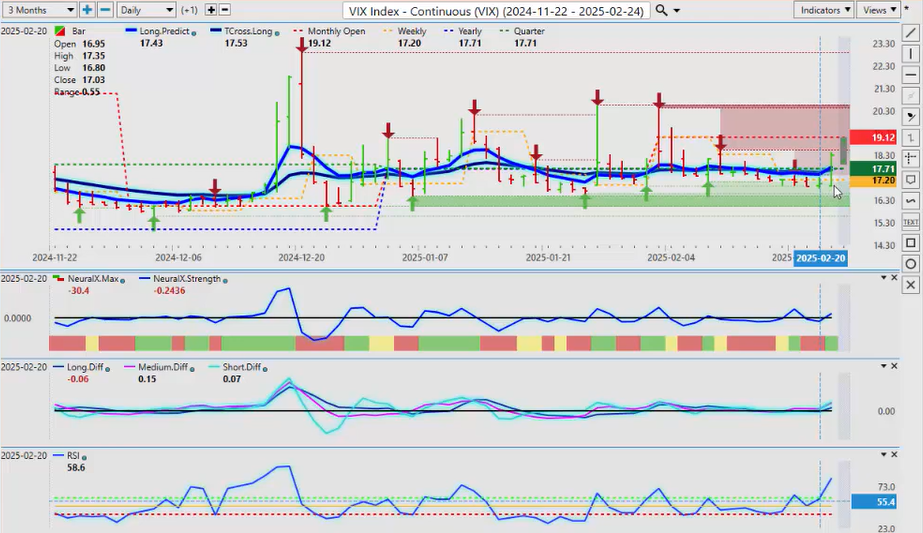
That’s the key level to watch going into next week, but we also want to do a comparative against those two indices with the Vix, and you can see, this is what I had been warning about over the last week or two, that this Vix is a little too close to the current yearly opening price for me. I think it’s likely going to move higher. So we look at the predicted RSI, 60/40 split, we’re looking for a break below 40 or a break above 60. So right now, this is showing that the Vix is likely to move up. The only thing I can advise is that I never trade off of a bar that looks like that because, especially when it’s on a Monday or a Friday, so it may be a one-off, but the VP indicators have now been cleared are TR cross long, 1764 on the Vix, but the yearly opening price again comes into play here, 1771. So we know exactly where that key support is, and we then add in the monthly opening price at 1912 as a potential target if it’s going to fail, guys. That’s where it’s going to be, 1912. So we know our levels, we’ve got our price targets, this is what we always want to have that with good risk-to-reward ratios when it’s reasonable to have that. So our predicted differences are sitting above the zero line, they look like they’re getting ready to move higher. Usually, when I see this in the VP software, there’s a substantial move, usually follows. So again, we’ve seen some pretty big moves recently on the Vix, that’s an understatement, and even Fridays was a pretty big one, but I think if we really bring this into perspective, you can see how this was building just by putting a line right across here and saying, okay, 1, 2, 3, 4, five, and then boom, up it goes. So now, our former resistance of the T cross long is now turned support, and that’s all right around that yearly opening price, and our T cross long at 1764.
Bitcoin
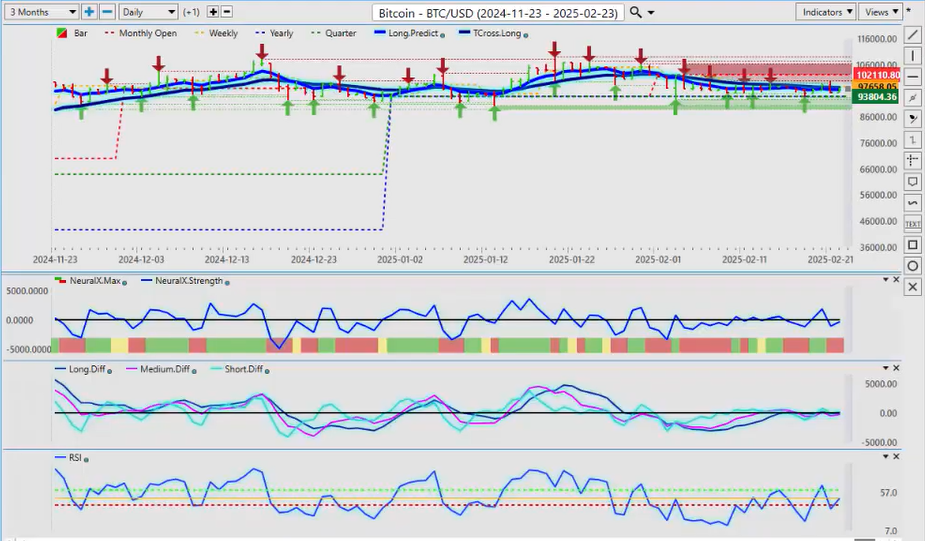
Now, for the coming week with Bitcoin, I would anticipate a little bit more downside on Bitcoin while we’re coming into that period of known dollar strength, but again, we’ve had a significant retest of the yearly opening price here, this yearly opening price coming in at 93804. So again, we’re closing out the trading for the week a little bit soft here, but the indicators in VP actually remain technically bullish. So again, even if the dollar moves higher, I have seen Bitcoin moving higher with it. So keep that in mind. Bitcoin, either way, in my respectful opinion, until later this year, in October, November of this year, will remain a very solid buy on dips with an ultimate break towards 130k, 140k, at some point during this calendar year, and it could be as early as next month.
Euro versus U.S. Dollar
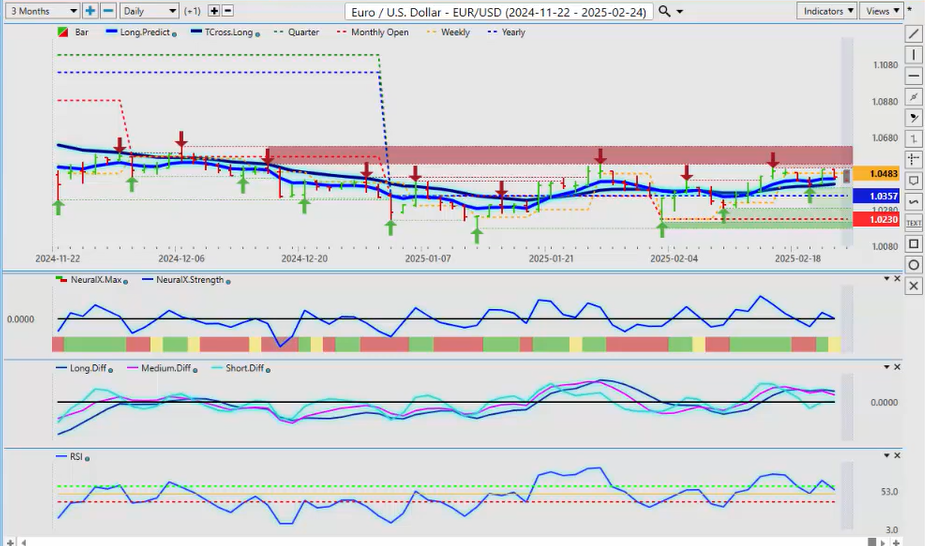
So looking now, switching over to some of our main Forex pairs, starting with the Euro again, the euro is going to be a very, I expect a very, very choppy opening. Now, once again, this is an outlook, not a recap of something that’s already happened here, guys. So, this presentation is being done on Sunday afternoon while the market’s closed. I anticipate a very volatile open in the Forex market and in a lot of your futures too, with that German election. So, right now, the euro, it’s holding its own here, but again, if the dollar follows its normal patterns, then by the end of next week, the Euro would be moving lower. So, I would respectfully submit to let it move higher and look for a short opportunity that would probably be back just above the 105 area, 10530, 10550. We’ve got a newly formed verified zone high that’s coming in at 10514, but it’s this one over here that you want to keep an eye on, and I would argue, even this one, sitting at about, but there’s a significant amount of resistance here at 10534. So very often, at this time of the month, what they do is they create a bull trap; they push it above that level, make it look like it’s extremely bullish, and then the dollar cycle kicks in, and it pulls the rug right up from about 80% of the Forex traders. So be very, very cautious of that bull trap because, as of at the time of this presentation, the VP indicators are actually bearish, and I believe that to be correct. So maybe we get maybe we get , 10580, maybe even 106, but ultimately, watch for a potential reversal.
British Pound
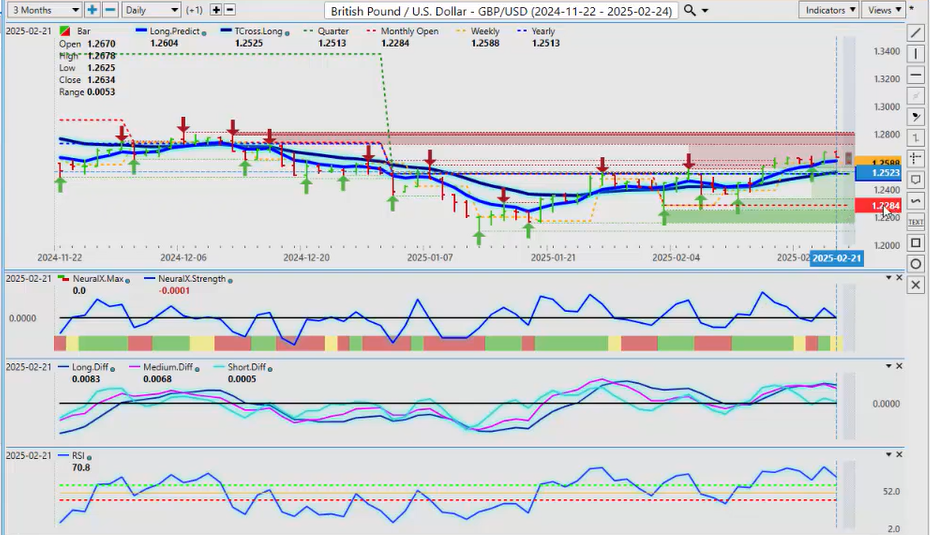
Same thing is going to apply to the British pound here. Once again, from a structural bias standpoint only, it does look better. We’ve got the monthly opening at 12284, then we’ve got the yearly opening price again, very, very important that you know your levels here, guys. 12513 is the line in the sand. We must stay above that to continue buying this, but now you can see the Vantage Point T cross long has come right into that area, and that T cross long is coming in at 12525. I anticipate by the end of the week, there’s a very high probability we will be back down at that level or below it. So again, keep a very close eye on that dollar index near the end of the week, near the 27th, 28th. I would respectfully submit it’s Thursday; I bet you that this is when the dollar blows up to the upside. So keep an eye on that, but another warning sign of pending dollar strength with that MA diff cross.
U.S. Dollar versus Japanese Yen
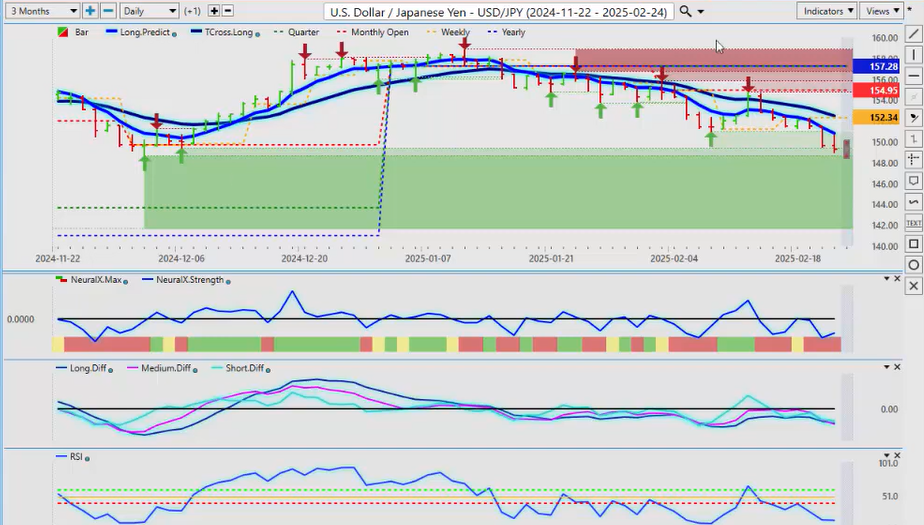
Now, when we look at the dollar Yen, again, this pair is definitely holding below its calendar yearly opening price, and I believe this to be a true price here. Now, we broke down below the yearly opening price within the first two weeks of trading in 2025. Very important that we can see the retracements back to this, this has absolutely nothing to do with conventional theories, Fibonacci, etc., it’s the calendar yearly opening price. Yes, I know what happened in 2022, 2023, and 2024, but that was the interest rate differential between the two central banks. So right now, we’ve had a substantial, the yen is moving back to where its value should be, and we’re still grossly undervalued on the yen, in my respectful opinion only. So right now, keep an eye on our TR cross long at 15250. I think we will retrace back to that on dollar strength near the end of the week, but again, the indicators are essentially moving sideways on here. Just keep an eye if we can get that predicted RSI and the neural index strength, but as you can see, this is what I call a reverse checkmark here, and that’s telling me that yes, the neural index is down, but the strength of the neural index is actually bottoming out. The last time I saw one that deep was over here, I believe that was back in December; actually, it was November of ’24, that I’ve seen the neural index that low, and the advantage of the neural index strength is it actually shows two different things here, guys. One, that it shows that it’s down, which is painfully accurate, but that is now pointing up, and you can see this is a custom predicted moving average that I have on my screen. I did get a question about this the other week, so let me show it to you guys, so you can replicate it. So, there’s the triple EMA cross, and I simply unchecked the medium and the short, there’s the long-term crossover, and I simply removed the black line and applied it to the chart. So, this is a custom one that I prefer to use because you can see how easy trading can actually be at times by using these predicted moving averages. Each day it retraces back to this blue line, my secondary T cross long is behind that, where I want to keep my stops on the other side of that, so I can sell into this on a daily basis, take 30, 40, 50 pips, then wash, rinse, and repeat and do it again the next day, knowing that I’ve got my backup resistance here of my TCross long, my monthly opening price, and my yearly opening price. This is all structural. This allows me to create a structural bias inside anything that I’m looking at and say, okay, there’s nothing bullish about this; it’s quite bearish. So the first crack in the dam would be to break through the long predicted, the second one, I would have to break through the T cross long, but I think all we’re going to do this week probably is retrace back to it on the temporary dollar strength.
U.S. Dollar versus Canadian Dollar
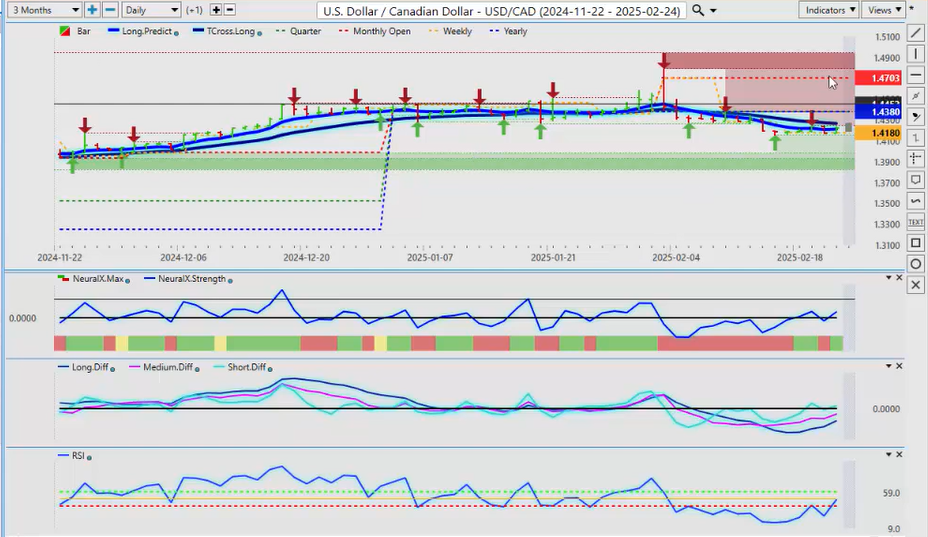
Now, when we look at the US Canadian pair, once again, not a lot of reasons to buy the Canadian dollar here in the current environment with the tariffs, a lot of different things going on here. There is going to be an election, a federal election in Canada here, probably in April, so the winds of change are coming. I believe that this US Canadian pair could be a very, very good short, more towards May and June. So for now, definitely, support building down here, absolutely. We’re coming into a period of known US dollar strength. Longs are heavily favored. So here’s a trick that I can give you guys also: this pair is notorious for a Monday-Tuesday reversal. So, whatever direction this thing goes on Monday, let’s say it goes screaming lower on Monday, then you buy at the end of the day on Monday, and then it reverses and goes higher, but if it goes screaming higher on Monday, then it’s going to come down lower on Tuesday. This occurs almost every week, guys. It’s a phenomenon that I can’t really explain other than to say it’s a thing, and it’s happening. So just always think of that: if you have a big bar on Monday, and if it’s down, then you buy on Tuesday, and vice versa the other way around. So just a little bit of information there, but the structural bias of this, 14380, I absolutely anticipate we will retest this by the weekend, by the end of the week, by Friday, probably Thursday. So keep an eye on that. The monthly opening price, 14703, I can’t even rule out that we could test that by the end of the week if there’s more discussion, which there’s going to be, on whether Canada, the US is putting tariffs on Canada. So if that happens, that is a huge negative for the Canadian dollar.
Australian Dollar versus U.S. Dolllar
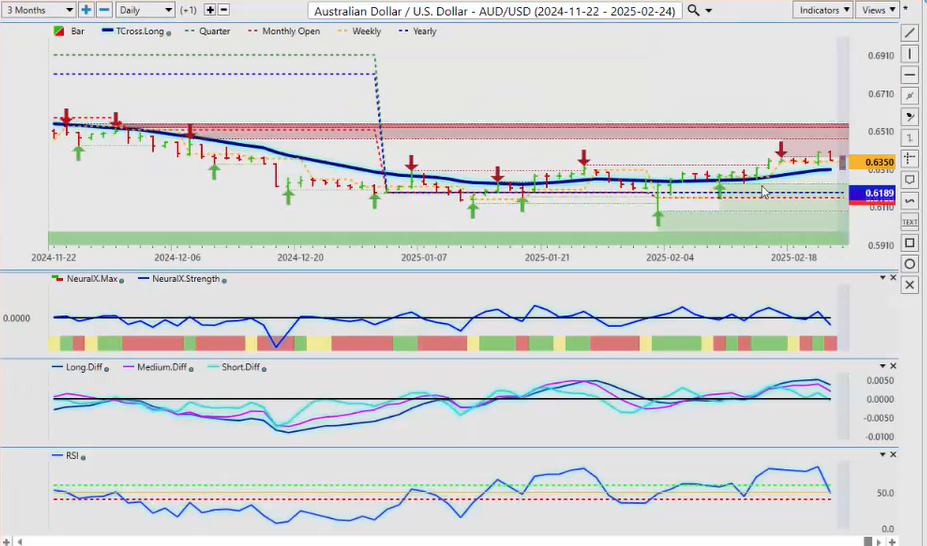
Now, we can still just do some of the equity-based currencies, Australia and New Zealand. So the Aussie here, still structurally looking pretty good, 6189, but usually, it starts to run out of steam here into the end of the month, so I think that shorts are reasonable. The VP indicators are supporting that; they’re all pointing down. But again, we’ve got to let this trade develop here. I think they’re going to throw us a wrench into this right out of the gate tonight, so be careful with this pair.
New Zealand Dollar versus U.S. Dollar
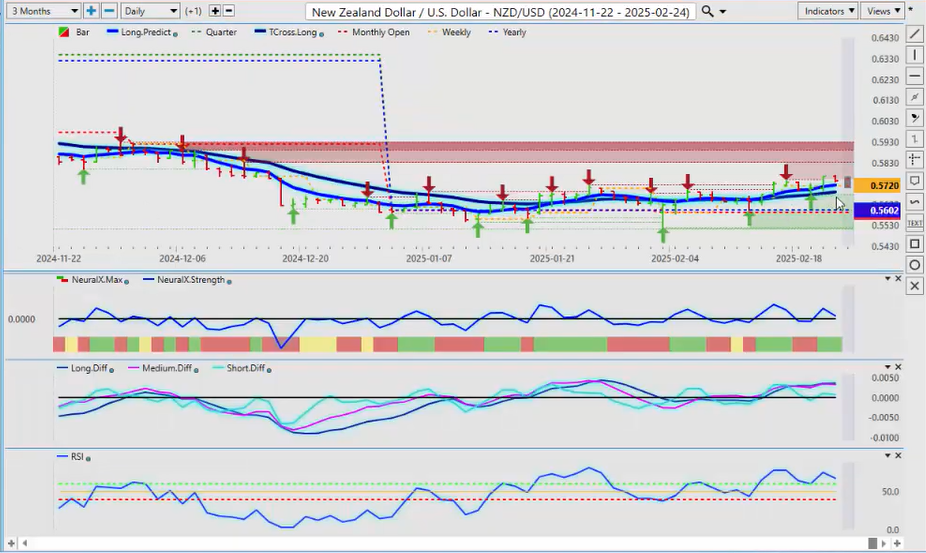
If the equities continue to move lower, it is going to pull the Aussie down, and it will further pull the Kiwi down also. Now, again, a pretty decent structural bias here. I think that if we’re going to buy this, we would wait for it to come a little bit lower here, potentially near the 5650 area, somewhere down there, but this too is not showing a lot of strength. Excuse me, a lot of strength, so be very careful because we’re definitely going to see a couple of major swings, likely to see those swings this coming week.
So, with that said, this is the Vantage Point AI Market Outlook for the week of February 24th, 2025.


