


Welcome to the Artificial Intelligence Outlook for Forex trading.
VIDEO TRANSCRIPT
US Dollar Index
To get started this week, we’ll begin where we always do, with that very important US Dollar Index. Once again, it’s very important that we’re using proper anchor points and avoiding any kind of rolling performance model, so we’re not confusing price in relationship to the current calendar year to measure accurate performance. Right now, the dollar is pressuring the yearly opening price again, trying to turn bullish. We’ve closed above the T cross long on Friday. The Buy Signal that formed on the Dollar Index on the 27th, at the end of the month, respects the cycle.
The US Dollar is usually strong at the end of the month into the first week of the new month until the Tuesday after the non-farm payroll number. I don’t see that anything has changed here starting in 2025, so 108.52 is the current yearly opening price. The VP indicators are bullish; we’re gaining momentum on the dollar but expect a very, very choppy start to the week. Monday trading has been very volatile; this Monday will probably be even worse now that the tariffs are in place. So be careful on Monday, and in fact, with my own direct client base, I usually warn them to just stay out of the market until at least noon on Monday. Get a sense of feel of which way this thing is going, and then start to hit the ground running Monday evening. So again, still a bullish tone to the dollar. Our MA diff cross needs to complete here; we have a short-term crossover, a medium-term crossover appears imminent, and again, we’re at 60.2 on the predicted RSI. That is warning that momentum on the dollar is actually building.
Gold
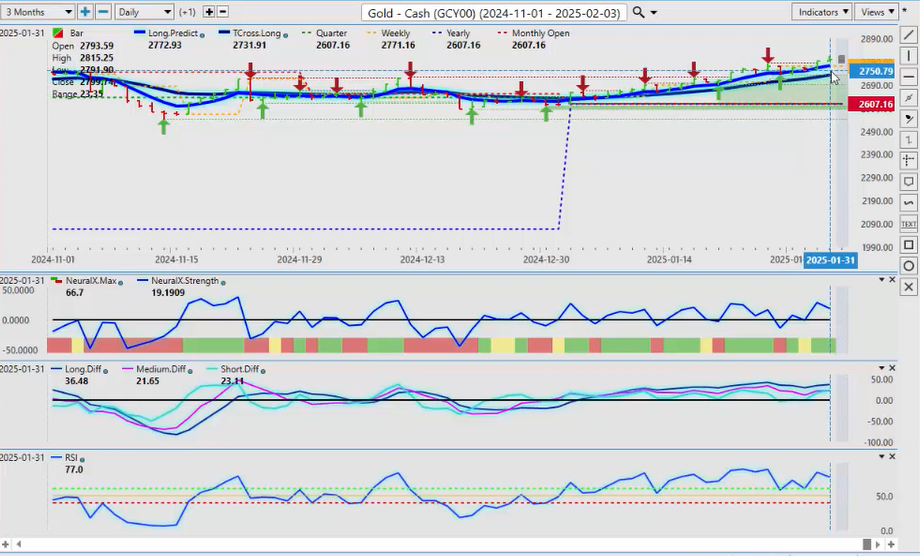
The question now is, what will that do with Gold? Again, in most cases, gold starts to lose momentum into that first week prior to the payroll number. So when we look at gold right now, it’s still very bullish on the year. The calendar yearly opening price is 2607; we’re long while above that area. There isn’t a lot of momentum up here; I believe it will correct lower to our TR cross long or our long predicted, that’s going to be between 2772 and 2731 for next week. Again, this is an outlook, guys, not a recap of something that’s already happened that we’re reviewing. So again, these are important levels to know your retracement points, and again, even if we break our T cross long, we’re still dealing with a very significant level on that calendar yearly opening price of 2607.
S&P 500 Index and DAX
Now, when we look at the equity markets, I’ll look at both the North American markets and the European DAX. I did warn last week that, in my view, the DAX and the S&P were still bullish because they’re above their calendar yearly opening prices.
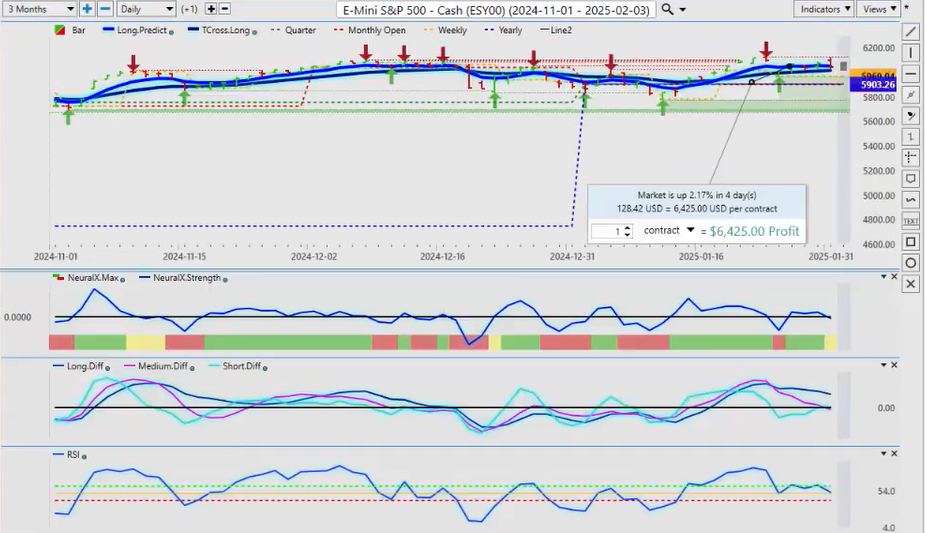
If you are looking at shorts, then maybe this coming week is a better week to short that, based around pending dollar strength. But right now, our TR cross long is at 6015, 6051, the yearly opening price 5903. We came very close to hitting that this past week, hitting 5962, and you can see the buyers immediately stepped in and drove it higher. The question is, can we get above the verified resistance high at 6128? That’s the area to keep your eye on next week.
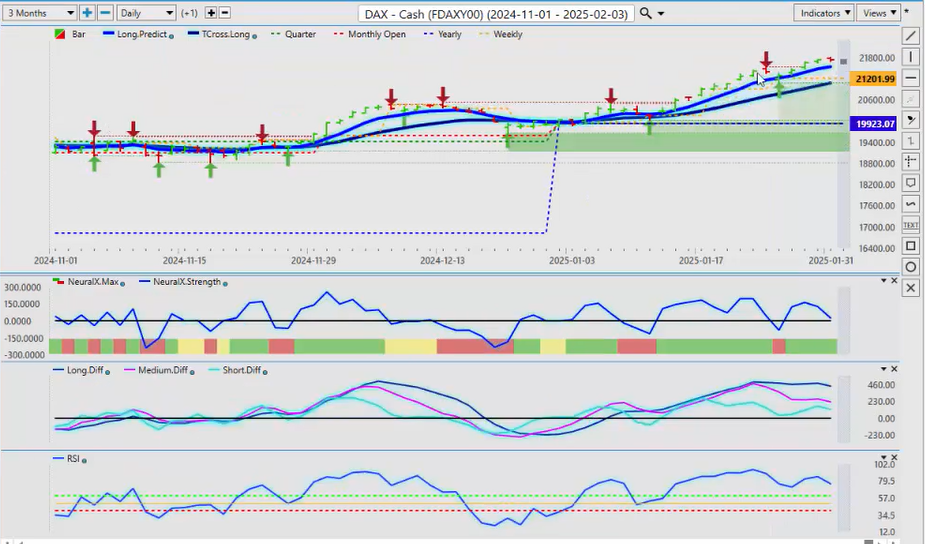
The indicators in VP are mixed here, but they are slightly bearish. Now, if I do a comparative analysis to the DAX, one of the ways you can gauge momentum here is if we come back 5 days at the end of Monday closing, you can put a high point and a low point on that Monday bar to say, okay, here’s my Monday High, here’s my Monday low, now we’re going to get into a type of trend, at least for the week, will begin to form. Then you can measure this and say, okay, no, I’m above my long predicted, I’m above my T cross long, and this is where I had mentioned that it’s still somewhat bullish here. So be careful, but now this week, the picture begins to change a bit. Our predicted differences are dropping, so I think that this week, you may have some shorts here, but we need that dollar strength. And with the ECB cutting, that also gave the European equities a bit of a boost. Now that’s probably going to be exhausted this week; the indicators are pointing down. But again, just remember, guys, it would be a retracement lower; it wouldn’t be a new trend unless we get below 19,943, and at the very minimum, we’ve got to get below the T cross long at 21071. But that is your retracement point for next week, along with 2,531. But I suspect near the end of the week, the buyers will, even if it does go lower, the buyers are likely to step back in.
Volatlity Index ($VIX)
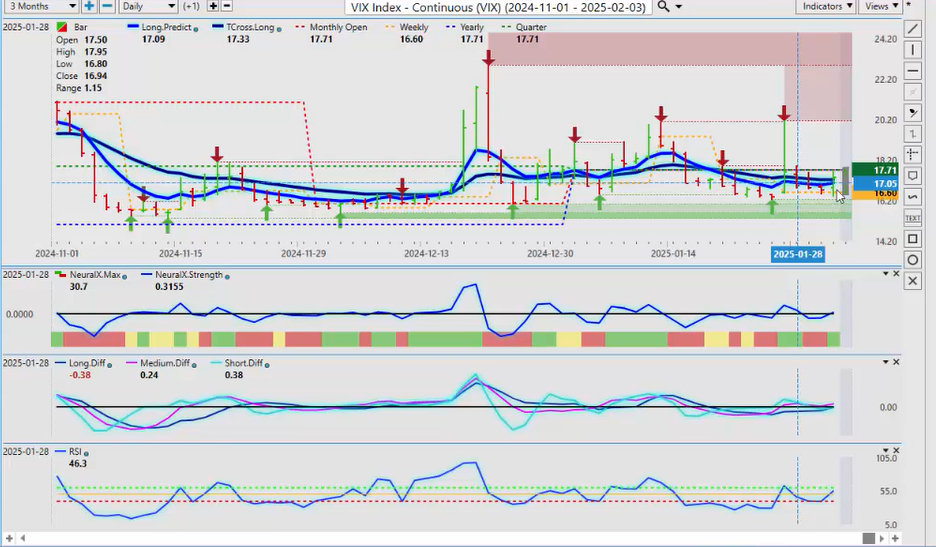
Now, when we look at the VIX, we can see that the VIX is pressuring the calendar yearly opening price. If we take a random 5 days, a random 30 days, a random 90 days, we’re basically pulling from 2024, which we don’t want to do. We use seasonal tools for that, but with this particular month, we’re looking at how it’s responding to the yearly opening price at $17.71. This is the area we need to keep an eye on; we’ve broken through that last Monday. I suspect we could break through it this Monday with everything that’s gone over the course of the weekend with the tariffs, but either way, you can see even after it retraced, the yearly opening price is what contained the VIX. So if the VIX breaks above that, then you’ve got a green light to short the equity markets, the DAX, things like that, but be very cautious because that trade seldomly does well for any length of time.
When we look at our predicted differences down here, our medium-term crossover and our long-term crossover, this is warning ahead of time, this being an outlook, that the VIX is likely to move higher, at least at the beginning of the week. So we’ll see how this one plays out, but the neural index turning green, the neural index strength is pointing up, the predicted RSI is failing at the 40 level; these are warning signs, very much like a tremor before a big earthquake. And there’s certainly enough on the table here for some volatility on Monday. So, just adhere to that warning, and if we’re holding below 1771, then that’s fine too; we know that the equity markets will remain strong, but a corrective move looks imminent at this particular time.
Crude OIl
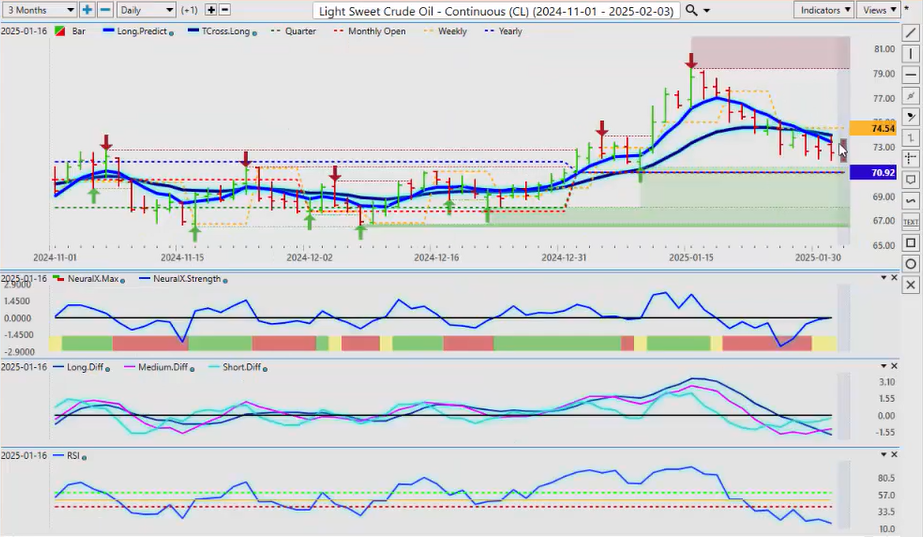
When we look at our main commodity of Oil, we can see as the market is moving lower, we have an MA diff cross that means the medium-term, the strength of the medium-term trend to the downside is weakening against the longer-term downtrend. We’re approaching again the calendar yearly opening price, 70.92. We would only short if we can get below this, and if we can’t, then there’s probably a long trade setting up here for next week and the week after. There’s been a relatively positive correlation between oil and the US Dollar; not 100%, but there has been one there. So again, if the dollar turns back up, we may see it pull oil with it, but at any rate, our neural index strength is rising; we’ve got a cautionary yellow on the neural index itself, predicted RSI 17.1. But this is the bread and butter right there, guys, that pink line crossing the blue line is a warning sign that if you’re short on this, you may want to think about locking in profit here and expect, if nothing else, a retracement back to our T cross long at 73.94.
Bitcoin
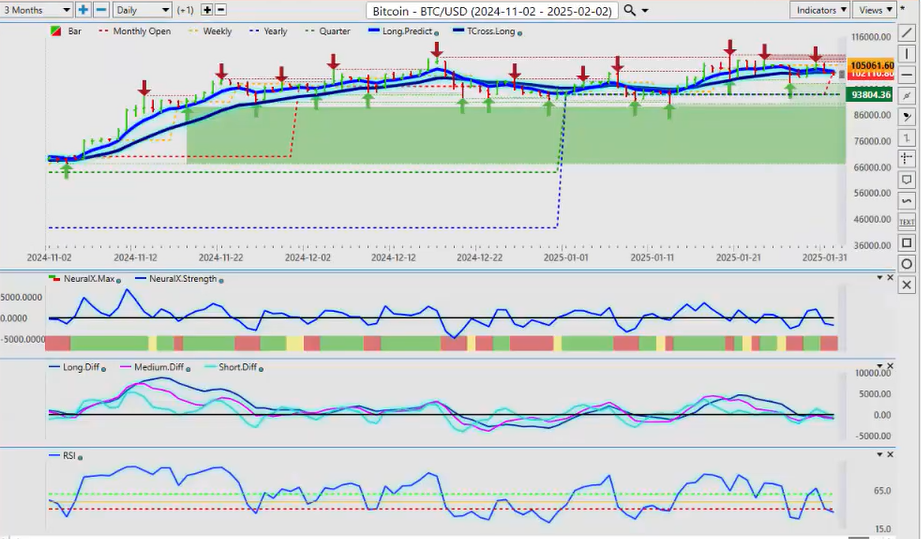
Now, once again, Bitcoin, from a seasonal standpoint, usually does quite well in the month of February, and we’re already having another great year in Bitcoin. This could be the final year before we get a corrective year next year, but for now, we’re holding above that yearly opening price, and that’s the one to keep an eye on, 93.804. We remain bullish while above that particular level, and it’s very important that I stress that, but for now, it is showing weakness. Bitcoin is showing some weakness, but that’s perfectly normal in a period of known US Dollar strength at the beginning of the month. I’m sure they’re going to pump the payroll number on Friday, that it’s going to be a hot one. I respectfully don’t agree with that; I think it will be a weaker number, and the dollar will likely sell off a week this Tuesday, like it normally does, and even if it is a good number, the dollar usually moves lower anyway in mid-month. So we’ll keep an eye on that, but for now, we’re looking for a buying opportunity. Keep a close eye between the T cross long at 102, 102.290, but either way, if we’re lucky enough to get down to 93.00, you’re likely to see a buy setting up around that particular area. We’ll just keep a very close eye on our VP reversal indicators.
Euro versus U.S. Dollar
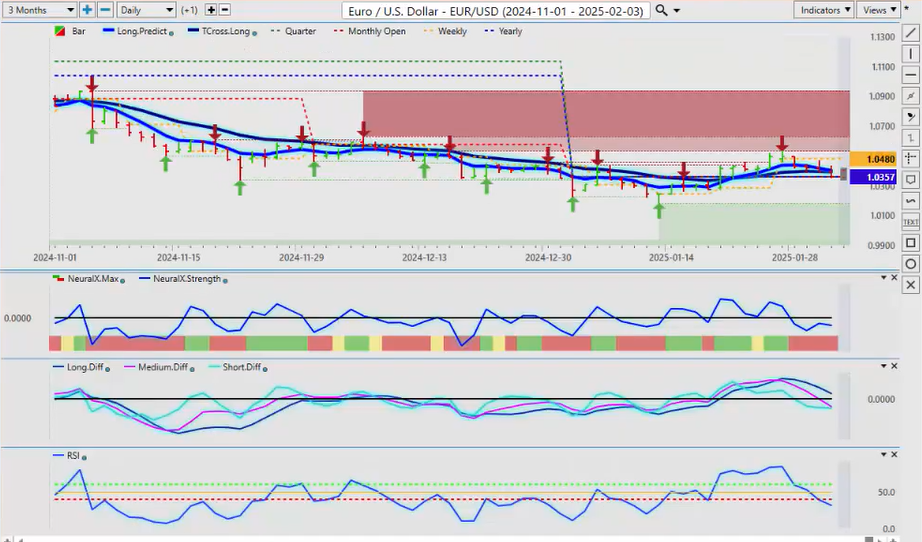
Now, as we look at the main G7 Forex pairs, starting with the all-important Euro/US pair, which immediately failed right out of the
gate on Monday, we broke down below the Monday low bar, and it just kept going. Now this is again where I can demonstrate to you guys the power of using a price action-based tool like the monthly, the yearly opening price, to determine what the market believes. And again, if we can break down below the yearly opening price at 1.0357 and stay below that, that paints a very bearish picture for the Euro. They’ve cut rates; the Fed didn’t. So we’ll see how this one plays out. Our MA diff cross again gave us a very strong warning sign right at the beginning of last week, so the same thing that would put us short is what would have us go long. I believe we’re at least a week away from that, maybe a week and a half, before the euro starts to turn back up. So this area at 1.0357 is likely going to be pressured. The predicted RSI, the predicted differences, the neural index, and again, we’re closing below that very important T cross long at 1.0391. We’re sitting right on about 1.1360; we closed the week. So watch for a break of this particular area; it could be a very, very choppy start on Monday.
U.S. Dollar versus Swiss Franc
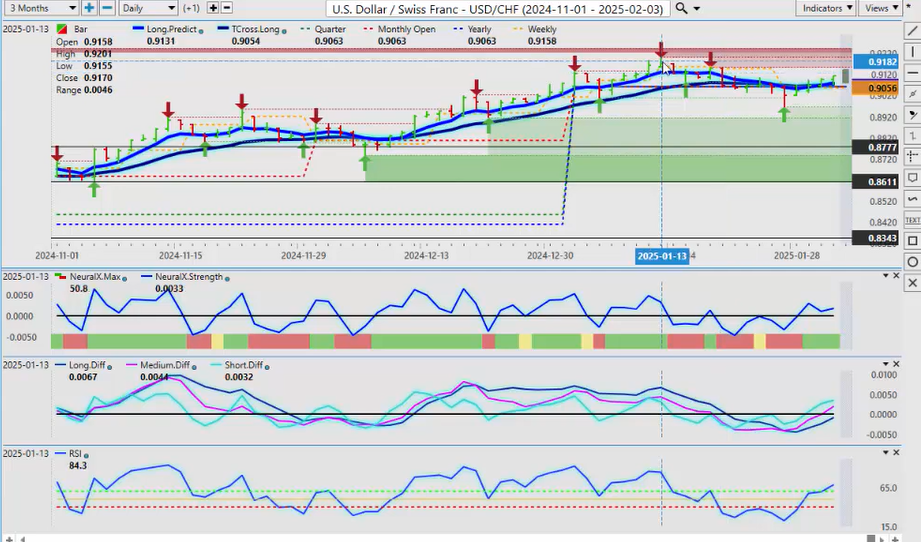
US Swiss Franc is the inverse correlation, and you can see it’s starting to push back up. We’re holding our yearly opening price; our TR cross long is also sitting there at 0.9073. This is a relatively easy analysis on this that we’re likely moving towards our next verified resistance high at 0.9152, but be careful up here, guys, and again, you’ve got a secondary at 0.92. So in order to really think about a more medium-term long trade, then I would like to see it get above 0.92, and I think it will struggle, and I think the payroll number on Friday could be a problem for the dollar actually. So we’ll see what that number is, but for now, the pair does remain bullish with the US Dollar inside that known period of US Dollar strength.
British Pound versus U.S. Dollar
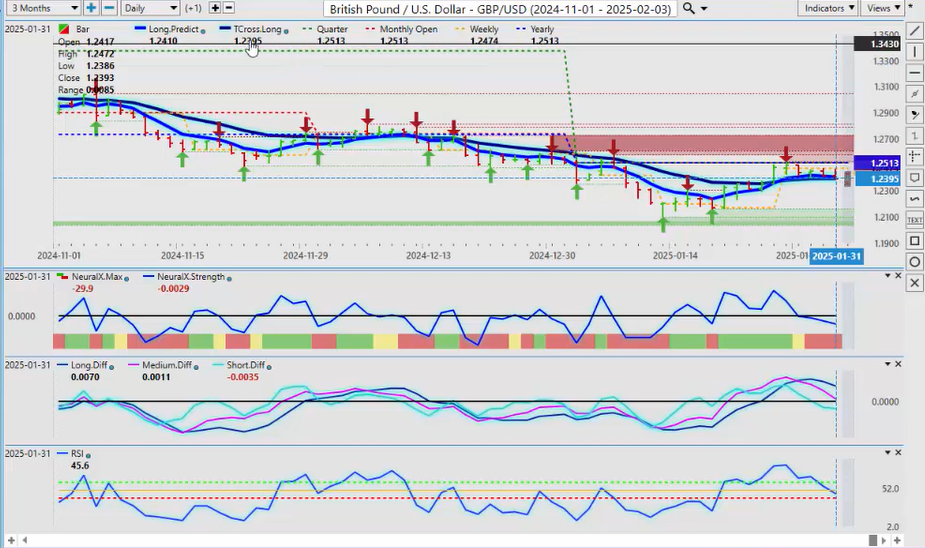
Pound Dollar did try and rally this past week, but again, an excellent demonstration of we’ve hit the calendar yearly opening price three times, and we have failed. The next break would have to be of the T cross long at 1.2395, and that would open the door to a lower push towards 1.2161. I don’t know if we’ll get quite that low, but it is possible, guys, very, very possible. But the main thing is to know your levels and your indicators. Again, some of you guys have called this the death cross, not a bad name for it, because it’s very seldomly wrong. When that pink line goes over that blue line, that is a warning sign, and when you combine that with a calendar yearly opening price, not a random 5 days, random 30, 60 days, that rolling performance model, guys, will just cause nothing but confusion. This is a hard anchor point. I can very clearly see this, and then combine it with the VP indicators to say, no, I’m not buying this here; I’ve got a very big problem here, and sure enough, it just inches its way down. So we’ll see how this one plays out next week. The volatility will be high on Monday; this is one of the most volatile G7 pairs, but also there’s been very good opportunity on both the long and the short side with this particular pair. So be cautious with it, but look for a potential break of that T cross long.
U.S. Dollar versus Japanese Yen
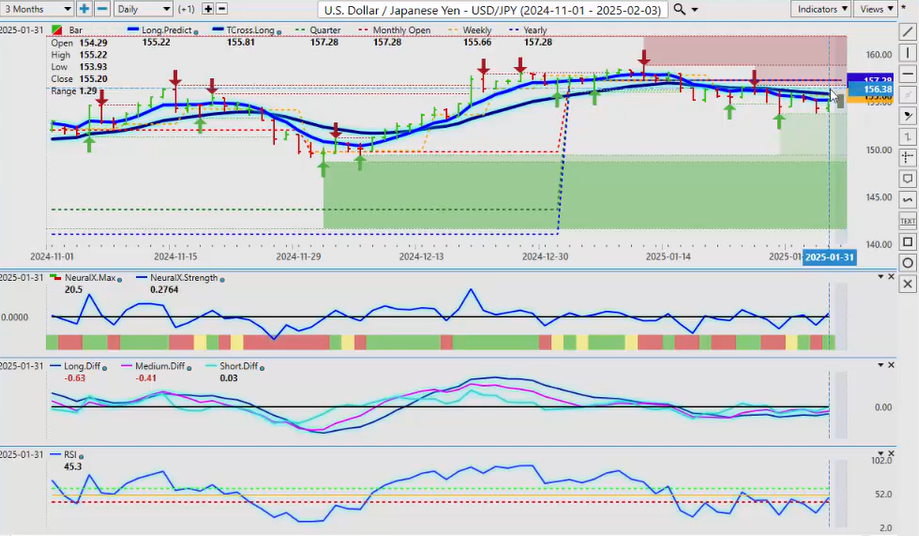
Now the Dollar Yen pair, again, is once again we can see the new calendar yearly opening price, which resets in January, the beginning of January, that’s 157.28. Short while below this area, our T cross long there is 155.81. There’s going to be, I believe, an unwinding of the carry trade later this year, potentially maybe in the second, third quarter, maybe even sooner, but right now, as you can see, they’re not buying this, and the Dollar Yen looks very different than what it looked like last year. Another way you can check that is go back a year in your software, and you can see that there was some strength there, but the carry trade was still on; now the carry trade is in question. You’ve got the Bank of Japan potentially getting ready to hike again, so I think the market’s a little cautious with this pair right now, but the easiest way for me to say it is, short while below 157.28.
U.S. Dollar versus Canadian Dollar
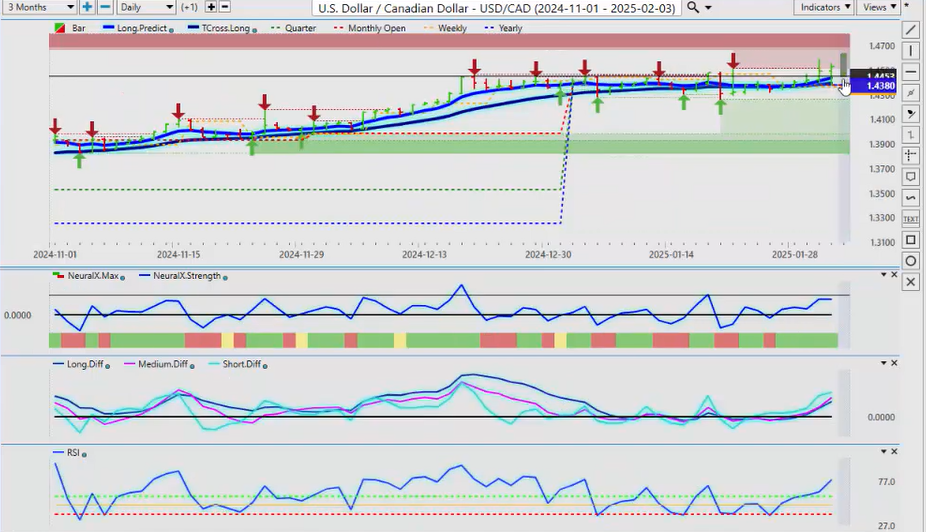
Now the US Canadian pair is likely going to get very, very choppy this coming week. The tariffs have been announced to take place on Tuesday. We could see this pair returning, at least in the short to medium term, towards 1.50, maybe even 1.60 or higher. We’ve got to see where we go with these tariffs, so this pair, I would strongly advise to either avoid this pair next week or just let it settle and see where things shake out. The volatility this past Monday was very high; it was like watching a yo-yo, actually, this pair, so be very, very cautious here. This is still an equity-based currency; it’s still an oil-based currency. If oil starts to rally, that may stabilize the Canadian Dollar, but I suspect it will take several days for this to calm down, and then I’m waiting to see if maybe Trump will flip on the tariffs and retract them or reduce them or say, okay, I’m willing to pull them off if you do this. Haven’t really heard that yet, so we’ll see how that one plays out.
Australian Dollar versus U.S. Dollar
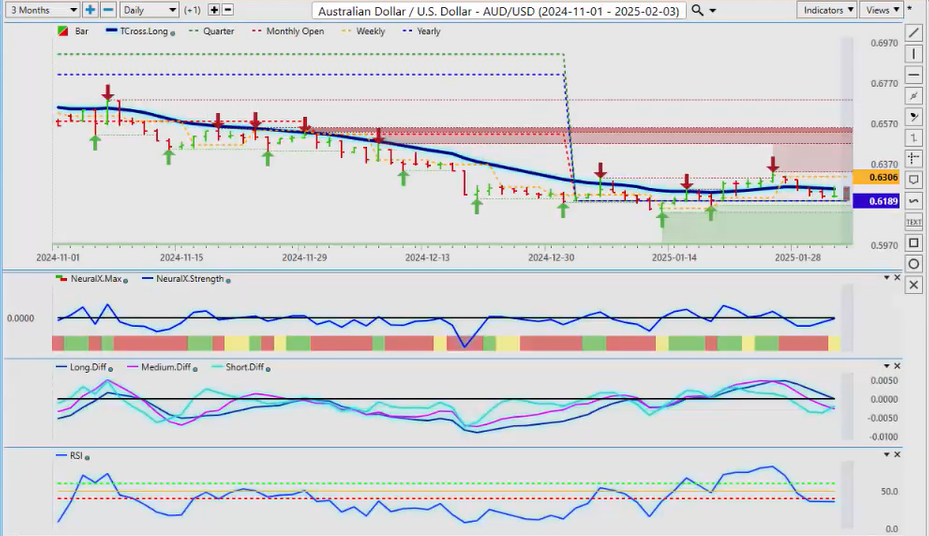
The Aussie and the Kiwi may be a safer bet instead of going to the Canadian Dollar, but the Aussie again, it needs to hold above 0.6189. The indicators here are quite mixed; we’ve got a short-term and a medium-term crossover, and a long-term crossover appears imminent. The question is, can we stay below 0.6189 on this currency to get this pair bearish again? As you can see, all this entire month of January, it’s been running along that yearly opening price, and every time it dipped below it, it rallied up but was contained by the TR cross long. So right now, we’ve lost that level again. If we’re going to have buyers come in, it’s going to be somewhere between the verified low at 0.6132 and the calendar yearly opening price. So if we can hold this area going into Thursday, Friday of this week, then that sets the tone for a long the following week when we know the dollar comes under pressure after the non-farm payroll number. And if that payroll number is soft, which I suspect it might be, then you’ve got potential longs setting up near the end of the week.
New Zealand Dollar versus U.S. Dollar
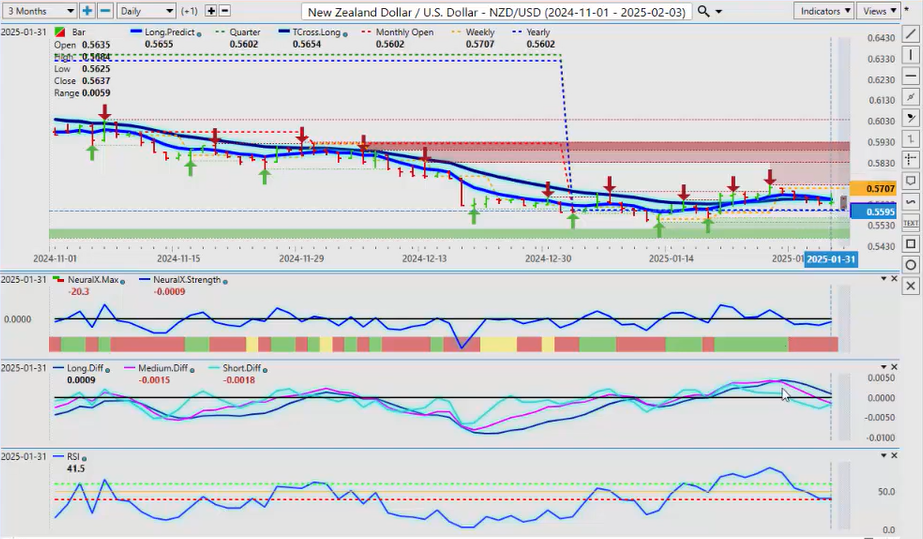
The same thing would apply to the Kiwi; it’s the exact same trade, guys, a virtually identical trade. They’re both around the US Dollar; predicted differences are the same, but you can see that we’re lacking momentum on the predicted RSI using a 640 split in a N9 period predicted RSI. That tells me on a break of 40, I’ve got downside momentum, on a break of 60, I’ve got upside momentum. That’s what I’m looking for is momentum; that’s the kind of market we’re in. So expect a very, very volatile, choppy start to the week, but with that, by midweek, I think we will see some very good opportunities.
So with that said, this is the Vantage Point AI Market Outlook for the week of February the 3rd, 2025.


