


Welcome to the Artificial Intelligence Outlook for Forex trading.
VIDEO TRANSCRIPT
Okay, hello everyone, and welcome back. My name is Greg Firman, and this is the Vantage Point AI Market Outlook for the week of July 1st, 2024.
U.S. Dollar Index
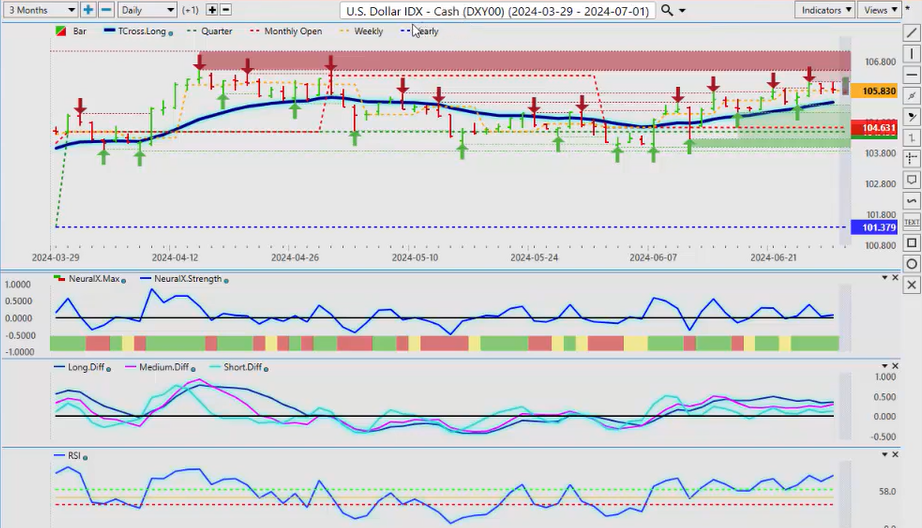
Now, to get started this week, we’ll begin where we usually do with that very important US Dollar Index. Now, the needle has not moved much on the FED Fund Futures bets; we’re still looking out towards September, November, December for those, but that could drastically change this coming Friday with the payroll number. I don’t think the FED minutes will really affect much, but the payroll number on Friday is very important because we’ve seen a lot of weaker numbers, and if the Fed sees that, it could change the bets for an earlier cut in September or multiple cuts going forward. So our key levels in our VP software are T cross long coming in at 10545. Basically, we’re running almost flat. The US Dollar again is normally strong at the very end of the month into the first week of the new month, up to and including the non-farm payroll number, and then usually sells off the Tuesday afterwards. So our key support is 10545. If we click on our F8 on our Vantage Point software, we can see very clearly that the market is hugging that very important long predicted. Also, every single day this past week, you can see that the market has come down, hit that level, and then moved higher with the neural index and the neural index strength. So once again, that level is now 10581.
So support, and again, for the Dollar to continue to advance, you have to have hotter inflation data. This is not a technical picture; it’s a fundamental one. So once again, we’ll monitor the data that comes out this week. I believe we have some other inflation data, but those are the key levels to watch, and right now, we’re basically just running sideways with a slight upward bias. Now again, our most recent high is around 10632. Regardless of the data, I anticipate these levels to hold, and that would be a very good selling opportunity up there.
Gold
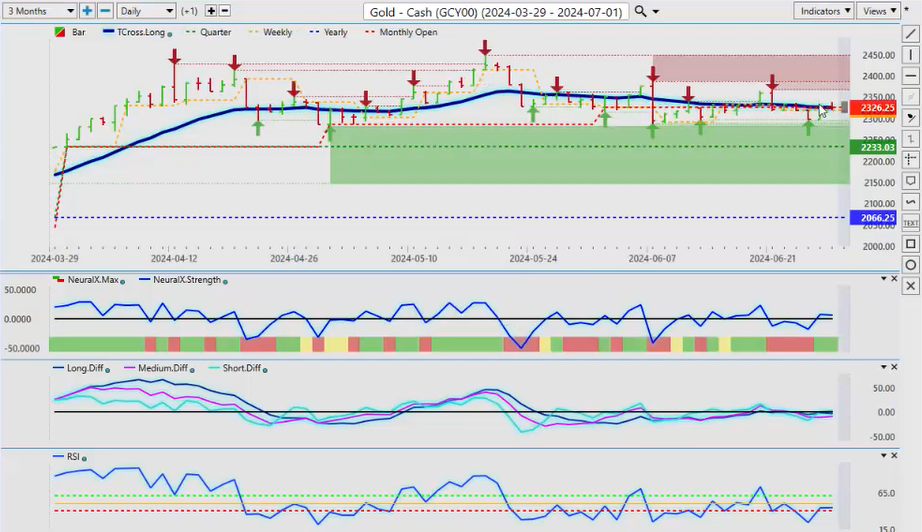
Now, Gold contracts, once again, Gold is basically dead flat. We had a little bit of a push lower but immediately recovered on last week’s softer inflation data. Again, a fundamental trade here, guys; it’s not all about technical levels. It’s also about fundamentals that drive the market, like the Fed or the inflation data. So right now, Gold remains firm. A test down to the 2233 area pre-non-farm payroll number can’t be ruled out, but once again, when we combine the levels—and again, this is a weekly outlook, guys, not a daily—so I tend to shy away from the shorter-term indicators, but I do have them on screen with the neural index, the MA diff cross, and our predicted RSI. But for now, 2233 still cannot be ruled out. If we click on our F8 in the software, we can see that we’ve overtaken 2319, but we must stay above this level, guys, if Gold is going to advance higher. The indicators are still slightly negative on the predicted differences; the predicted RSI is saying we have little to no upward momentum, but again, that can change very quickly based around that inflation data next week. So we’ll keep an eye on it. Gold is still a little bit soft at the current time.
S&P 500 Index
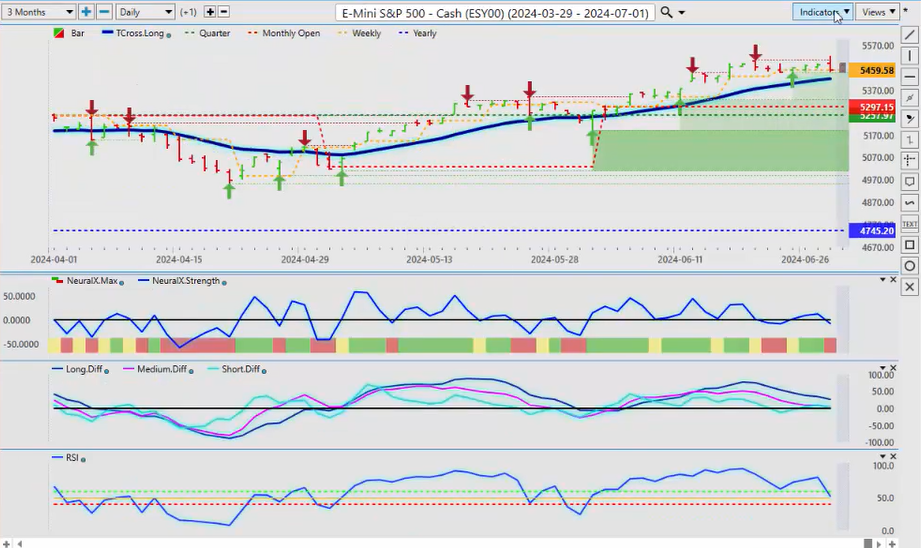
Now, when we look at the stocks going into next week, the S&P 500 shows relentless buying. Now for our key levels for next week, I do anticipate stocks will pull back next week; they usually do leading up to that payroll number. So our key support level is 5420. Indicators are actually pointing down, which is consistent with this time of the month, guys. That’s the key point: that Dollar cycle or dollar buying indirectly usually softens the stocks at the end of the month into the first few days of the new month. So right now, that T cross long—we want to make sure we’re also looking at that. And as you can see, we’re giving that up a little bit, but a very effective trading methodology is also using the long-term crossover without the black line, just the blue line. That’s all we need to see, and we can assess that the market is in daily contact with this particular level. So for Monday, our predicted low for the day is 5448 and our long predicted is 5466. So for day trading, that’s what we would look at. But we do have a gap down to 5420 on the S&P. So again, unless we break down and stay below 5420, buying on a dip is still the preferred strategy.
Bitcoin
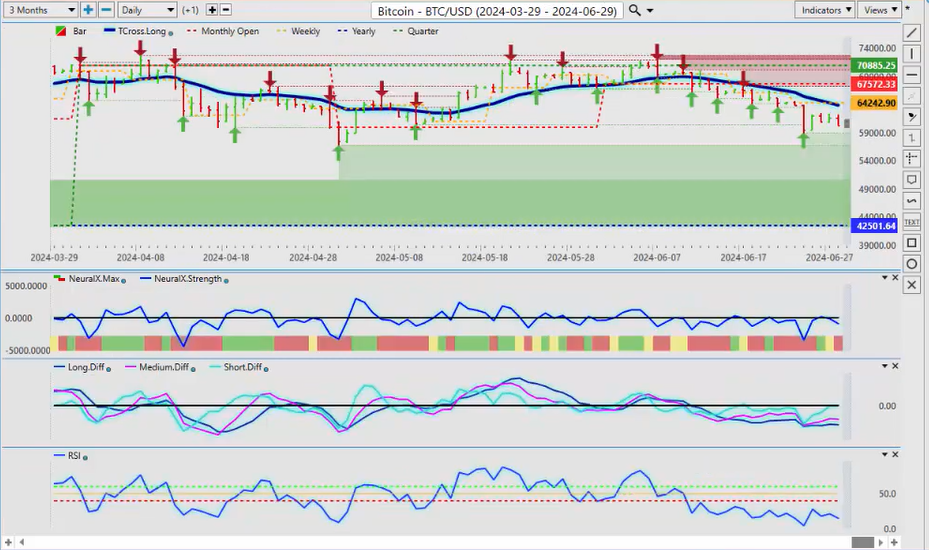
Now, with Bitcoin for next week, Bitcoin is under pressure again, but once again, we’ve got very strong support down here at 57,000. The next big move on Bitcoin is usually the end of September and October, a very good month for buying Bitcoin. So we are officially going into summer trading; I don’t expect a lot of fireworks from Bitcoin next week. But again, buying on the dip is once again a preferred strategy, given the powerful trend of this particular being up 155% approximately last year and well up this year too. Our yearly opening price there is 42501, so unless we get down below there, any move towards this area would be again a buying opportunity. The indicators are mixed, but we do have signs of life here. But I anticipate Bitcoin to be a little bit soft going forward because of that Dollar buying that we’re likely going to see next week.
DAX
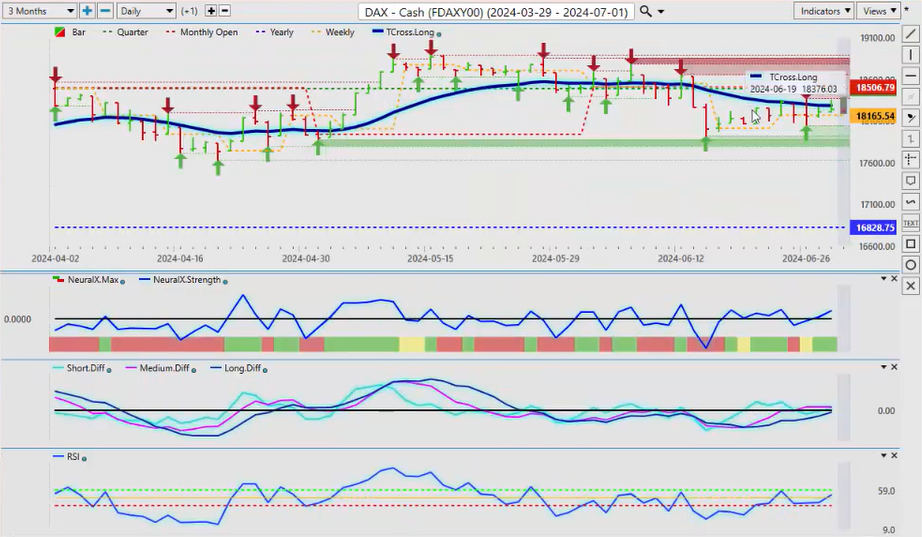
Now, when we do a comparative to the European equity markets with the DAX, you can see that the DAX is starting to rebound off that current quarterly opening. Now, we’re going to have a new quarterly opening price for next week’s outlook. That’s very, very important. Each time we start a new quarter, a trend usually develops here, and I would argue in this particular scenario that it would likely be an upward trend. We can see the predicted differences are moving above the zero; we’ve got momentum, upward momentum, building on the predicted RSI. We just need to get above that T cross long at 18,287. Now, with the French elections, there’s going to be volatility in the DAX, but like any other fundamental event, it will pass. Now, when we click on our F8 here, you can see that we’ve crossed over our long predicted level, 18,197. We use that pretty much that exact same level, 18,216, as your buying opportunity. So for Monday’s trading, the predicted low is coming in at 18,194, and that matches our predicted low. So these two levels—excuse me, 18216 on the long predicted and the daily coming in at 18,194—are side by side, and that’s what we look for, guys, in a day trade or even in a trend, potentially a trend reversal. But make no mistake, the DAX is very firm on the year while we’re above 16,828.
VIX
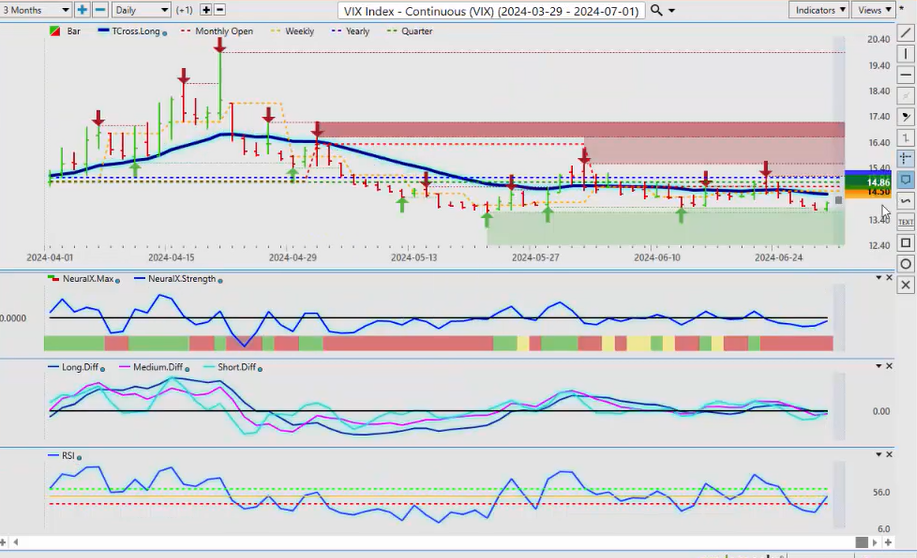
Now again, looking at that comparative in the VIX, we always want to make sure we’re keeping an eye on this because it could be a leading indicator, often is for the dollar, stocks, even commodities, but mainly equities. So right now, we’ve got some verified support—the verified support low approximately going back to May 21st. Then we have another one on May 28th and additional support coming in on June 12. So that’s all coming in down around the low of 13,000, approximately 13.85 on that share price. So again, you can see some buying coming in here, and the indicators are starting to rebound, but it’s only a corrective move, guys, unless we get above our T cross long at 14,030, or excuse me, 14037, and then our yearly opening price—very, very important—15001. We would need to clear that to see the equities come under pressure. Now again, the indicators are slightly mixed but still mainly pointing towards weakness in the VIX.
Euro versus U.S. Dollar
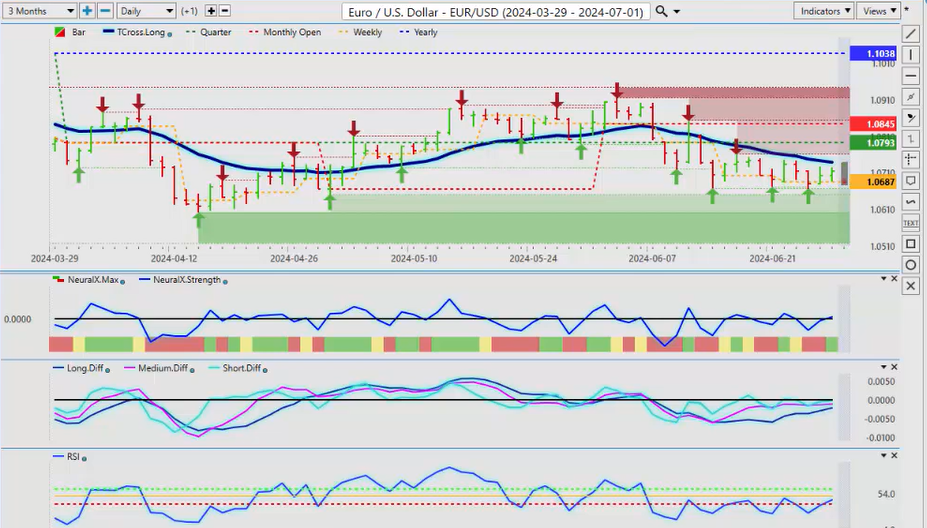
Now, when we get into some of our main forex pairs for next week, starting with our main one, EUR/USD—all eyes are going to be on that with the French election, the Dollar Index, the payroll number, and I believe we also have a Fed speak next week too, so quite the combination of inflation numbers, payroll numbers, and Fed speak. It’s going to be choppy. So right now, the Euro—and I will concede this point clearly—is in a downtrend in 2024. That is a fact. There’s our opening price: 11038. But I also think that the Dollar gains will be limited, very limited, into year-end. The Dollar usually rallies in part of August and September, and then that’s the end of it for the year. So probably a little bit more downside on the Euro here. Our T cross long is 10738; we’re short while below that. If we click on our F8 in our software, this is where it gets a little sticky. That long predicted is 10706, and we have a number of three verified zones almost in the same area here that are building up, and that’s right around 10660. So in my respectful opinion only, there is good two-way action on this: buying lower into that mid-106 area and then selling above 107 appears to be the main play. But I do think we are going to see a bigger move coming this week in the **Euro**, but again, that’s a fundamental event with the payroll, the French elections, and if any of the inflation data is going to move the needle on those Fed fund futures. That’s what we need to see. So again, right now, if we can get above 10706 and stay above it, and the indicators in VP are starting to rise, then there could be some longs on the *Euro*, but I believe we are a week or 10 days away from that actually happening, or not until we at least get that payroll number on Friday.
U.S. Dollar versus Swiss Franc
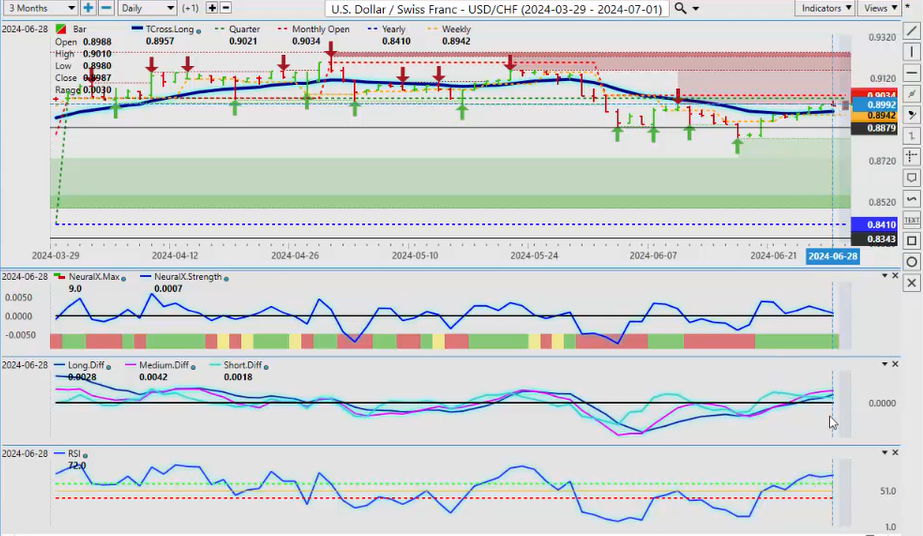
Now, USD/CHF is trying to make a move again. It crossed over our T cross long last week, but now, once again, we’re going to get all new updates—a new monthly opening price, a new quarterly opening price. So it’s kind of an important week. But it’s showing strength in the US Dollar against the Swiss Franc. Another instance where the Swiss National Bank caught the markets off guard again by cutting. But the question remains, why is the Fed not cutting? This is the point: even once, like the ECB, and now the ECB is refusing to cut again till they see what the Fed’s going to do. So this is all about central banks here, guys, but ultimately, they’re all going to be cutting; nobody’s hiking. And that’s the way we’ve got to look at it. So the Dollar is running fairly firm, but it is on borrowed time here, especially in an election year. So right now, that monthly opening price is coming in at or about 9034—that’s your resistance for next week—and your support is our T cross long at 8957. And again, if we click on our F8 in our VP, you can see using that long predicted, the long-term crossover with just the blue line, we’re getting some good movement, good daily buying off that, guys. And for Monday’s trading, we’ve got our predicted low at 8968; that almost matches that long predicted at 8960. So it gives us a very clear picture as to where that support is but also where the resistance is.
British Pound versus U.S. Dollar
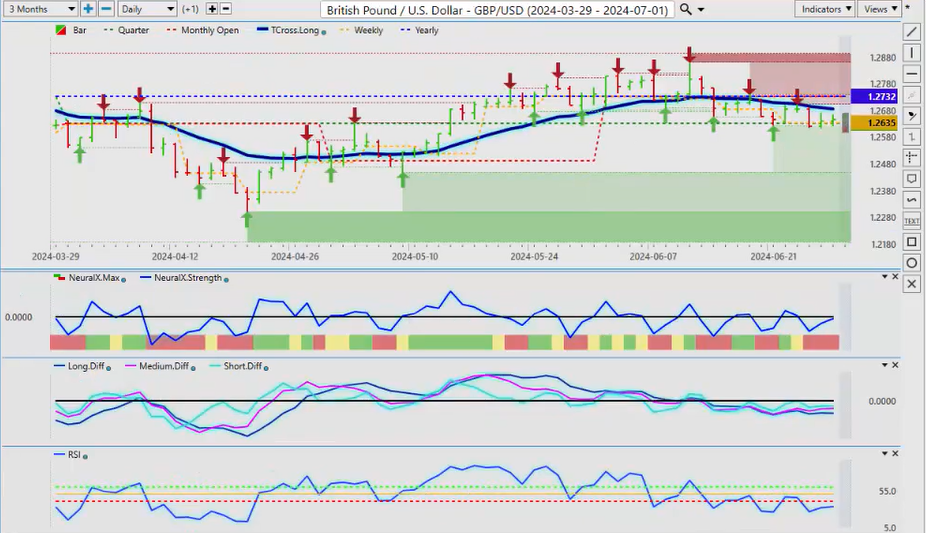
Now, GBP/USD is once again recovering somewhat, but we’ve fallen slipped below 12732. So from a technical picture or a price action-based one, it’s still bearish. We don’t have any buyers, but we don’t really have any sellers either. So the most recent verified support low is 12622; that’s the key level to watch for next week. Can we break below it? But again, remember, there’s a Canadian holiday on Monday and, I believe, a US holiday on Thursday, July 4th. So you’ve got a considerable amount of economic data coming out, so it’s going to be very choppy. So the Pound I believe will come under a little bit more pressure, but the indicators, if looking at the neural index strength—now, this is interesting—the neural index is red, but the neural index strength is pointing up. That’s what you want to look for, a type of divergence, because the neural index strength gives us a window to see what the neural index is looking at inside of it, and it’s actually pointing up. So maybe a rebound on Friday, or excuse me, on Monday, and then we’ll see where we end up. Now, our F8 is pushing lower also; that level’s coming in at 12657. So we know where our resistance is and we know where our support is. But as you can see, if we lose the 126 level, that potentially could be a big problem. That could potentially open up the door to the 124-125 area, and if you get a hotter non-farm payroll number on Friday, that area would easily be tested.
U.S. Dollar versus Japanese Yen
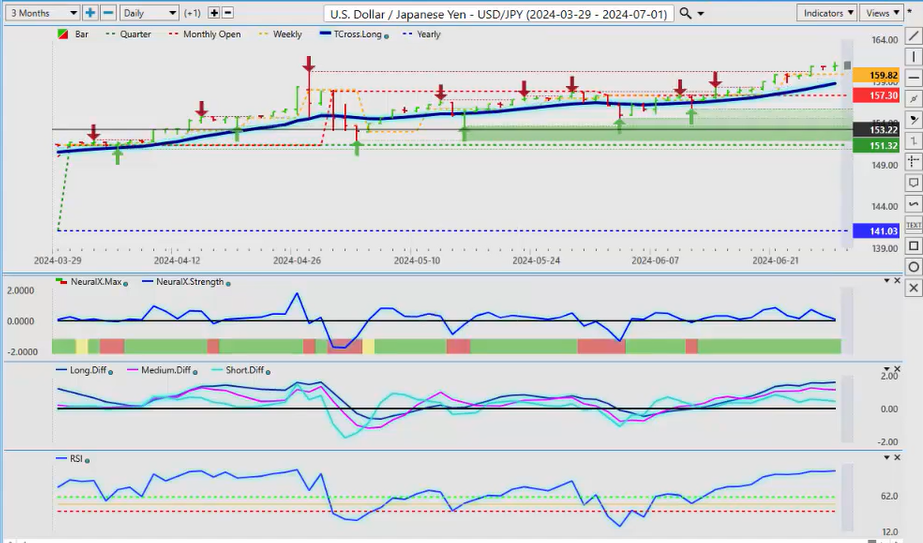
Now, the USD/JPY: all eyes are on intervention from the Bank of Japan. But in my respectful opinion only, they tried the intervention, and this is what they got. So this is their mess, guys. The Yen is really taking a hit. So how much further can they push this before the Bank of Japan steps in? But even if they do at this point, I don’t think now they’re fighting a very powerful carry trade with the Fed refusing to cut. And again, the interest rate differential between the Bank of Japan and the Fed is substantial now at over 5%, I think, around 5% difference. So they’re not leaving this long trade. So the Bank of Japan has their work cut out, but this pair is going to be very, very volatile. I could see, regardless of the data, the market coming back down to our T cross long at 15874. If again we look at our F8 here, you can see that the buyers are consistently picking this up on a daily basis. But what you really want to do here, guys, is when this works the best is when you get either the long predicted of the T cross long and the daily predicted low, where they’re very close to each other, so that there’s no gap to fill here. So there’s a bit of a gap to fill on the T cross long but not a lot.
Australian Dollar versus U.S. Dollar
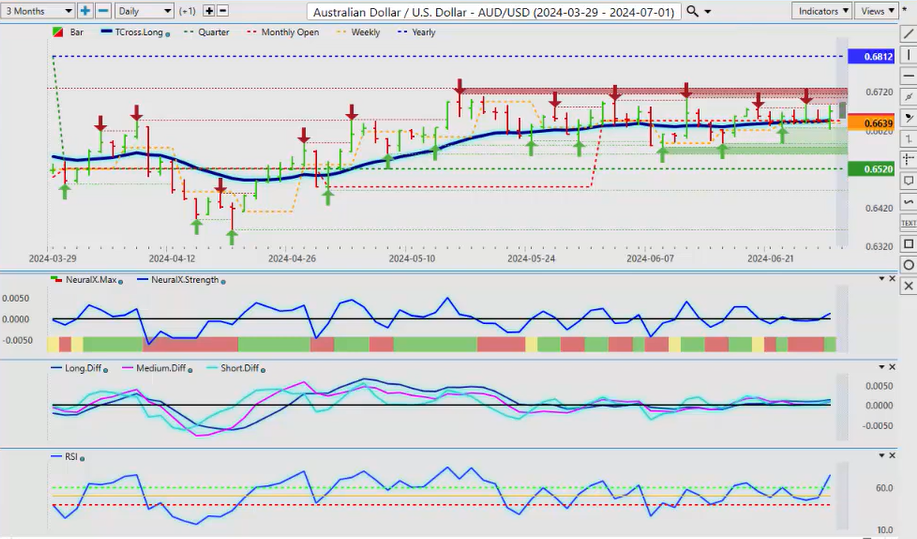
Now, the AUD is benefiting. They’re starting to see a little bit of hotter inflation data too, but again, the 2% target is a made-up number, guys. That’s all I can tell you. Where the history of the 2% inflation target came from—not from any economic paper that I’m aware of—it came from the finance minister in New Zealand, and he just blurted it out one day and said, “Okay, well, we’re running really hot inflation at 16%,” I think it was in 1987 or 1988—you can Google it—and he said, “I think we’re going to go with a 2% inflation target.” But it wasn’t based on anything. So next thing you know, the Bank of England and the Bank of Canada pick it up, and they said, “Okay, we’re going to go with 2% too.” Then the FOMC hires a Canadian, Ben Bernanke, and he turns around and says, “I think we’re going to go with 2% also.” So again, we can debate this up and down, but the reality is here is they’re likely all going to have to cut here, and when the US does it, the Dollar is going to take a hit. So they’re refusing to exit stocks, they’re refusing to exit gold longs, the metal long trades—that all helps the AUD, the equities, the commodities. So right now, that T cross long is 6646. You can see looking at this chart that there is significant resistance up here. The yearly opening price is 6812. We’re still negative on the year, but when the Dollar turns, this pair will be a very good buying opportunity, as will the NZD. And as you can see, the difference between—this is a question I actually got from last week. And if you guys want to email me questions, etradefx@gmail.com, I’m happy to answer those, any of your questions.
But the difference in what’s happening here—yes, that inflation data is why these two pairs are not running both above the VP T cross long.
Australian Dollar versus New Zealand Dollar

But your culprit, guys, is this one: AUD/NZD. And for the forex traders watching, this pair has become very attractive to me. Instead of trying to trade AUD/USD or NZD/USD all the time, I tend to now go after this one.
And as soon as we crossed over our T cross long, you can see that we started to advance. So in theory, you can buy AUD/USD and you can buy AUD/NZD as a dual trade because the NZD is the one taking the hit. But the indicators here—and to sweeten the pot a little bit—you can see the yearly opening price, how we basically rebounded right off that area. Then we crossed over our T cross long, and it led to a pretty substantial rally without worrying about how the US Dollar is affecting the NZD or the AUD. Like the AUD/NZD pair, guys, it’s made up of AUD/USD and NZD/USD. It’s a synthetic cross pair, and so we can take advantage of these cross pairs if we understand how they actually work and how the Dollar comes into play.
So we have a very, very full docket next week. We have, again, a holiday in Canada, a holiday in the US, I believe, on Thursday. So you’re going to see some real choppiness, but with that will come opportunity. So with that said, this is the VantagePoint AI Market Outlook for the week of July 1st, 2024.


