


Welcome to the Artificial Intelligence Outlook for Forex trading.
VIDEO TRANSCRIPT
Okay, hello everyone, and welcome back! My name is Greg Firman, and this is the Vantage Point AI Market Outlook for the week of July 22nd, 2024.
U.S. Dollar Index
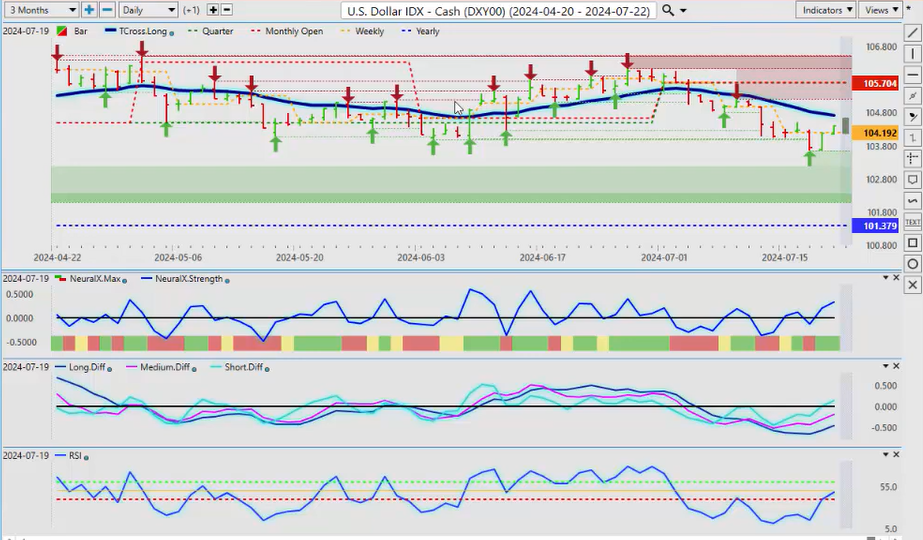
Now, to get started this week, we’ll begin with the US Dollar Index. Again, when we look at the dollar, it’s important to remember that we are in the US fiscal fourth quarter where the dollar is usually stronger from mid-August through to the end of September and then it turns. So once again, we’re holding below our very important quarterly opening price at 105.70. This is a critical level of resistance that the dollar must overtake if it has any chance of moving higher.
Now again, rate cuts now appear imminent, likely two to three rate cuts. It’s almost guaranteed now for September, with November and December being the ones that will affect the dollar. But either way, guys, the dollar usually sells off at the end of that fiscal fourth quarter, which is again October 1st. The indicators here in Vantage Point are rising, suggesting this is a corrective move back to our T cross long at 104.71. We have to overtake that to get to our quarterly opening, which comes in at 105.70. But that’s likely where the dollar will fail either way.
Gold
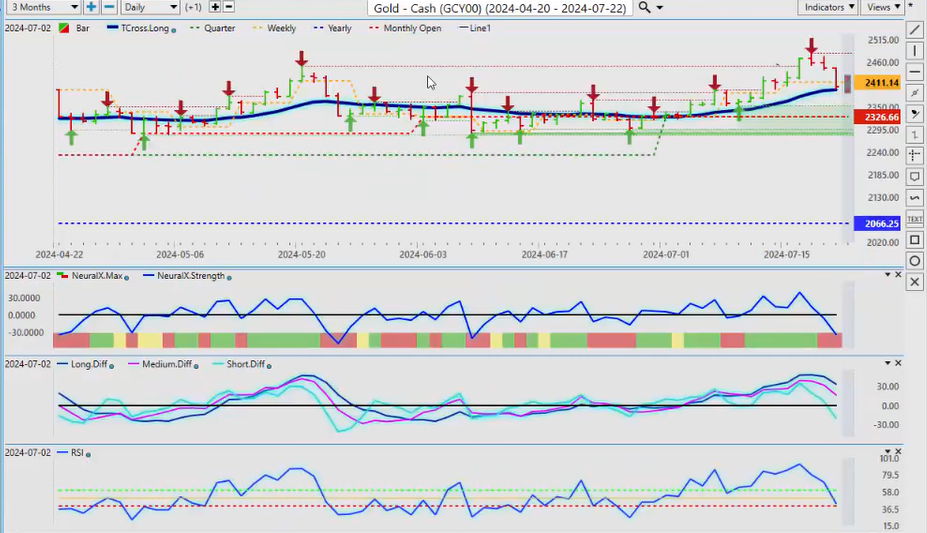
Now, on this dollar strength, we can see that gold once again in the Vantage Point live training room. I’ve discussed this, and we’re exiting gold longs anywhere above 2460; we’re out of this. So, we’ve had a full retrace here back to our T cross long at 2392. In most calendar years, the seasonal pattern in gold starts after October and gold is strong right into January of the following year. So, I do expect further downside on gold, but 2326, our current quarterly opening price, is very important.
Now, the reason I’m emphasizing the quarterly opening is because we have a first, second, third, and fourth quarter very similar to weather patterns, where we have spring, summer, winter, and fall, and there are patterns that fall in each one of those: rain, snow, heat, all these things. But in the financial markets, it’s very similar. So again, when we look at this, it doesn’t surprise me that a bull trap was set up here on gold up near this high at 2449. Now, we could rebound off of the T cross long; that is still possible, but the Vantage Point indicators are pointing towards breaking the T cross long and likely heading back to 2326. But to emphasize, gold longs are absolutely in play after mid-September, guys.
S&P 500 Index
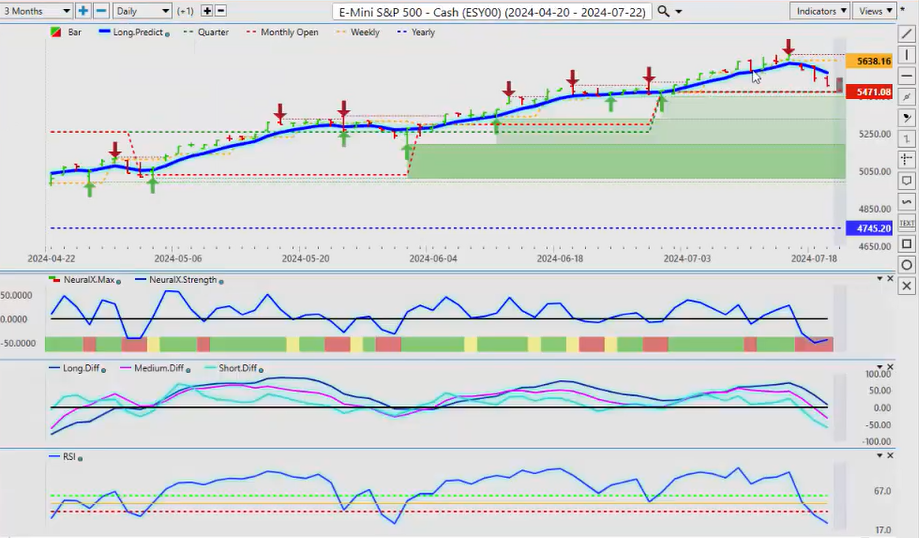
Now, when we look at the equity markets here using the S&P 500, everything basically responds to that dollar. Now, with that dollar strength, we have lower gold prices, lower oil prices, and lower equities. So, we have crossed over our T cross long, but the line in the sand for next week, guys, because again, this is a weekly outlook, one week only, not a monthly or a quarterly outlook—it’s every week. So right now, 5471 is a critical level of support that most traders never see or use. If we break down below that quarterly opening, then we’re bearish, and that would be reasonable, respecting the fact that we are in the US fiscal fourth quarter where there is real dollar demand in the month of September. So, I do anticipate further downside on the equity markets, but we want to watch this level very closely around this quarter because we would have to break down.
Now, we do have a short-term crossover, a medium-term crossover, which is the predicted difference crossing the zero line, and momentum on the predicted RSI breaking the 40 level, showing that there could be momentum building to the downside here. So again, we’ll continue to watch this, but the indicator that I will take note of is the neural index strength indicator, where we can internally see inside that neural index, and it’s starting to reverse back up. So keep an eye on that level for next week and be careful of a potential bull trap below that 5471 area.
DAX 30
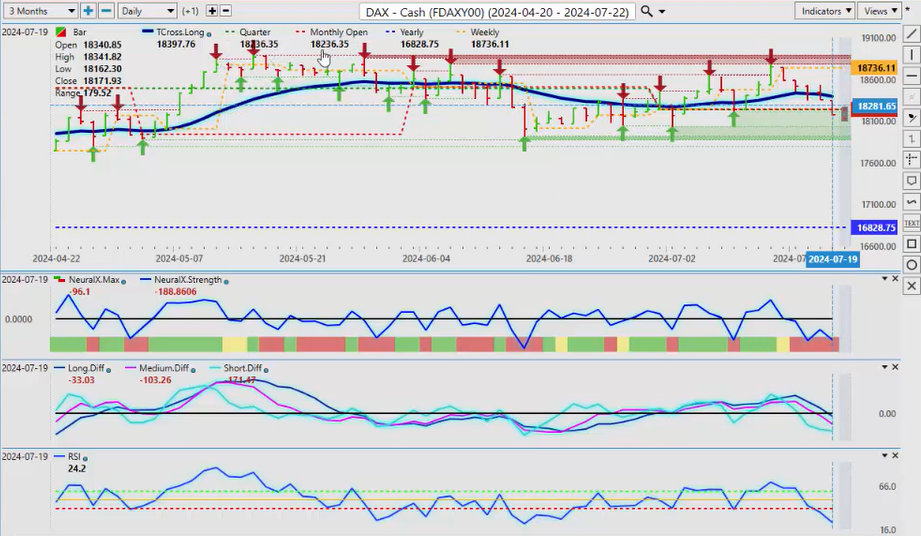
When we do a comparative to the DAX 30, the European equities, we can see that they’re identical—almost the exact same trade, the sell-off happening at the same time. This is evidence that the global markets are becoming globally connected. So, with the DAX moving lower, we’ve got a break of our quarterly opening price that’s coming in at 1823. This would suggest to me that it is imminent the S&P 500 is going to break below its quarterly opening. The question is, can both stay below that? You can see the predicted differences are the same, but in this scenario, with this dark colored blue line crossing the zero line, we actually have a short, medium, and long-term crossover. So, is it possible the European equities are the direct correlation or the warning that the S&P, the NASDAQ, and some of the major US indices are going to move lower also? That is entirely possible. We do have momentum building here. So again, the next verified support low is going to come in at 1790, but we must hold below this 18236 to confirm that shorts are in play. But that is a reasonable play given the proximity to October 1st that the equities are likely going to struggle here.
Volatility Index ($VIX)
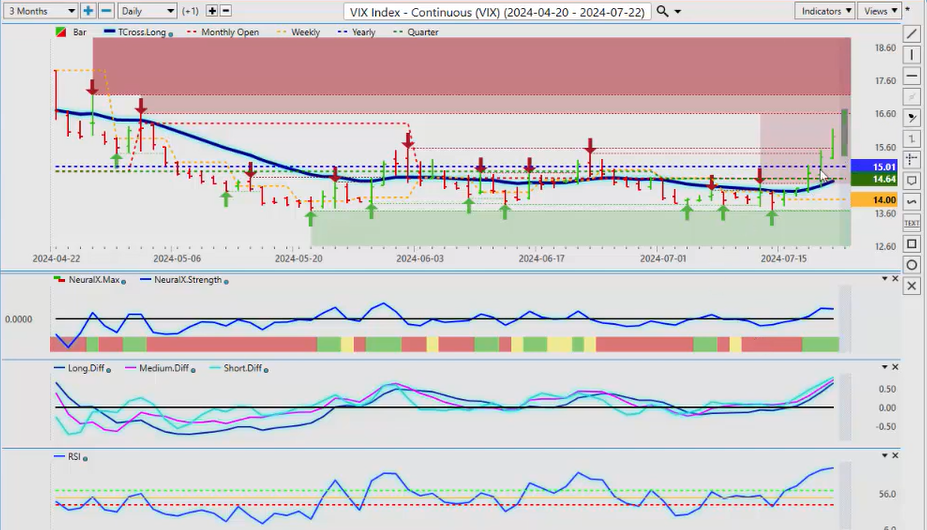
Now, when we do a comparative analysis to the VIX, we can see that the VIX has broken its yearly opening price. We’re firmly above our T cross long. This is the strongest warning that the equity markets could be under pressure next week and for the remainder of July and potentially August. So again, the VIX yearly opening price, the VIX is officially turned positive on the year at 1501. As long as we’re holding above 1501, then there is going to be a problem with the major indices. The one thing I will note here is the predicted RSI at 91.9. So definitely, one could say a little bit overbought, but an overbought/oversold signal doesn’t carry as much weight as it used to in the current markets with the algorithmic programs, quantitative analysis, and a number of different things where these programs will buy high and they will sell low. But again, the VIX is a leading indicator as to the health of the equity markets, and this is suggesting the equities are in a little bit of trouble here.
Bitcoin
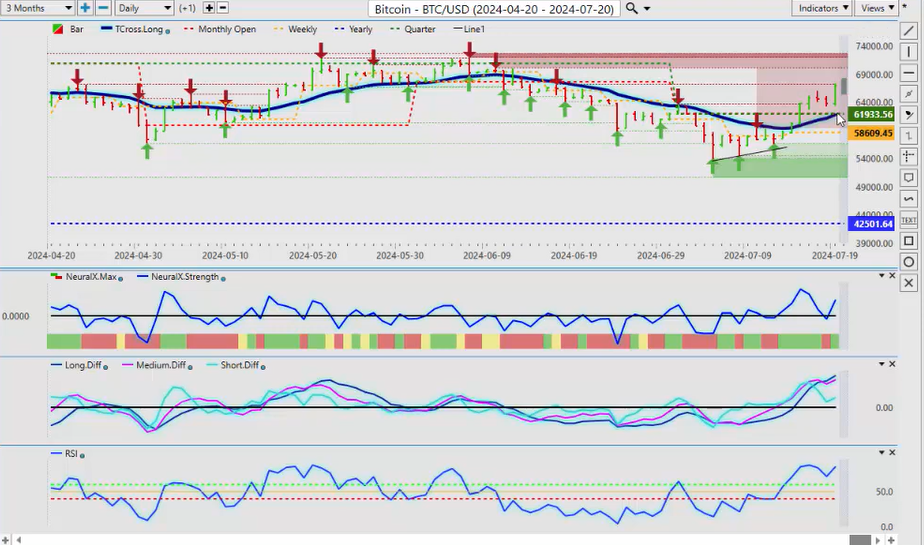
Now, when we look at Bitcoin, once again, Bitcoin is completely ignoring the other markets and extending higher. Now, we do have some verified resistance, a verified resistance high that’s coming in at about 67014.7. That’s our immediate resistance for next week. Our T cross long that’s coming in at 617, our quarterly opening, very important, 6163.3, that’s our support level for next week. That’s actually our support level for the remainder of the quarter, guys, and this is why it’s important to use indiscriminate indicators that are price-based also with the market analysis tools because we always want to know where we are. Because the media will constantly spin this that, like they did the other week with Bitcoin, Bitcoin’s going lower, Bitcoin’s going to sell off because of what’s happening with the Euro Bitcoin exchanges. None of that was relevant, guys. It was a trick to get you to short or exit your longs, and then Bitcoin goes higher. So, by year-end, the main seasonal pattern with Bitcoin is between mid to late September and mid-November, with October being a very hot month for Bitcoin. So, it looks like they’re moving in on this already to get long. The indicators, my only little bit of concern here is that MA diff cross here picked up on something. Now, that was this week, not last week. So again, a little bit of concern there. But as long as what we’re really looking for is that T cross long to cross over our quarterly opening price at 61933, and that is a very bullish play. But it is very interesting that you can see that money is going into Bitcoin and not going into gold. You still have China and India buying gold as they’ve always been, but the reality is somebody much bigger is buying Bitcoin, and the likelihood that we move towards that 100,000 mark by year-end is a viable target here, guys. That’s the best I can say.
Light Sweet Crude Oil
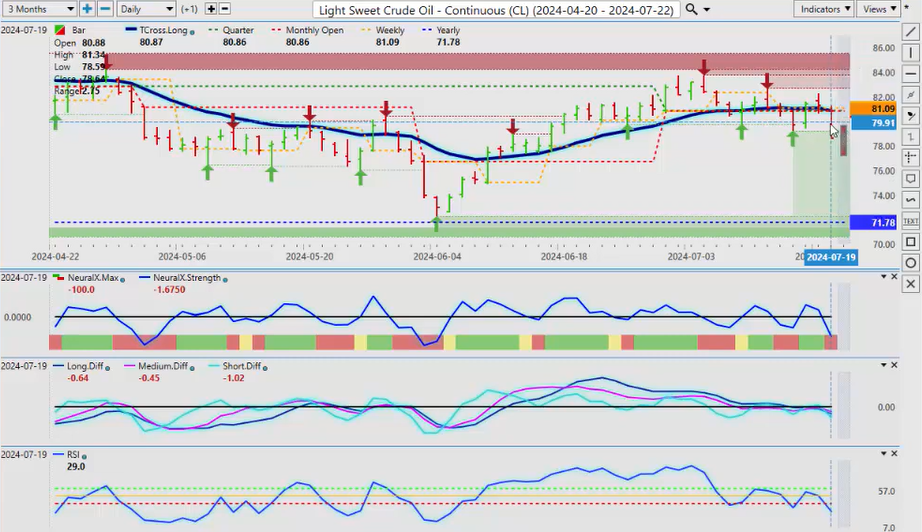
Now, light sweet crude oil, when we look at light sweet crude oil, once again, in my respectful opinion only, the direct inverse correlation is to natural gas. So, if oil is moving lower, there’s a strong seasonal pattern that begins right around now on natural gas, and this is actually confirming that. We’ve lost our T cross long, we’ve lost our quarterly opening. We’re still bullish on the year at 7178, but I believe that it’s possible that natural gas is causing this, and this is the power of the intermarket technical analysis that even if this trade doesn’t work, it points us to another trade. Now, I concede that there’s supply issues with natural gas and everything else, but the fact remains the last five years in a row, natural gas has gone up at this time and it has an inverse correlation to oil. So further downside here is very likely on our oil contracts, but again, we need to hold below 8086, the current quarterly opening. But now we can see that our T cross long is interwoven with that quarterly opening, and that puts oil on the bearish spectrum for at least this current quarter.
Euro versus U.S. Dollar
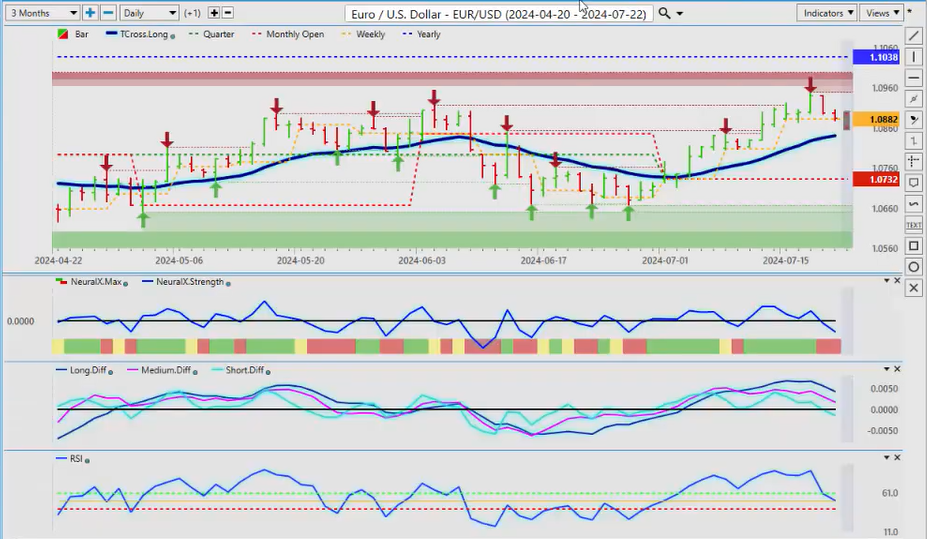
Now, when we look at the main Forex pairs, EUR/USD immediately reacting to the dollar moving higher, gold very strong in positive correlation between the Euro and gold. Both backed off, and you can see that the Euro fell at the same time. But I will point out, guys, the Euro has never been positive on the year. It’s been very good longs this last few weeks and several
times this year we’ve had good longs, but the primary trend is down. That’s just the reality of this. 11038 is the yearly opening price for this pair, and it simply was unable to break above it at any time during the calendar year. Now, the quarterly opening is important to us. We have good support at around 10732, so if we can get down to this area, that would be potentially a buying opportunity. But again, that dollar usually is strong in its fiscal fourth quarter, which ends again October 1st. I will keep repeating this, guys, so there’s no confusion around this. Very often that dollar, regardless of rate hikes, rate cuts, all these things, still tanks on October 1st. There are very few years where that has not happened. So right now, a retracement is likely. Our immediate target is the T cross long at 10841, but between 10841 and 10732, I believe that there’s a reasonable long trade there still. We just need to let it push down a little bit lower as the market, as the bigger players start buying dollars in the month of September.
U.S. Dollar versus Swiss Franc
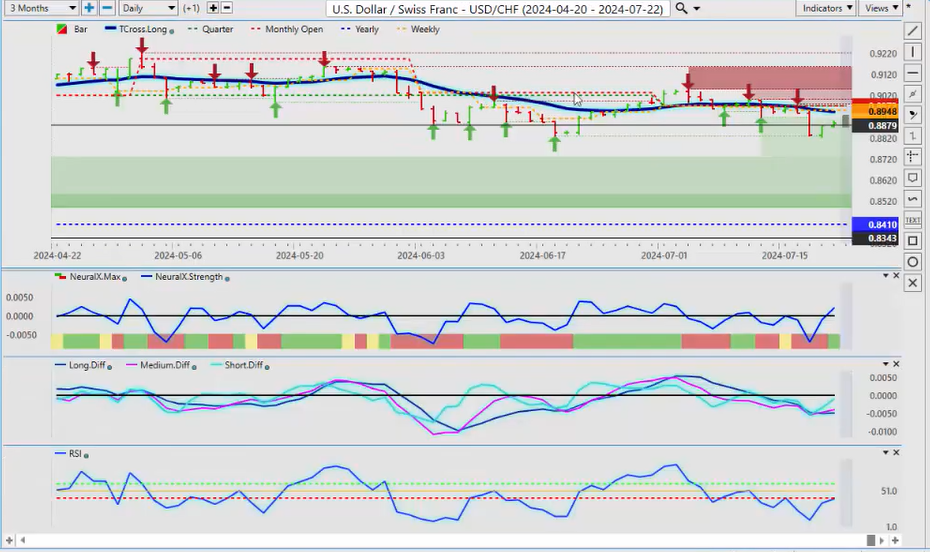
Now, USD/CHF slightly responding positively to this, but as you can see, we may have a double bottom forming here at the low 8827. But regardless of dollar strength, most of your bigger players are moving into the Swiss franc, not the yen, not the dollar. So right now, there is an MA diff cross suggesting further dollar strength against the Swiss franc, but that would be a retracement to 8942. Longs are reasonable, just know your levels, guys. 8942, excuse me, and then the quarterly opening at 8972, that’s where our immediate resistance comes in for next week. If we break above that, then we’re likely going to see that dollar strength form going into mid-August and into mid-September area, which is possible. But that would still be a corrective move with the dollar ultimately moving lower in October.
British Pound versus U.S. Dollar
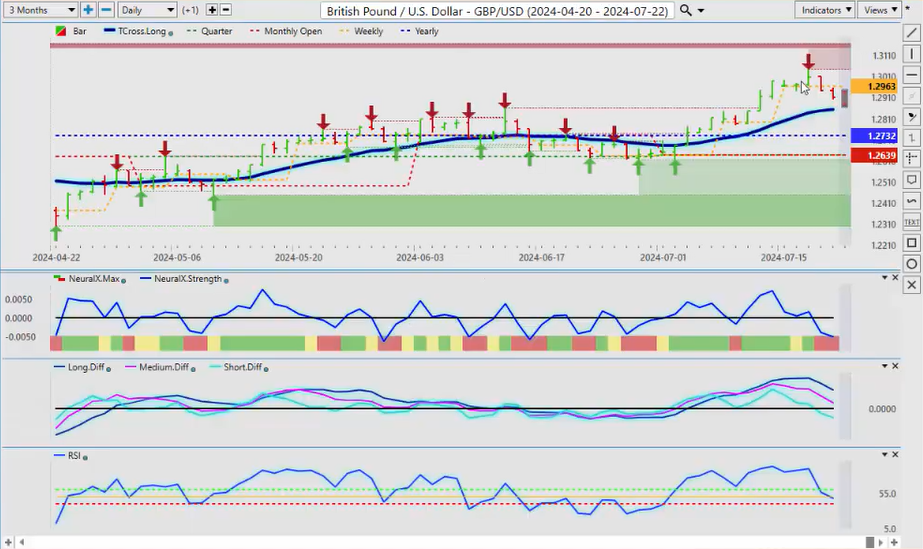
Now, GBP/USD had a very strong run this past week, as did the Euro, but the pound was much stronger. So, we’ve put a top in up here for now. That’s 13044, that’s our immediate resistance. And then you can see we have stacked support with our quarterly opening down to 12639, our yearly opening at 12732. This is very, very powerful support down here. The T cross long, as you can see, as we crossed the yearly opening and cleared, we actually never went below the current quarterly opening, not for very long anyway, first day or two, and then we’ve extended higher. So, I believe we have more downside momentum coming on this pair, and again, we would monitor that. But the first downside target, which is likely to be hit early next week, would be 12854, the T cross long. We can then reassess to the yearly opening price and the quarterly opening, but ultimately, buying near 12732 and 12639 is a reasonable play.
U.S. Dollar versus Japanese Yen
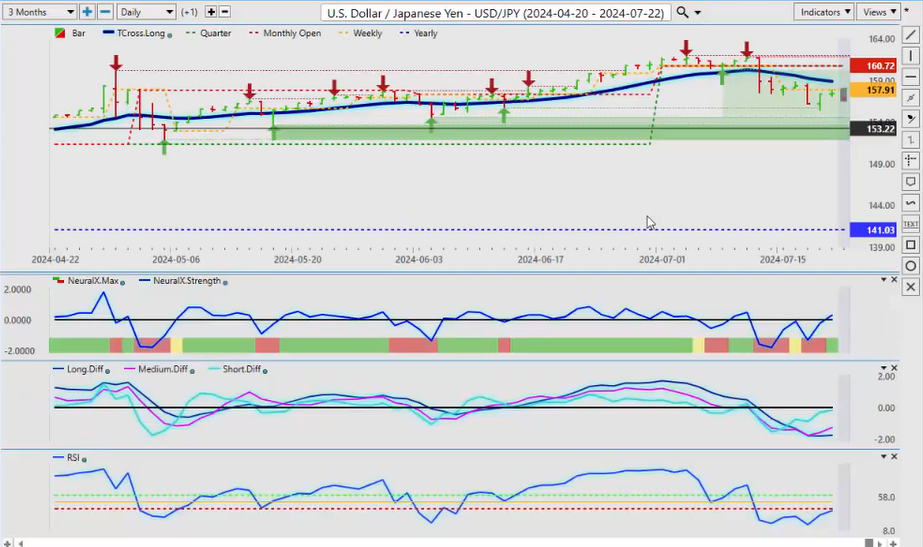
Now, USD/JPY is finally succumbing to the yen rebounding somewhat here, but we’re still at 157. The fear of intervention is still there, but right now the VP indicators, right or wrong, good, bad, or indifferent, intervention, no intervention, are saying that this pair is getting ready to go higher again. So once again, I would strongly advise to keep an eye on these critical levels. 10672 is the quarterly opening on this pair, and the T cross long at 15886. These are our retracement points, guys, but we are not buyers on this pair above 160 with pending dollar weakness coming in late September, early October. Okay, so we’ve got to make sure we understand where these levels are, and that fear of intervention from the Bank of Japan is still lingering. I don’t know if it’ll have much effect, but as the Fed starts to cut, the carry trade will come unwound. If the Fed ends up cutting three times this year, that should knock the dollar/yen back into the 130 area by year-end. We’ll see. That’s a big move, but remember it’s made an extremely big move to the upside at levels I’ve never seen before above 160. So again, I think we can buy up as long as we know where our upside targets are.
U.S. Dollar versus Canadian Dollar
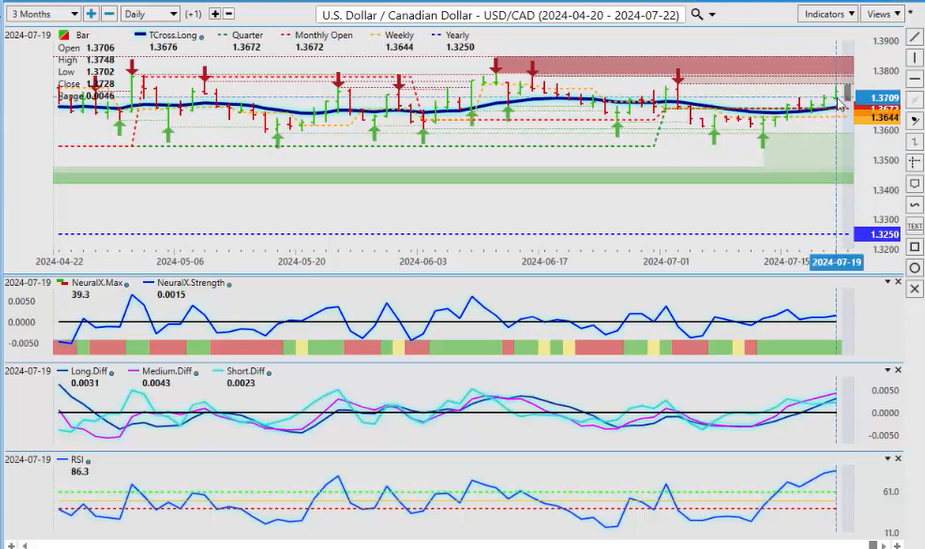
Now, the Canadian dollar is definitely under pressure here, and that is because of two things: the equity markets going lower, gold prices going lower, and oil prices going lower. All three of those correlate to the Canadian dollar. So right now, we’ve got some weakness. I think that it’s reasonable that we can move up towards the high around 138, where we would be sellers in anticipation of pending dollar weakness a month and a half from now, maybe two at the most. So, I don’t think we want to get too heavily long up here. The immediate resistance that we’re going to look at is going to come in at the high of 13755, then we have multiple verified resistance highs coming in at again right around this 13759 area, 13792. So the immediate one we’re looking at is 13755, excuse me, and I believe we’ll hit that early in the week. But always remember, I’ve discussed the Monday-Tuesday reversal in the VP live training room and throughout these seminars, or webinars, excuse me. A Monday-Tuesday reversal is very powerful on US/Canada, regardless of what the trend is, meaning if it goes screaming higher on Monday, it’s likely going to give up 50% of that on Tuesday. And if it goes screaming lower on Monday, it’s likely going to go considerably higher on Tuesday. This is something I play almost every single week, and it has a very high win rate. So be careful of this pair. The lesson there is to be careful of this pair, but the T cross long intersecting with that quarterly opening at 13672 is now becoming very formidable support here. So watch that level closely.
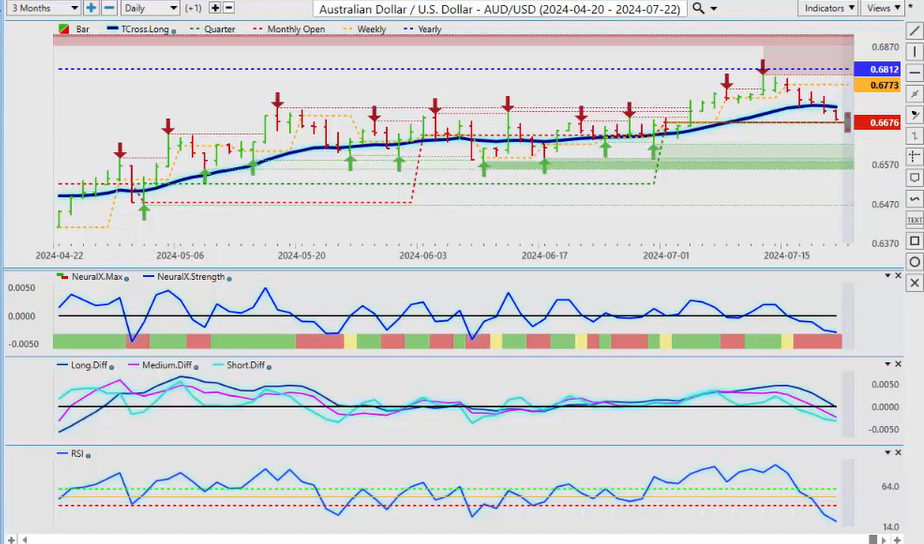
Australian Dollar versus U.S. Dollar
New Zealand Dollar versus U.S. Dollar
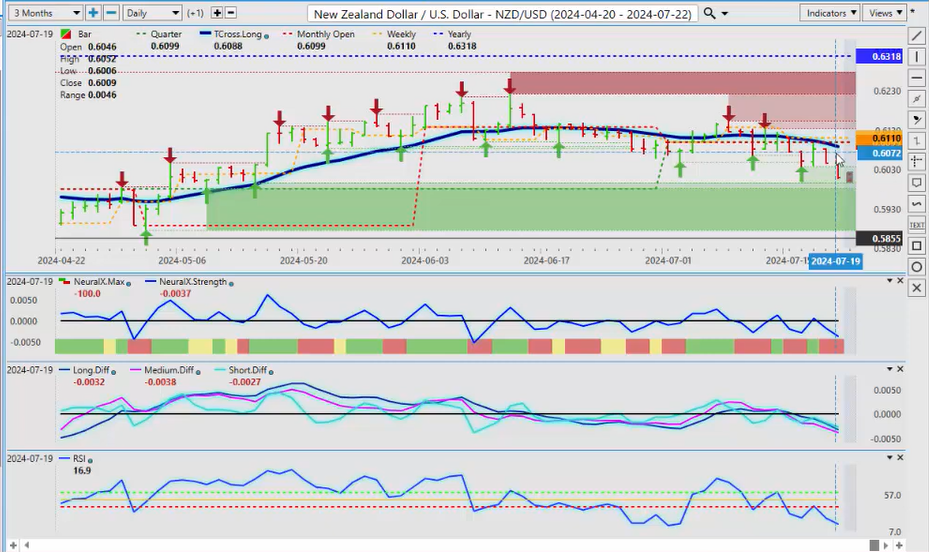
Now, with the AUD and the NZD, I am a firm believer in buying on dips on this pair, but they will both come under pressure from lower equities—the S&P, the DAX, those going lower. When they turn, the Aussie and the Kiwi will turn back up. That’s the intermarket correlation you want to keep your eyes on, guys, right now. So the Aussie dollar is coming down and approaching that quarterly opening, but the real thing we want to look at, guys, and this is a great demonstration, is the current yearly opening price is 6812 for the Aussie. The Aussie has never been above that level, and the second it got—well, no, actually that was 2023. So you can see the calendar year started, and this is the strongest retracement we’ve had. So on this pullback, again, the closer we get to mid-September, the more attractive longs on AUD/USD and NZD/USD are because, again, even if we look at the US dollar as a reserve currency, it’s been declining as a reserve currency, and they’ve been actually—the powers that be—have been buying the Canadian dollar, the Aussie dollar, the Korean won, the Chinese currency. It’s very interesting. So there is a lot of value in buying these pairs if you’re a long-term trader. But if you want to wait a little bit longer, then I can almost say to a degree of certainty, about 80%, that the AUD/USD and NZD/USD go up by late September into October, November, and December. It’s a standard play based on dollar weakness. So right now, that is our key level 6676. If we break down below that and stay below that, then we are likely going to return into the lower 65 area, but that would be probably short-lived. I anticipate it to stabilize. The same with the Kiwi, guys, almost identical. You can see that we’re failing along. The Kiwi is clearly the weaker of these two, hence the AUD/NZD, which I’ve shown on here in the past. When we look at the AUD/NZD, again, I think there’s better value in buying NZD/USD than there is in AUD/USD, but that is often dictated by this cross, this extremely useful cross pair, AUD/NZD. So we have a lighter docket with data next week, but with that, there’ll still come opportunities.
So, with that said, this is the Vantage Point AI Market Outlook for the week of July 22nd, 2024.


