


Welcome to the Artificial Intelligence Outlook for Forex trading.
VIDEO TRANSCRIPT
Okay, hello everyone, and welcome back! My name is Greg Firman, and this is the Vantage Point AI Market Outlook for the week of July 29th, 2024.
U.S. Dollar Index
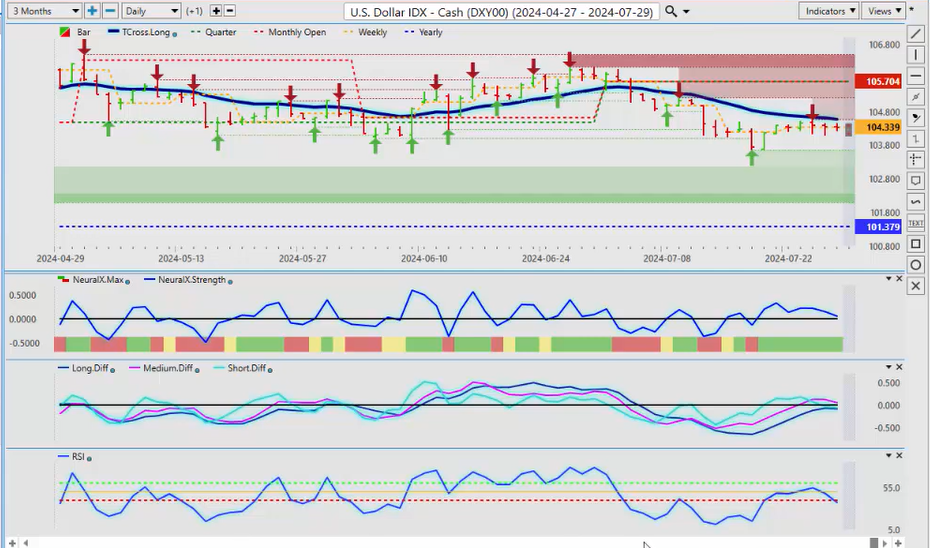
Now, to get started this week, we’ll begin where we always do with that very important US Dollar Index. Now, what we can assess here is the Dollar Index holding below its current quarterly opening price, which I’ve discussed since July 1st, at 105.70. Our T-cross long, which is our main level to determine what is bullish and what is bearish, is not determined by the neural index or some of the other indicators we use. Our core—quarterly, weekly, monthly, and yearly opening price—now the Dollar is still above its yearly opening price, but as you can see, we’ve been very negative in the first part of the quarter, so again, of the third quarter, excuse me. But always remember, this is the fiscal fourth quarter for the US. Usually, the Dollar is strong in the month of September and then we move into that strong seasonal pattern of weakness from mid to late September into early January. But the indicators right now, uh, the move higher this past week, we’ve hit into that T-cross long, our main defining point in the software. We failed; the indicators are warning that we’ve got downside coming again. The predicted RSI basically showing we have momentum building. Now a very heavy, uh, fundamental trading week coming up. We’ve got the Fed—all eyes are going to be on the Fed. Uh, it’s very unlikely that he’s going to cut in July, but I’m pretty sure he’s going to signal multiple cuts are coming following the Bank of Canada, the ECB, and some of the Swiss Bank. Again, following that same, uh, pattern of the other central banks. So right now, I would respectfully submit the Dollar is likely to come under some pressure during that Fed meeting, uh, later this week.
S&P 500 Index
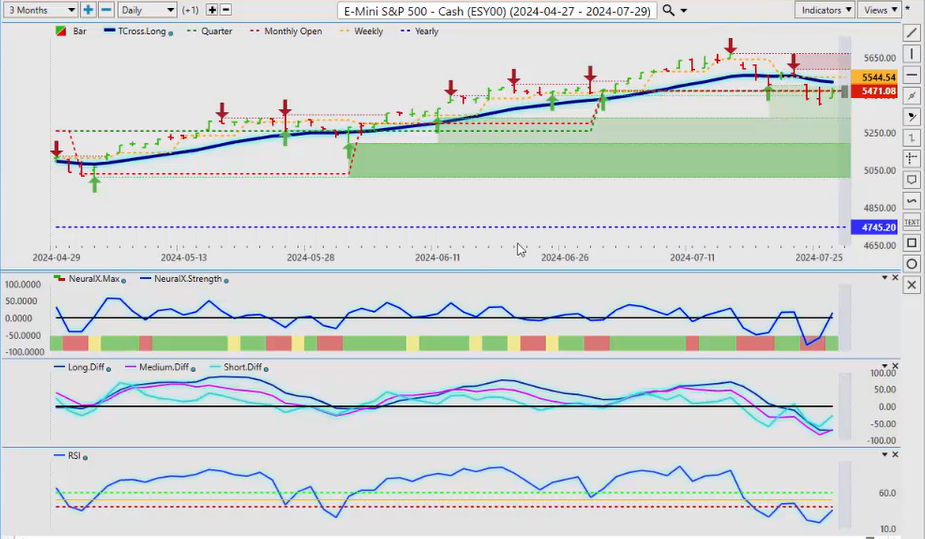
Now, when we look at the equity markets here, now just to clarify, uh, some of the main tools in the Vantage Point software, uh, Vantage Point actually started to forecast the stocks were turning lower on July the 16th.
Now, the neural index is a very short-term indicator, one to three days tops at best. I use it as a daily, uh, tool actually, and as you can see as the market fell on the equity markets, the Ma diff cross took place over here. Now we’ve crossed over the quarterly opening, but we’re not staying below it. So once again, the same thing that warned us of this weakness in the equity market is now pointing towards some strength. The pink line crossing over the blue line or the the Ma diff cross is a classic reversal tool, but again, the neural index, in my respectful opinion, only should be used more specifically with the T-cross long so you always know that way you’ll always know where you are in the current trend. We’re under the T-cross long, uh, so this past week V Point had has not forecasted a strong stock market this past week, but next week is starting to look better if that Ma diff cross can complete, but we must get above the T-cross long at 5517 for any long trade to actually work in this particular setup.
Light Sweet Crude Oil
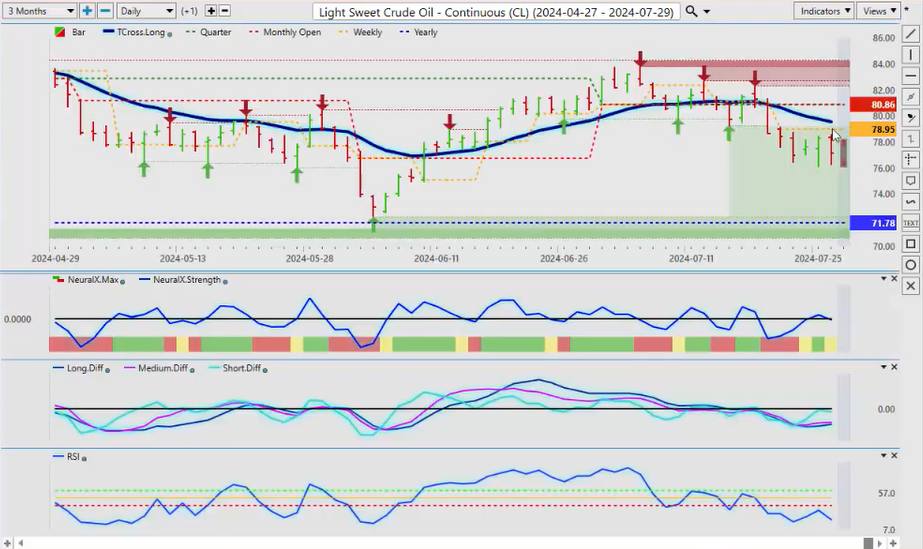
Now when we look at Light Sweet Crude going into next week, still under pressure here. The normal seasonal pattern would be oil down into August and Natural Gas starting to move higher, uh, but right now we do have that Ma diff cross, but this would be a corrective move higher guys, back to our T-cross long, that’s at 79.54. Now, we can further assess using that current quarterly opening price that Oil has been bearish this for about the last few weeks, or I would argue the better part of the start of the third quarter on July 1st. But there was some buying up here, and then we started to lose that level of the quarterly opening. We broke down below the T-cross long, and at that time, the neural index remained negative for multiple days. Now, if you have a green neural index, that just means we’re correcting higher on that particular day or maybe a day or two out, but it doesn’t, it is not a trend-defining indicator, so to speak. The T-cross long is, or quarterly opening, are yearly opening, the additional Ma diff cross. All of these additional tools need to be factored in because, again, the way the way we want to make sure we’re looking at that is what is the the the current trend in Oil. We look at the seasonal pattern; usually, Oil starts to get softer the closer we get to August and September. So right now, uh, a corrective move to 79.54 is reasonable.
Gold
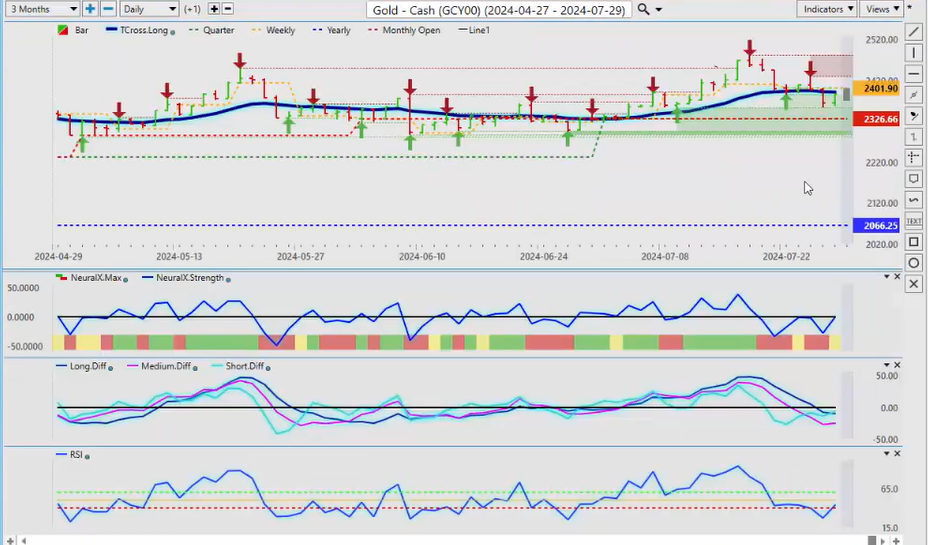
Now, when we look at Gold Contracts here, now Gold may get a boost this coming week. We’re still positive on the quarter, 23.26. Once again, 20.66 is our yearly opening price, but we really want to hold above 23.66 and get back above our T-cross long at 23.91. Now, in most cases, Gold remains soft until after October 1st and then it slowly starts making gains into year-end. That could come earlier this year if the Fed does signal multiple cuts. So we’ll watch, watch this, but right now we have that infamous reverse check mark down here, which is warning that we’re going to start pushing higher. So again, it’s not so much what the Fed does on Wednesday. We, the highest probability, is that he does nothing, but it’s the press conference you want to watch to see what his plan is going forward. The dot plan, all that stuff is relevant. It’s pretty much baked in that he’s not going to cut, but I will lay out the scenario that it’s possible that he will succumb to the pressure of the recent data, and he does cut, and that would be very, very positive for Gold.
Bitcoin
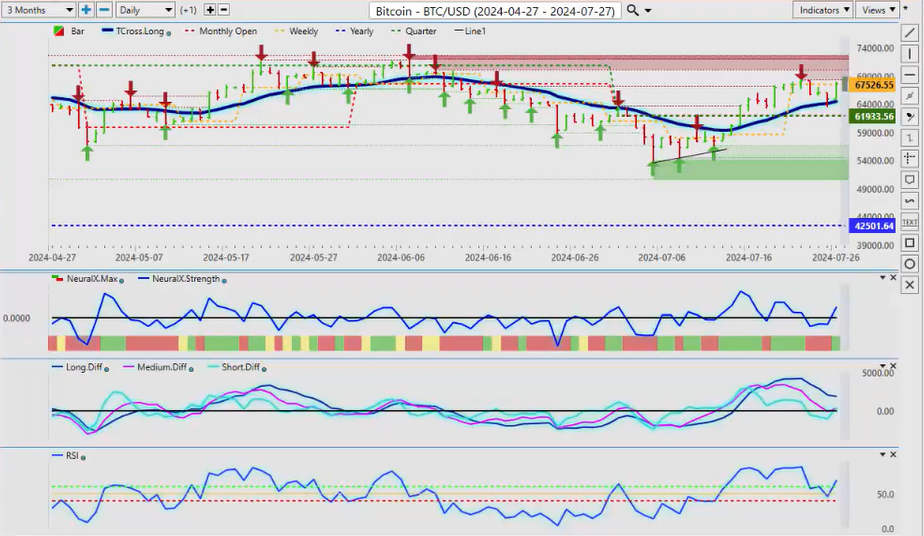
Now, when we look at the, uh, main Bitcoin Contracts again, uh, the one thing we really have to do, guys, with Bitcoin is just ignore the media. They’re, they seem to be ADD or something. I don’t know what it is, guys, but they just, they’re constantly negative on Bitcoin. Bitcoin has had a phenomenal year last year, up 155%; it’s done very well again this year, and we are likely going to extend higher, but that probably won’t be until mid-October. But for now, we are holding above our T-cross long, 64,0439 is the main, uh, line in the sand. But once again, when we look at these corrective moves down here, when the neural index goes red, then that’s a higher risk trade because we’re above the T-cross long. And always remember, guys, this is an outlook, not a recap of something that’s already happened. So I give these levels each week, but it’s very important to use our inner market correlations and to further use or combine the core Vantage Point indicators. We do not only just look at the neural index or one indicator; we always combine as many of the predicted indicators as we can to get a bias, but the core for me is the T-cross long. So you can see Bitcoin retraced to that on Thursday and then rallied off the same level on Friday. So right now, Bitcoin is looking pretty good; we’re above our quarterly opening price here at 61,933, but the T-cross long, that’s also a big area to keep your eye on going into next week’s trading.
DAX
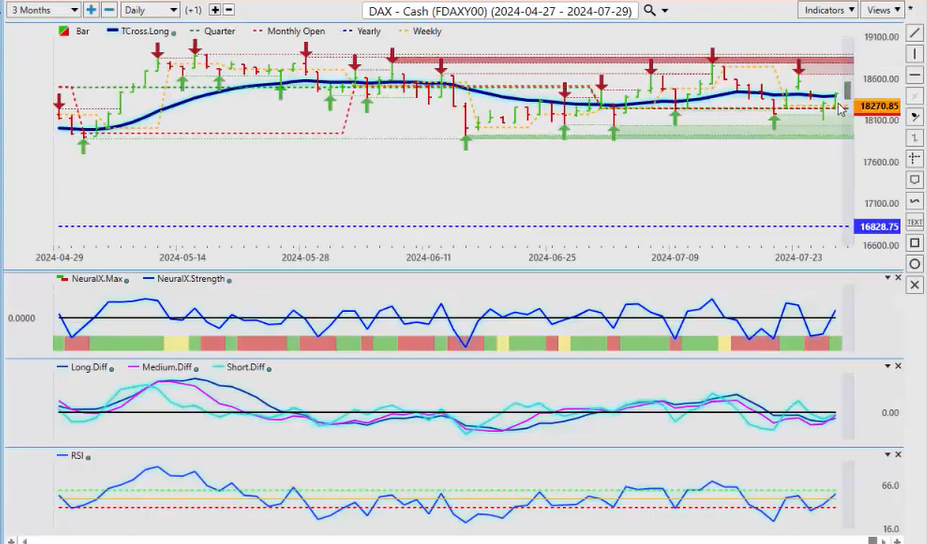
Now, when we look at some of the European uh, Equity markets, I usually do the Dax for my friends in Germany. So when we look at the Dax here, you can see that this chart mirrors the S&P 500, and I would argue it’s slightly more bullish. We have an Ma diff cross that has taken place to the upside; we’re holding above our quarterly opening, so it looks good for the Dax to move higher. But make no mistake, the Dax will follow the S&P 500, the NASDAQ; they’re, they’re very highly correlated. So what if we’re talking about this coming week, potentially buying equities?
Volatility Index ($VIX)
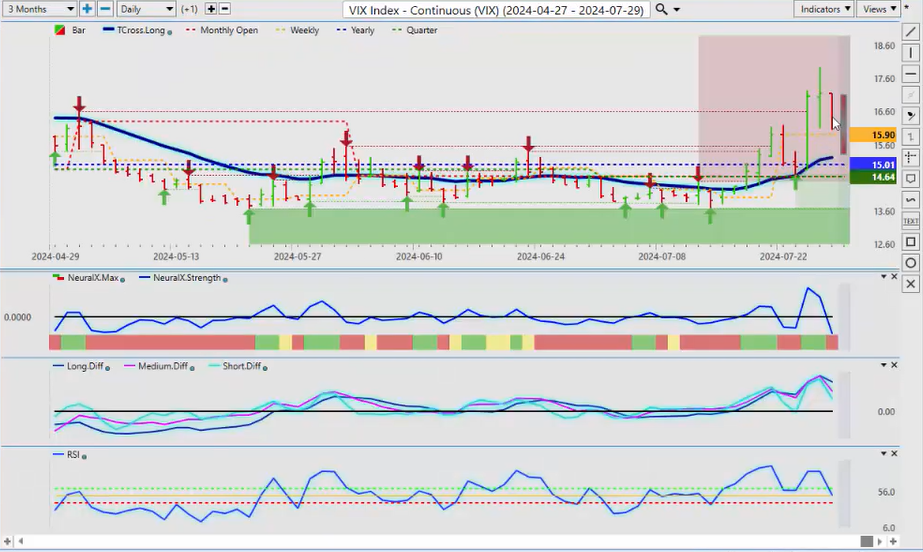
We want to make sure we’re looking at the Vix, because I talked about the, the Vix, excuse me, several weeks ago and warned that if we break above that yearly opening price, then the equity markets are going to have a problem. And that’s right at the time that we got the Ma diff cross on the S&P 500 around July the 16th. So I just wanted to clarify that point, that, Vantage point was actually forecasting stocks to go lower over the last, uh, I would argue, over the last week and a half, almost two weeks. But for now, the Vix has a very clear sell signal. The Ma diff cross, the medium-term diff over the long-term diff, is warning us that the Vix is getting ready to drop. So again, this being an outlook, not a recap of something that’s already taken place, we can prepare for that. The volatility will be the non-farm payroll number and, of course, the **Fed**, which will be coming on Wednesday.
Euro versus U.S. Dollar
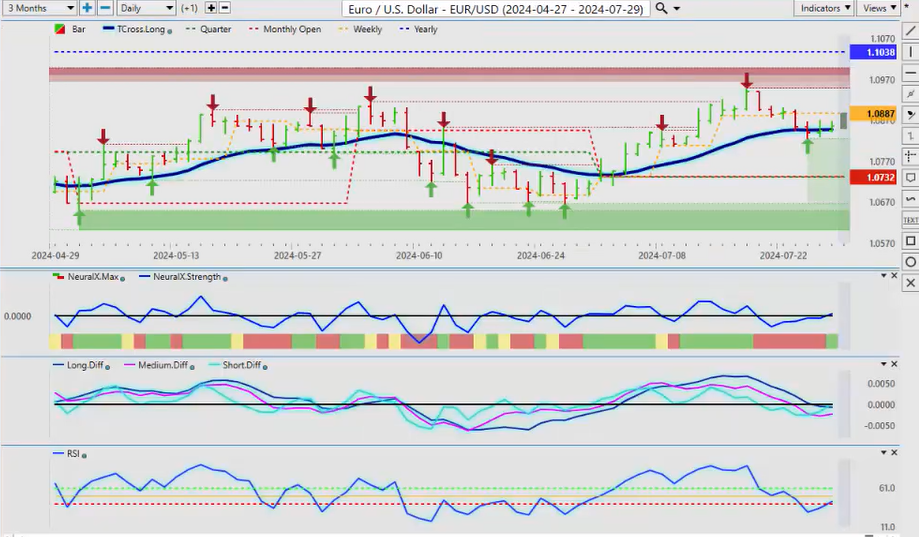
Now, when we look at some of our main *Forex* pairs again, we could have a decent week coming up here, with some Dollar selling. It all depends on what we get, uh, what the outlook for the Fed is going to be. So the main, the first thing we want to look at would be the Euro-US pair because that is the highest inverse correlation to the Dollar Index. So right now, you can see that the Euro is slowly starting to rebound. So our T-cross long 108.49, the indicators in VP are slowly grinding higher, the neural index strength. But remember, guys, that’s a short-term indicator; we must combine that neural index with a longer-term predicted moving average, or even a medium-term predicted moving average like the T cross long. So if we click on the f8, you can see that every single day it’s banging into this level. So if we can break above 108.63, the Euro could continue its advance towards the 110.38 area. And some, but not all, of the predicted indicators are in agreement on that.
U.S. Dollar versus Swiss Franc
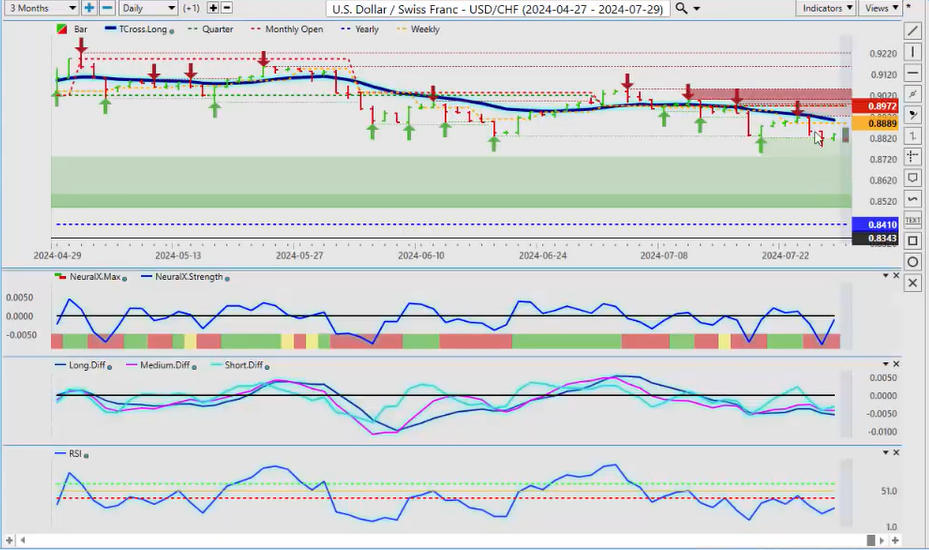
Now, the US-Swiss Franc again, still under pressure, even with, uh, some Dollar strength this past week. Shorts, I believe, are the, the best play here while below 89.72, and the T cross long at 89.05. But it will be volatile next week, uh, you can pretty much bank on that. But the indicators very much flat or neutral, not a lot of activity on this particular pair.
British Pound versus U.S. Dollar
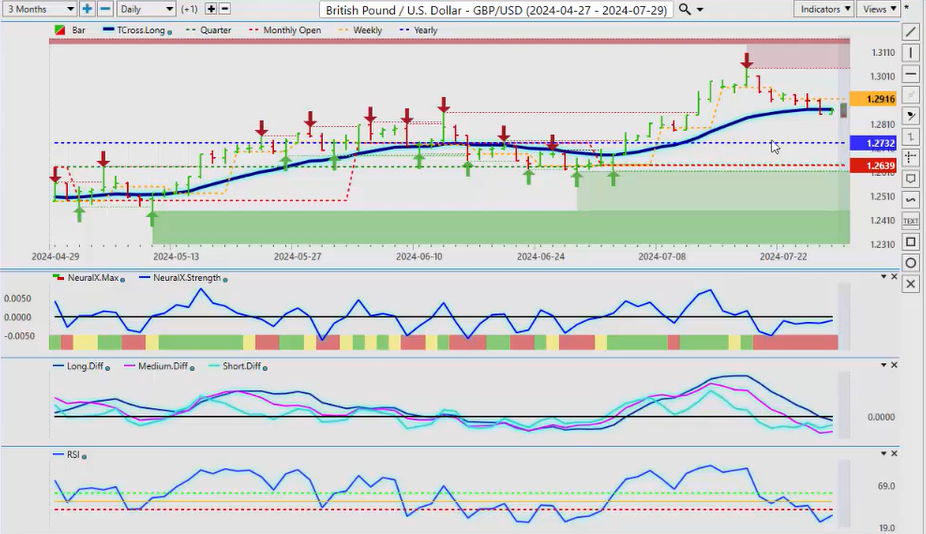
But the Pound-Dollar did see quite a bit of activity. So we’re right coming into that sweet spot of the buy zone here. You can see how the quarterly opening, the yearly opening price, they’re all stacked in here together. So again, even if we break down below 128.72, our T-cross long, our additional buy areas would be down to 126.39. The indicators, we just need them turning over, uh, is what we really need, because as you can see, the predicted differences across the zero line, that is definitely a problem. So but if we can get them turning back up, we’ve got again, another reverse check mark on that predicted RSI is warning that that is possible. So a very dovish Fed should easily send this pair higher, but be careful of the non-farm payroll number, also on Friday.
U.S. Dollar versus Japanese Yen
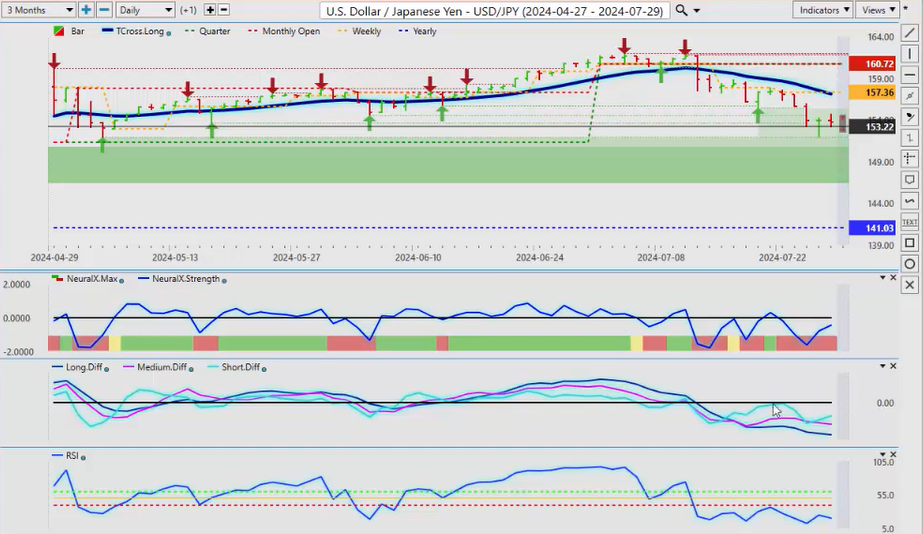
Now, with the US-Japan for next week, again, uh, you can see that we’ve got a little bit of support down here at the low 153.12. It’s, uh, as the interest rate differential changes between the Bank of Japan and the Federal Reserve, it somewhat favors the Yen, but again, it’s the Dollar is still a high yielder, even with the Fed cuts, and Japan is still basically negative rates here. So the indicators right now, pretty much running flat, uh, not looking overly dovish or, or excuse me, not looking overly bearish or hawkish, just kind of flat. Potential retracement back to the T cross, this this week prior to the Fed announcement, then we are likely to start moving grinding again.
U.S. Dollar versus Canadian Dollar
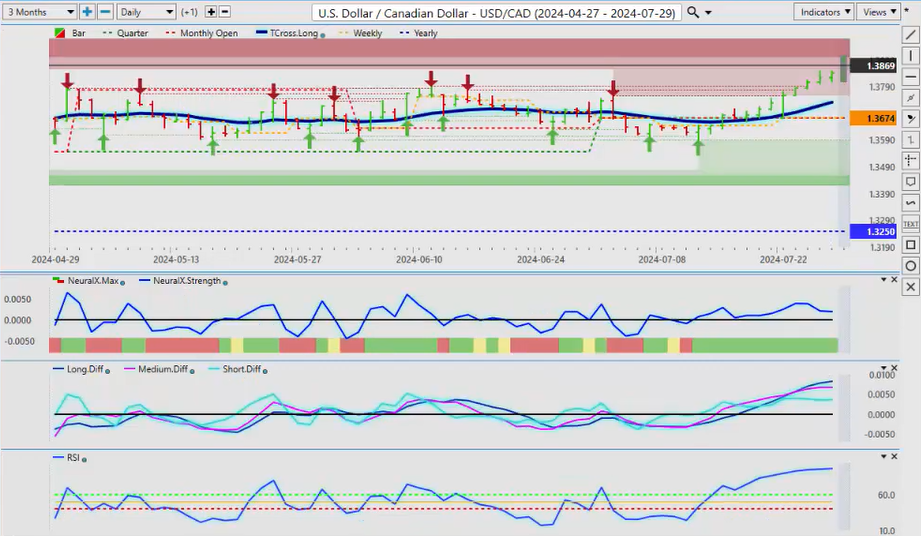
Now, the next three currency pairs that I’m going to show you guys are, basically, uh, believe it or not, are an equity trade. And what I mean by that is that these pairs feed off the S&P 500. The odd but more specifically the, the individual currencies, the New Zealand, the Kiwi, and the Canadian Dollar, are all very susceptible to movements in the equity markets, more specifically the S&P.
So if the S&P 500 turns next week to the upside, this will push US-Canada back down. I believe that that is what will happen because again, this is an outlook, not a recap of something that’s already happened. We’re looking at trading levels while the markets are actually closed before they’ve even opened on Sunday night. So right now, I anticipate we can potentially get a retracement back down to 137.33. And if we can break that level and the quarterly opening, I believe by year-end, we could target the 132.50 area. But for next week, that’s what we’re looking for. Um, there is substantial resistance above 138 on this particular pair. The indicators, right there, there is an MA diff cross, again, right there. You have a long period of a green neural index. So if you’re using the neural index, you’re using it with the T-cross long. And you can see, as long as we’re hanging closing above that TR cross long, the neural index is green; we continue to buy. Okay, now, I could say that for, for uh, Monday’s trading, and I believe it will go up a little bit, but I also believe it will move lower on Tuesday and Wednesday, and that Ma diff cross is telling me that the medium-term trend against the longer-term trend is actually weakening.
Australian Dollar versus U.S. Dollar
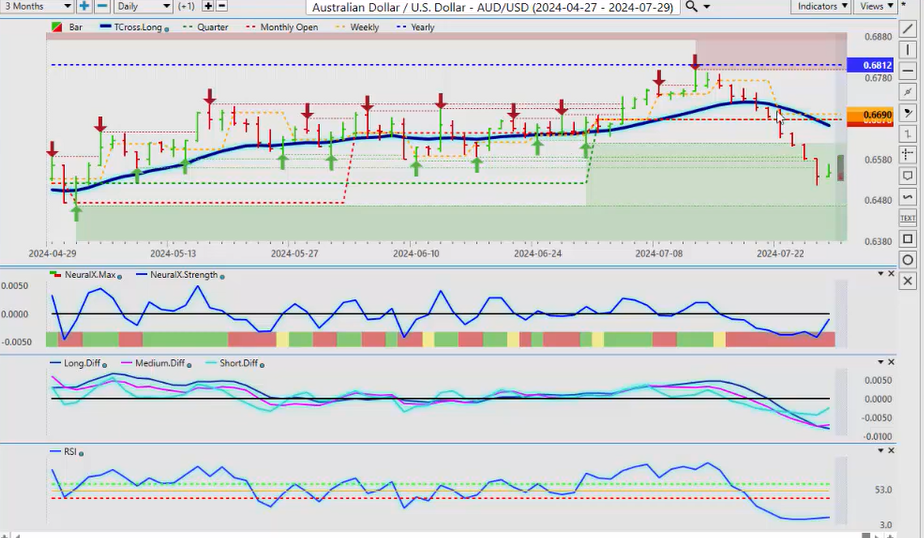
So maybe some good opportunity for the Forex traders, but make no mistake, guys, if US-Canada moves lower, Aussie-US will move higher. Now, it’s taken a beating this last week, mainly because of that selloff that was that Vantage Point did forecast ahead of time, that selloff in the equity markets, uh, the, you can see the Aussie responded the same way as the Canadian Dollar, but the Aussie is the base currency, US-Canada the US Dollar is the base currency, and Canada is the quote currency. So it’s the same trade, just inverse. So again, if US, if the equity markets rebound, which I believe they will on the Fed, then Aussie could be a very good buying opportunity down here, after this, after they flushed the markets out. But we also want to take note the importance of the yearly opening price because that’s where this all failed right along here. You can see, 3 days in a row, it stalled just below the 2024 yearly opening price, a very powerful non-indicator. Then we combine that with the VP indicators, right there, just like on the S&P 500, warned us that this was going to move lower. It turned down, but now, the same signal that would have a short, this is now telling us we’re going higher, that pink line crossing the blue line.
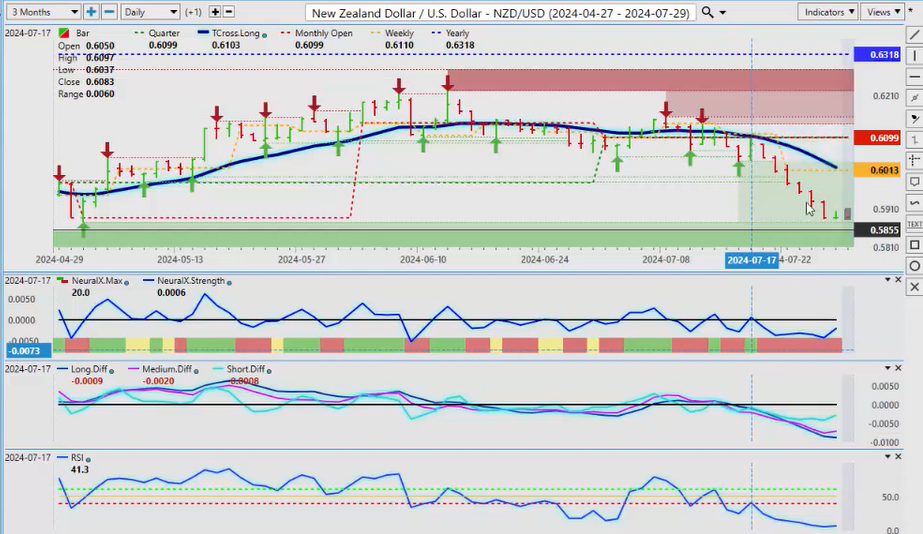
New Zealand Dollar versus U.S. Dollar
The Kiwi, same deal, guys. You can see that selloff, and now we’re starting to see the predicted differences rise. The predicted RSI, as you can see here, is extremely low, and this is why we don’t use overbought/oversold methodologies; we, we look for momentum with a break of the 40 level on the predicted RSI, that that is, and below the T-cross long. But you can see, we still have day-positive days with a green neural index, and we actually for one day did move higher, but then it immediately turned back to red. But the core thing that you want to remember here always measure the market, whether it’s above or below the T-cross long, to help filter out false signals and identify the primary trend. In this case, with Kiwi, we’re below the yearly, we’re below the quarterly, and the monthly, and we stayed below the weekly opening the entire week, guys. So that’s what we’re looking for in identifying using multiple predictive indicators. So, with that said, this is the Vantage Point AI Market Outlook for the week of July the 29th, 2024.


