


Welcome to the Artificial Intelligence Outlook for Forex trading.
VIDEO TRANSCRIPT
US Dollar Index
Okay, hello everyone, and welcome back. My name is Greg Firman, and this is the Vantage Point AI Market Outlook for the week of March 10th, 2025. Now, to get started this week, we’re going to do things a little bit differently here. With the extreme volatility in the markets, I think it warrants a cross-reference or a check on our intermarket correlations because the known correlations we’ve seen over the last 10-15 years are definitely breaking down. We’re actually seeing the S&P 500 and some of the other indices positively correlated to the dollar Index. So what I’ve got here this week is a split screen using the US dollar Index as our main focal point.
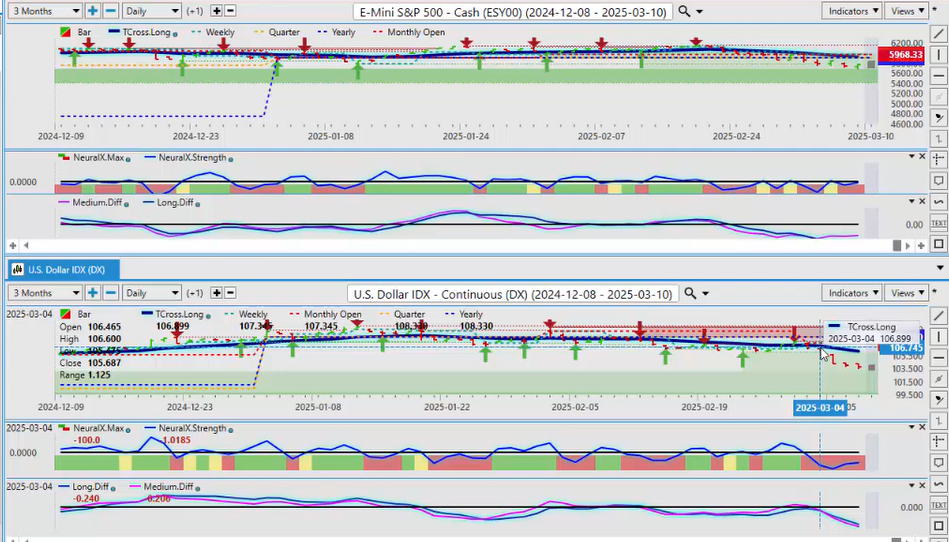
We can see the dollar is under significant selling pressure, with Trump flip-flopping on these tariffs all over the place—one minute they’re on, the next minute they’re off. It’s wrecking havoc in the markets. I think things will settle down, but we want to look closer at this. Now, the neural index, I have the neural index and the medium-term and long-term predicted difference, one of the most powerful reversal indicators in the VP software. So, our neural index, after another down day, a very mediocre labor report, the neural index is starting to rise off of the bottom here.
Now, it’s been a considerable period of time since I’ve seen the neural index down this low. So, what this is telling me is the potential for things to turn around next week. But again, in most cases, the dollar is not strong the week after the non-farm payroll number, and this particular payroll number was not good either. We have our known period of dollar strength at the end of the month. We got about three or four days on that dollar strength, and then it just tanked with the Tariff news. So right now, our T cross long, that’s going to come in at about 10680 approximately. We can see that we’re closing out the week, excuse me, 10380. So, we’re closing the week at 10380, our T cross long coming in about 10680. So, that’s our retracement point.
S&P 500 Index
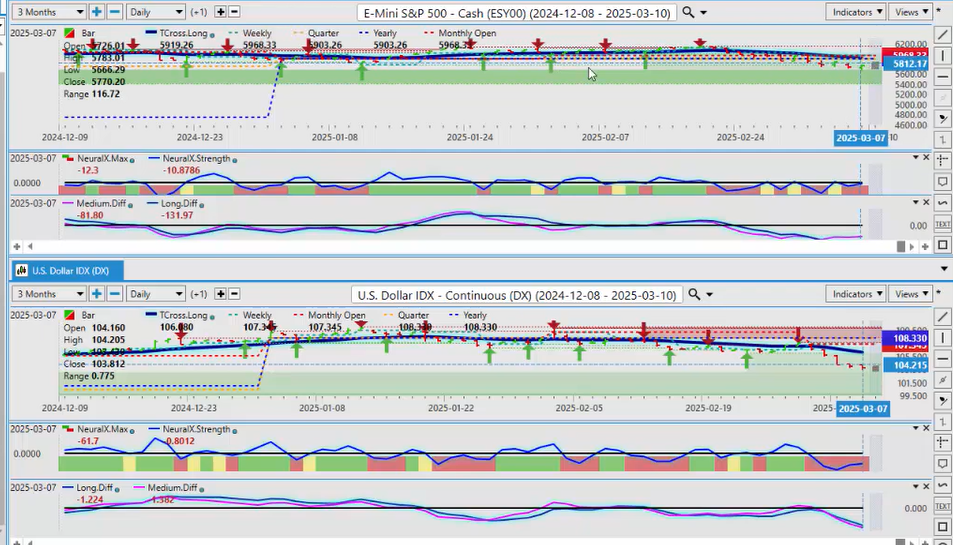
Now again, when we look at a comparative analysis to the S&P 500, we’re also below our T cross long, and I will further add, we’re below the monthly and the yearly opening price on both the main index and the dollar Index. This is not something I’ve seen for many, many years, and that’s the kind of havoc and volatility that these tariffs are causing.
Now, when I look at this right now, I can see that our medium-term and long-term predicted difference are beginning to rise, suggesting that there is still the potential for the equity markets to rise—that’s the pink line over the blue line. We’ve got a rising neural index strength, but we can see the dollar Index, the neural index strength, excuse me, on the dollar Index, it too is rising, but clearly the US Equity markets are being affected by the tariffs, the talk of tariffs, the tariffs are on, the tariffs are off, flip-flopping constantly, and now it looks like we’re going to deal with it for another month, right until April the 2nd. But that pink line is saying that look, the equity markets may not, US Equity markets may be able to recover, so we’ll watch this at the beginning of the week, but to be clear, this would be a corrective move higher on both the US Stock markets and the dollar Index because we again, we’re below the yearly opening and the monthly opening price.
DAX
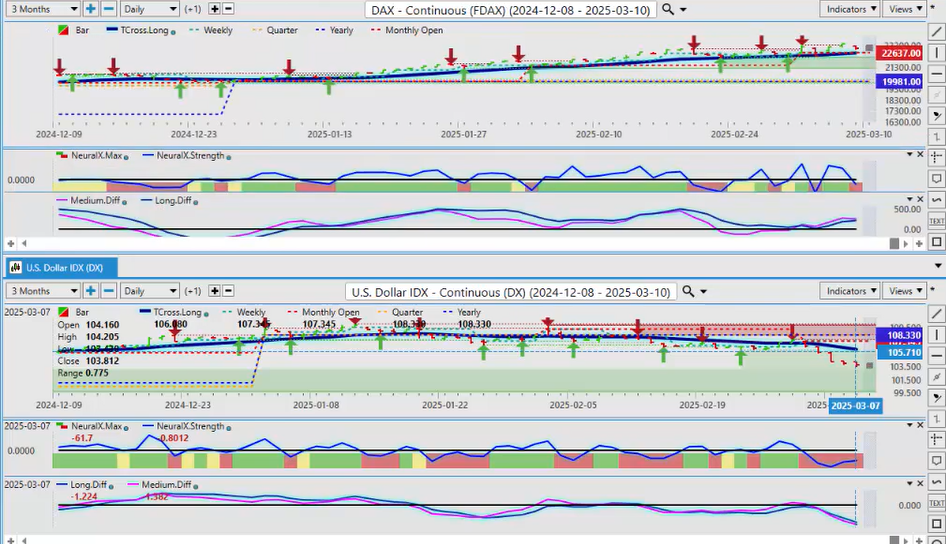
Now, if I look at the European Equity markets, as I stated last week, they are doing quite well based on the ECB cutting rates. And again, pushing the Dax, the Dax has had a very good week. I’ve kind of warned everybody to be careful about picking tops and bottoms in these types of markets. If they’re not going to go into the US markets, they’re going to go into the European Equity markets, and that’s exactly what they’ve been doing all week. Now, right now, we can see that there is the possibility of potentially, we may have a short-term top on the Dax. Our medium-term is trying to cross our long-term predicted difference. The neural index strength is actually moving down since Wednesday, so we’re crossing the zero line now, so there is that possibility, but let me be clear, the Dax has been bullish on the year, it remains bullish now. Now, we’re above our monthly opening, our yearly opening price. This is the polar opposite of what we normally, what I normally see. The global Equity markets are correlated to each other, the Dax, the S&P, the NASDAQ, the Nikkei, they’re all correlated together, but not now, and that’s what the kind of problems these tariffs are causing.
So right now, I think that the European Equity markets are the better place to be than the US until things calm down again. But it’s not showing a lot of strength up here, yes it’s toppy, but be careful about shorting a market where globally, Global Investors are looking for somewhere else potentially other than the US.
Nikkei
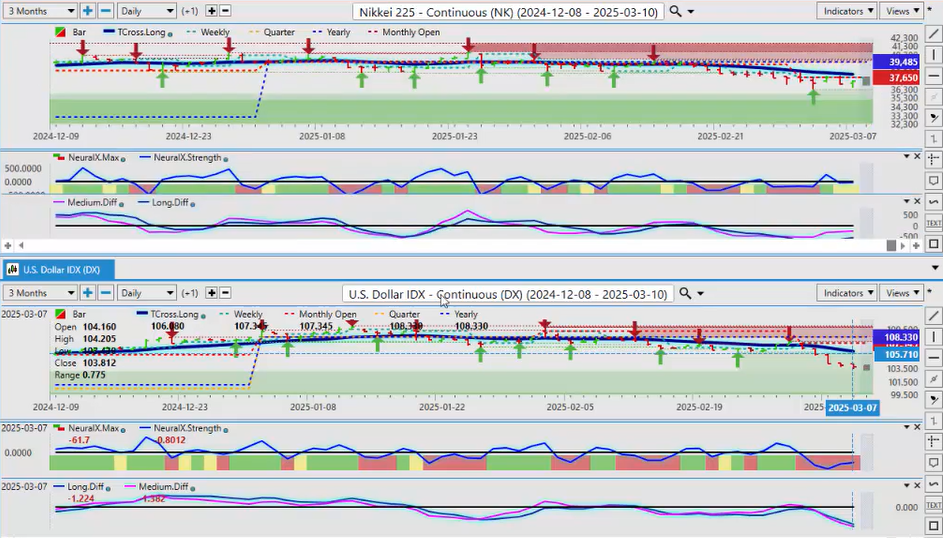
Now when I do a cross-reference on this to the Nikkei, again the Nikkei and the dollar Index once again too, are positively correlating to each other, both below the yearly opening price, but the Nikkei did put up a bit of a fight this last week. But going into next week, we can assess here that the reversal indicators on VP show up here too. The pink line, the medium-term strength to the downside, is weakening, so it’s saying, okay, maybe we can retrace, but we need the S&P 500 also moving up.
Light Sweet Crude Oil
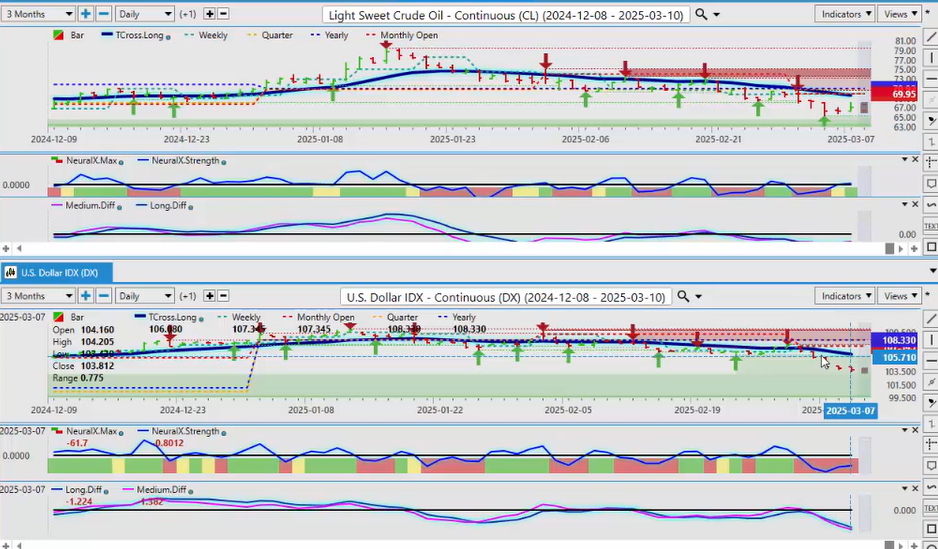
Now when we look at light Sweet crude oil with the dollar falling, we can see the positive correlation between, again guys, it’s not always about indicators, it’s about looking directly at inner Market correlations, and I’m going to do this with all the Forex pairs this week too, so we can see where we can sell dollars and where we can buy them. So again, when I’m looking at oil, it’s showing signs of a recovery. We, I think we may have a short-term bottom in here, 6522, the neural index again is rising, that’s definitely a positive. We can see we have an MA diff cross that’s forming, so this tells me potentially we may be able to form a bottom, and oil, Longs, or energy in general, well, that may pick up next week. So we want to make sure we’re looking at that, but always remember guys, this video is for educational purposes only and it’s for one week, it’s not a long-term or a short-term forecast, it’s for a week.
So right now, oil, our retracement point again would be the yearly opening, the monthly opening, the T cross long, everything is sitting between 6950 and 7092. If we can clear that level, then oil should be able to extend higher, but my optimism on that, at this particular time, remains heavily guarded until we get closer to the Summer driving season, May and June.
Gold
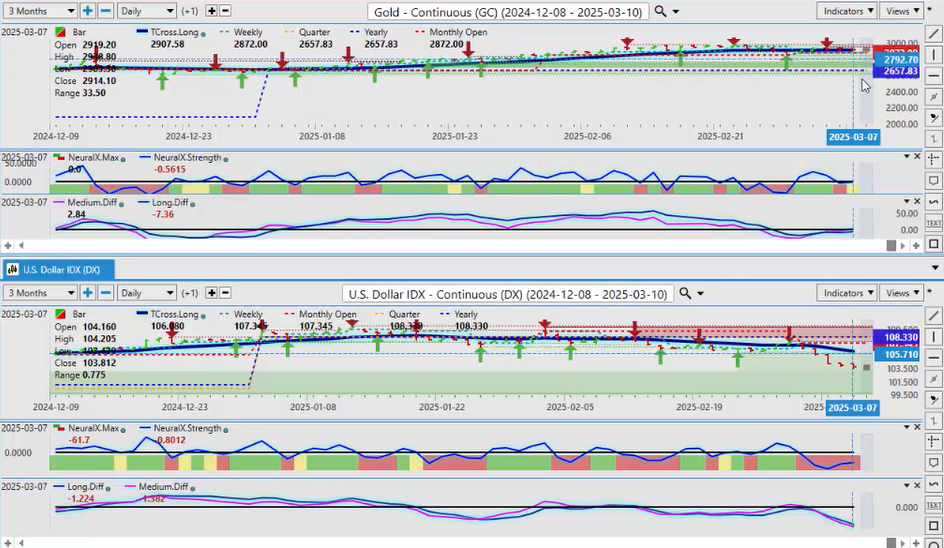
Now when we look at gold, the two markets that have bucked the trend this past week are Bitcoin and gold. They are holding firm. Now gold, definitely at this particular time, looks better than Bitcoin. We’re holding above the monthly and the yearly opening price. Our TR cross long, or our retracement point, 2907, so that area there is pretty big on the T cross long. If gold has any chance of extending higher this month, we need to hold above that. But either way, we would be buyers down to 2657, as long as that dollar remains under pressure. Let now the neural index, the neural index strength, really is dead sideways on gold right now, so it’s once again, that could be a warning sign of some pending dollar strength, so we’ll monitor gold in comparison to the inverse correlation between gold and the US dollar, but right now, Longs still ultimately favor gold in 2025.
Volatility Index

Now it wouldn’t be an Outlook without checking this VIX. Now again, the VIX has pushed considerably higher on the dollar weakness, the equity weakness, all of these things, but there is still a clear inverse correlation between the VIX and the dollar Index. So if that VIX drops, that would tell me that the dollar could see some buying next week. But again, not exactly the best environment, but we’ve had an MA diff cross for basically the last four trading days, and as you can see, we have a newly formed verified resistance high at $23. So again, uh, we’re not closing above that verified Zone on Friday, uh, is this a crack in the dam, and the VIX possibly, but it would be a retracement back to our TR cross long at 1942.
Bitcoin
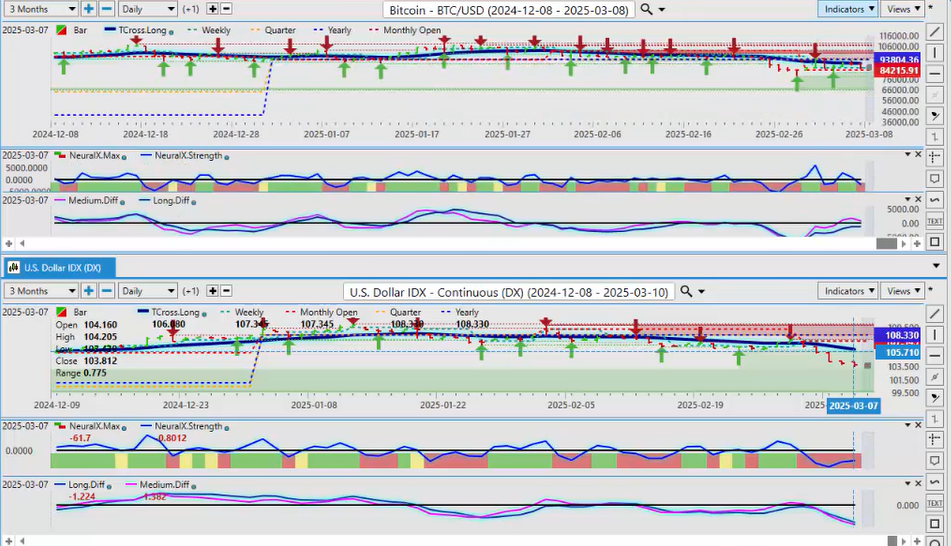
Now when we look at Bitcoin, uh, I remain on the bull side of Bitcoin, uh, at least for now. We are negative on the year, but again, Bitcoin has been hit with an awful lot over the last couple of weeks, the last, well, I would argue since mid-January, Bitcoin‘s been hit with a lot. We are below its yearly opening price at 93804. Yes, I would like to see us get back up above our T cross long and more specifically, the yearly opening price. Right now, yes, Bitcoin is in a short-term downtrend, that’s what we would call this, only because we’re below the calendar yearly opening price. We can’t say it’s bullish if it’s negative on the year. So again, if we can, if we can get above our VP T cross long at 90371, that will open the door to the current calendar yearly opening price at 90304. Uh, those would still remain our targets for this coming week because, again, this is an Outlook guys, not a recap of something that’s already happened. This is a forward-looking outlook for the next trading week. You can see that this Outlook is being done on Saturday, uh, Saturday morning be while the markets, the main markets, are closed. Now Bitcoin is open for trading, uh, I imagine it’s still under a little bit of pressure here, but we need real volume back in the markets Monday before we make any real decision on Bitcoin‘s next move.
Euro versus U.S. Dollar
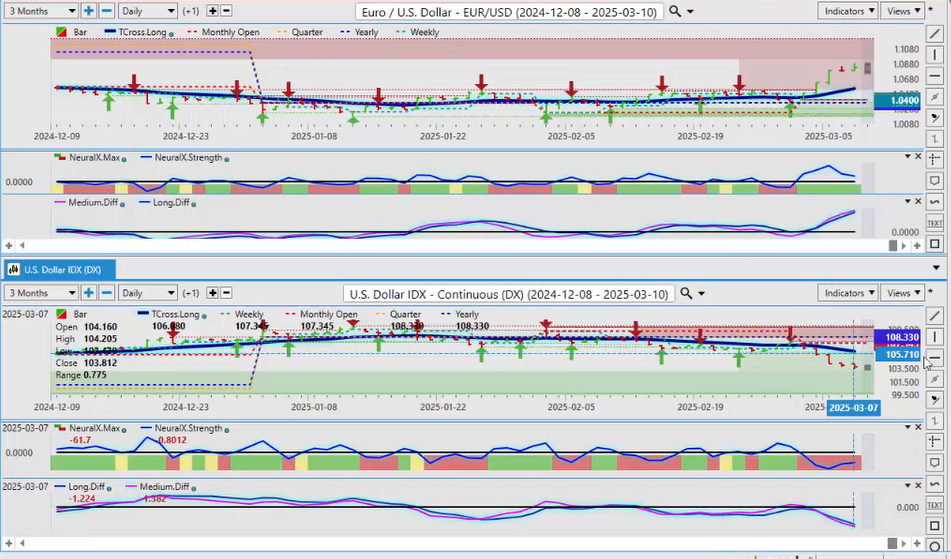
Now when we look at some of our main Forex pairs and how they’re responding to this dollar selloff, the biggest beneficiary of this is clearly the Euro. Now again, uh, with the ECB cutting rates and it’s questionable whether the FED is going to be cutting rates, the dynamic of this, one up, one down, doesn’t make a lot of sense here, uh, other than people moving out of the US Equity markets, out of the US dollar. So again, we’ll monitor this, but for now, what I can, what I can advise, is there is significant headwinds above 10850. That is the best thing I can tell you for now. That doesn’t mean it can’t go higher, but what we want to watch very closely this coming week is our reversal indicators. Now, as the euro is moving up, what I love about the neural index strength is it’s not moving up, it’s actually moving down. It’s that type of contrarian signal that I look for. So if I can get an MA diff cross, the pink line over the blue line, that would tell me that the resistance I have around this 10850, 10860 area, is likely going to hold, and the next move is a corrective move back to 10553. But be careful on Monday. I’ve talked, uh, I’ve talked quite a bit on these outlooks about the Monday Tuesday reversal.
We saw it in full display this past week. Now, it may not always happen to every pair, uh, but US Canada is the most notorious for this, uh, Monday Tuesday reversal, oil contracts, uh, a number, the dollar Index, a lot of these things happen on a week-over-week basis, even without this volatility. So again, we’re going to watch those reversal indicators, but I suspect that we will see some type of retracement on the Euro.
Now, the other thing we can use here also is we can click on, we know that that’s 10553, but the first predicted moving average, which is the long-term crossover, that’s coming in at 10693. Uh, that area there, I can tell you with a degree of certainty, we likely will hit that level, uh, by probably Tuesday, Wednesday, maybe even on Monday, if, if money starts to pour out of the Euro and says, oh, okay, wait a minute, uh, the dollar may not be as weak as we think it is, let’s power back some of our positions. Remember, in Forex, that if they’re long Euro US, and they close it, what do they do? They’re selling the Euro back, and they’re buying the dollar back. So always be mindful of that. So I think 107, at the very minimum, will be our retracement point, but watch for a big move up or down on Monday, and usually on Tuesday, it will go the opposite way.
U.S. Dollar versus Swiss Franc
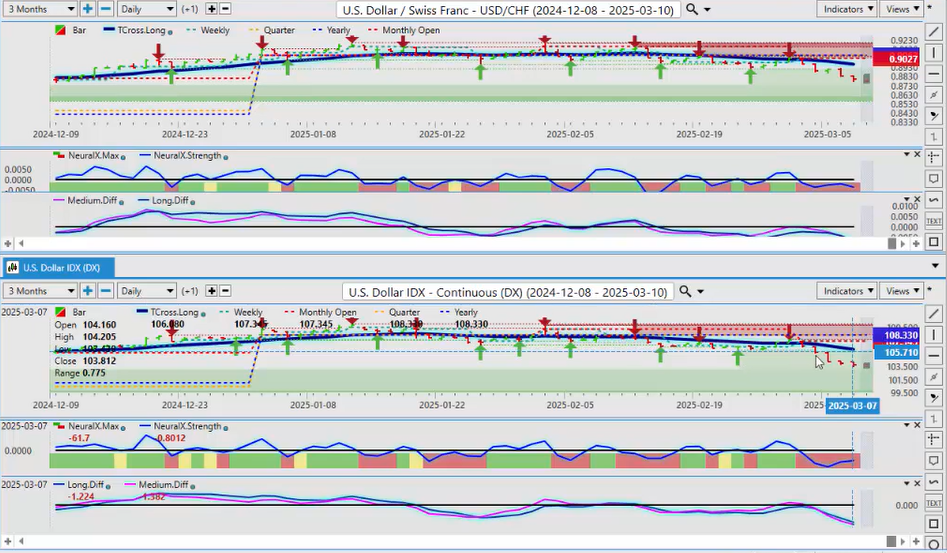
Now, when we look at the US Swiss Franc, again, in most cases, when the dollar is down, we can see in this particular chart setup for this week, with the split screen, we can verify the direct intermarket correlation between the dollar Index and the US Swiss franc. We can assess that we’re below the yearly and monthly opening price on both of these, so that’s bearish, but again, what we want to make sure that we’re watching in this coming week is any type of, uh, contrarian indicator like the neural index strength, the Maad diff cross, turning the opposite way in which the market is moving. So right now, the neural index strength is running just below the zero line, yes, it’s still bearish, but if that dollar Index, if this signal from the neural index strength on the dollar Index is picking up on something based on the correlation of 31 other markets in the software, then that tells me that the US Swiss frank too could reverse. So, keep a very close eye on this pair, but again, the one thing they all have in common is the US dollar, the G7 pairs.
British Dollar versus U.S. Dollar
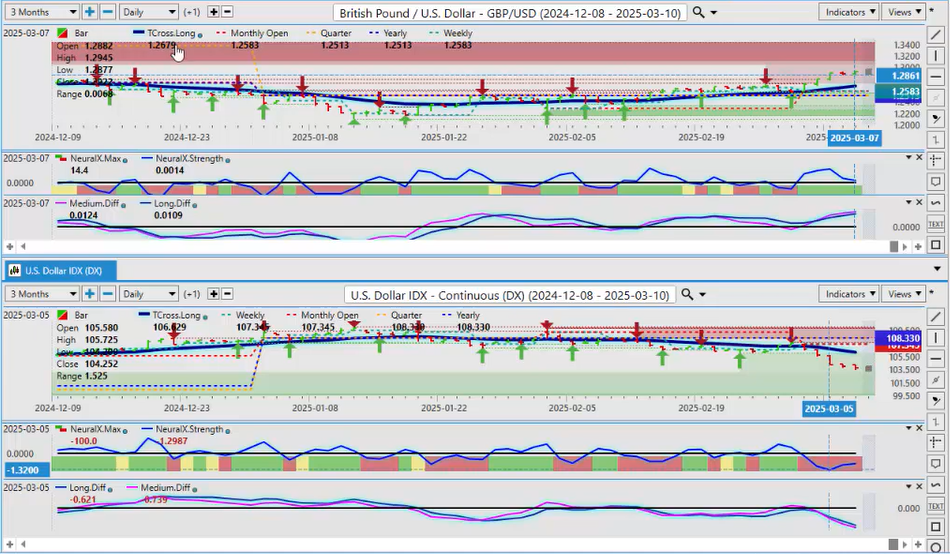
So the British US dollar, it’s advanced higher again, but as you can see, the neural index, the neural index is green, but the neural index strength is picking up on something else, actually since Wednesday. Great Britain is kind of stalled here, so again, guys, we’re looking for a retracement back to our T cross long, 12679, uh, the monthly opening price there, 12583, and of course, the yearly at 12513. We could easily move back down to that, guys, on any type of dollar strength, uh, this pound, this the pound dollar, is the most volatile of the G7 pairs, that much we know, uh, its average daily, uh, range is usually in the 120 pip range. So, uh, if we’re closing out, you know, up here in this, uh, 129 area, then 128, then it has could easily move down 200 Pips in a week. So we’ll monitor this for the coming week, but I wanted to use the split screen so we could see the direct in-market correlations with the core Vantage Point, uh, tools, the neural index, the neural index strength, and the ma diff cross, because this is what we’re looking for, guys, potential reversals.
U.S. Dolllar versus Japanese Yen
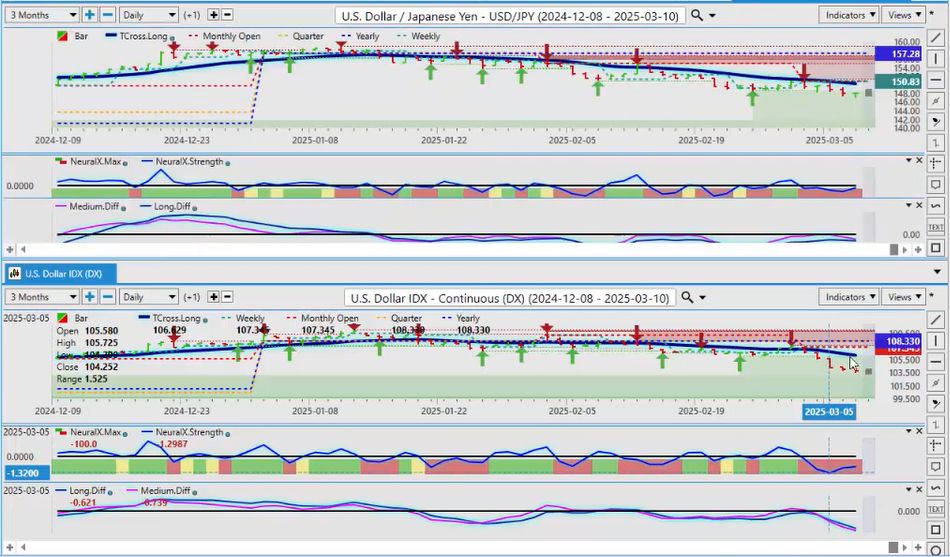
Now, with the dollar Yen, again, the dollar Yen positively correlated to the dollar Index, we can see that they’re moving up and down together, so any type of reversal on the dollar Index would see some dollar buying against the, but the carry trade right now, guys, is basically coming apart at the seams. So, uh, if that continues, the dollar Yen, and, and I’ve been a strong advocate in these, in these outlooks since January 1, that the, the, the Japanese yen is grossly undervalued, that it should have never have got up into the 160 area to begin with, but we had covid, we had Fed rate hikes, rate cuts, but mainly rate hikes, a very aggressive, uh, fed in a very dovish Bank of Japan, but that is changing, the bank of Japan is getting more hawkish. So, uh, I believe that they’re going to use this to their advantage and start talking up potential rate hikes. Uh, right now, our Ma diff cross is signaling more downside on this particular pair. I fully support shorts while below the T cross long at 15025, and again, the monthly opening price, very important here, guys, 15083, but the dollar Yen this year, this is not 2024, guys, that’s why we want to stay away from that rolling performance model of moving dates around, we need to, we need to have anchor points in our trading to clearly identify what the trend is on this pair or anything else, and the trend is down in 2025. The trend was clearly up in 2021, 22, 23, and 24, but we’re not in any of those years, guys, so we have to measure that anchor point against where the market is, so shorts still look good, even on a dollar rally.
U.S. Dollar versus Canadian Dollar
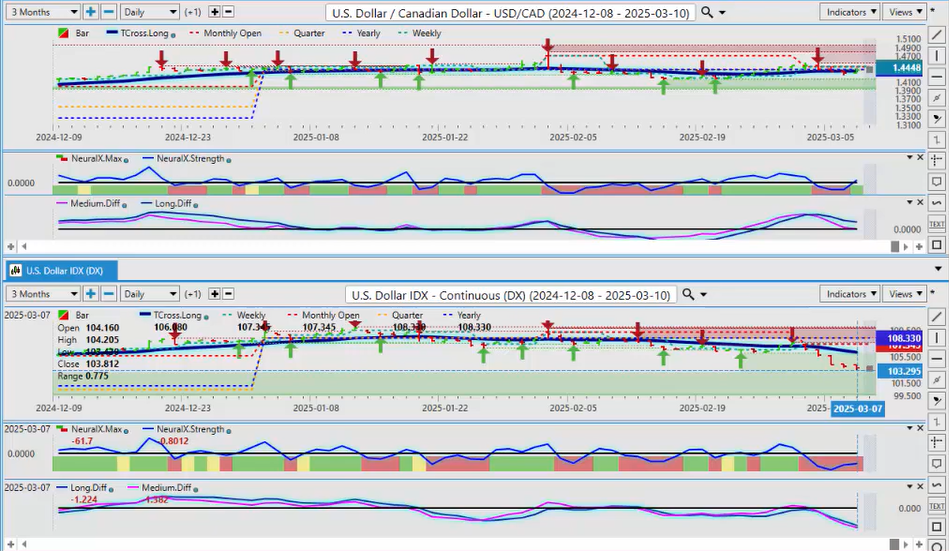
Now, our three main pairs, uh, and I get a lot of questions about the US Canadian pair, the Aussie US, the New Zealand US, now what I’m going to show here is, is, and the reason I use the split screen this week is because the Canadian dollar is still under pressure, and in most cases when it is, so is the Aussie and the Kiwi, but that’s not what’s happening, we’re flatlining along our T cross long, that area 14340, the yearly opening price 14380, the market is basically trapped between the monthly opening price, the T cross, and the TR cross long, so this pair is gearing up for a for a breakout, uh, but if the tariffs are gone, then the breakout is to the, to the downside, if the bre, if the the tariffs are staying on Canada, the breakout is to the upside. So again, we’re at the mercy of, uh, all of this tariff stuff, uh, I have no control over it anymore than you do, or some of the top analysts out there, we have to gauge it based on what’s happening. So right now, the lead indicator, which is the neural index strength, is, is picking up on again, Canadian dollar weakness, so there’s a slight bias back to the upside, but if the tariffs come off, then this thing follows its normal seasonal patterns of the Canadian dollar getting stronger in April, May, June, July. So again, I’ll, I’ll update everybody each week, but the main thing I wanted to show this week, that there is a definite breakdown here in what’s happening between the three commodity currencies, slash equity currencies is what I call the the Aussie, the Cad, and the Kiwi.
Australian Dollar versus U.S. Dollar
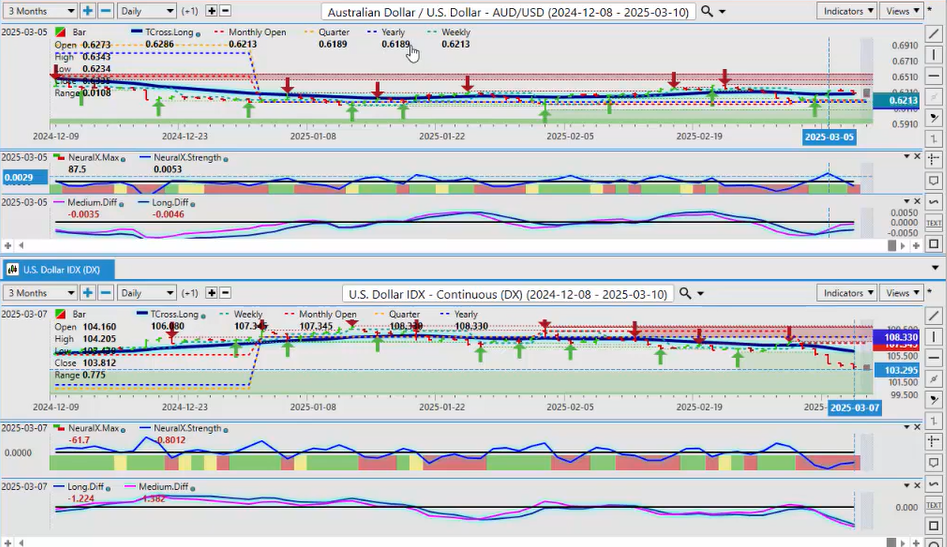
So right now, the Aussie has maintained its strength for the better part of the week, but again, we’re looking at reversal indicators, contrarian indicators, the neural index is saying, look, we’ve got a a problem here, um, it’s not as strong as what it appears to be. I would argue we stay long while above the yearly opening price 6189. We break down below that, then we have a problem. We also have our TR cross long, that currently, the T cross long is coming in at about 6288, uh, the ma diff cross has guided, guided us here, the contrarian indicator, because again, we look at when the market’s going lower, and, and as the market, market’s going lower, the ma diff cross, the pink line over the blue line, is saying the exact opposite. But here’s where this gets interesting, we first of all have to identify that we can see there’s a difference between the Aussie and the Kiwi and the Cad. Now, the the Aussie and the Kiwi are Asian-based currencies, and the Canadian dollar is not, so again, that correlation is breaking down with all of this tariff stuff. So right now, uh, again, we need to know our levels, and the yearly and the monthly opening price are very, very important. The indicators are mixed on here, so again, be cautious. There are numerous things throughout this outlook here today that are pointing to some kind of dollar rebound.
New Zealand Dollar versus U.S. Dollar
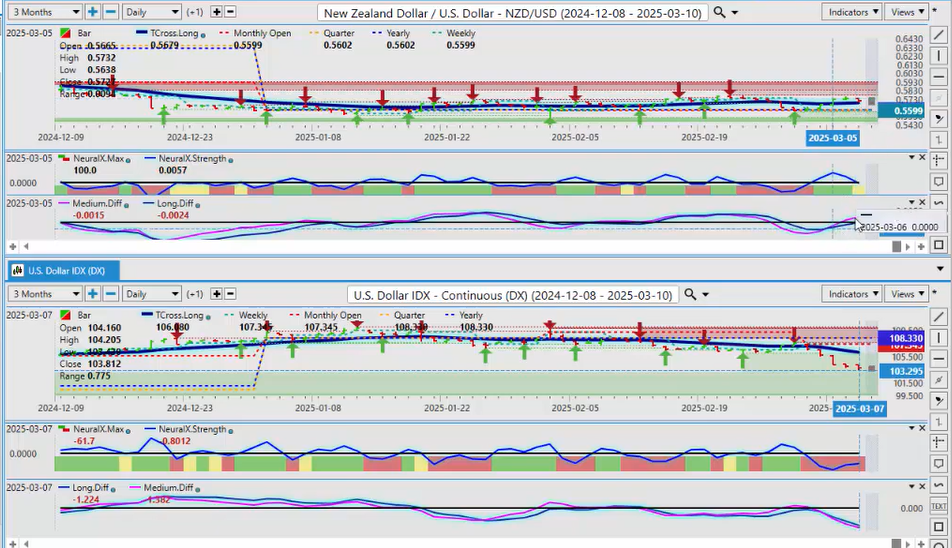
When I look at the, uh, the Kiwi, and again, the the New Zealand and the Kiwi, basically the same trade, but I’ve got to give a slight edge to the Kiwi in this particular case. It’s a little stronger than than the Aussie, and I believe that that is coming from the, uh, Aussie New Zealand pair, cross pair, moving lower, could be some good value on that one too. But for now, we can see that, uh, the Kiwi has the ma diff cross, has been able to break above the zero line, the long-term predicted difference is also trying to do that, but what we can assess is again, the direct inverse correlation between the dollar Index and the Kiwi. So we, we likely have another very, very choppy week coming, but as long as you know your levels, guys, and you’re keeping a, a close eye on the direct in-market correlations that I’ve discussed here today, then there will be opportunity. So with that said, this is the Vantage Point AI Market Outlook for the week of March 10th, 2025.


