


Welcome to the Artificial Intelligence Outlook for Forex trading.
VIDEO TRANSCRIPT
US Dollar Index
Okay, hello, hello everyone, and welcome back. My name is Greg Ferman, and this is the Vantage Point AI Market Outlook for the week of March the 24th, 2025. Now, just a quick reminder, this is a complete market outlook, but individual stocks are done through the secondary Hot Stocks Outlook. But this is not specifically a stock outlook; it’s a broader market outlook. So, we will begin where we always do with the US Dollar Index.
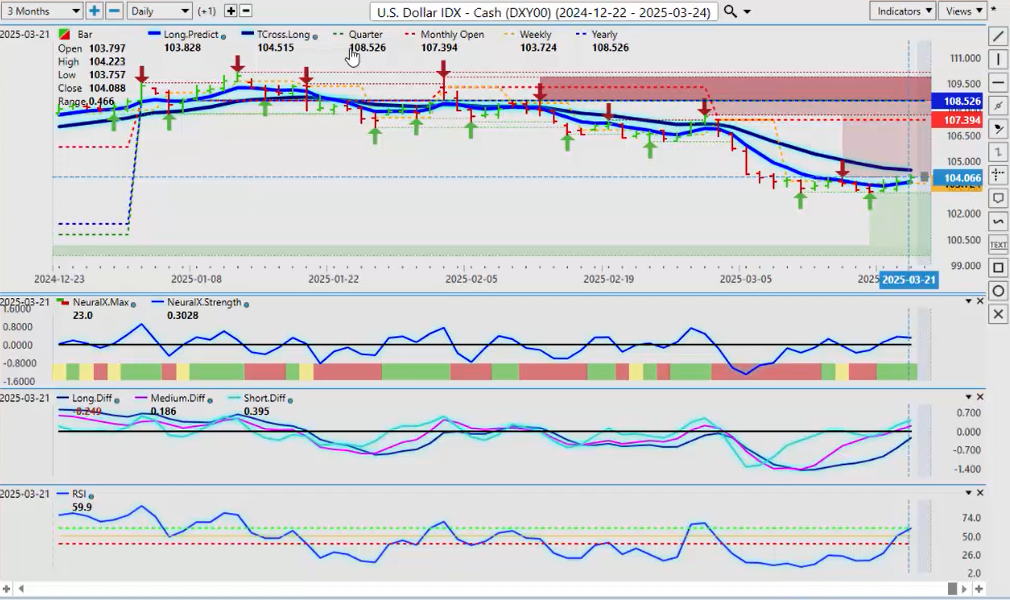
Right now, as we move towards the end of the month, the dollar is starting to strengthen. We discussed this in last week’s weekly outlook. We now have two strong verified support lows coming in at or about the 103.19 area. We still have that risk of the US tariffs that are being put on; I believe April 2nd is the cutoff date, so we’re going to see additional volatility. But we’re looking for that area around 103.19 to hold. Our predicted RSI is rising; we’re at 59.9. We need to get above 60 here, guys, to get some momentum building. But in most cases, the dollar is strong in the last week of the month into the first week of the new month. But also, in most cases, there is a significant sell-off before that happens, so be careful on Monday and Tuesday of this week.
In the latter part of the week, we’ll look for that dollar strength to gain momentum. But again, we want to make sure we’re using those predictive indicators and our verified zones to tell us that we’ve got some identifiable support despite all of this volatility.
Crude Oil
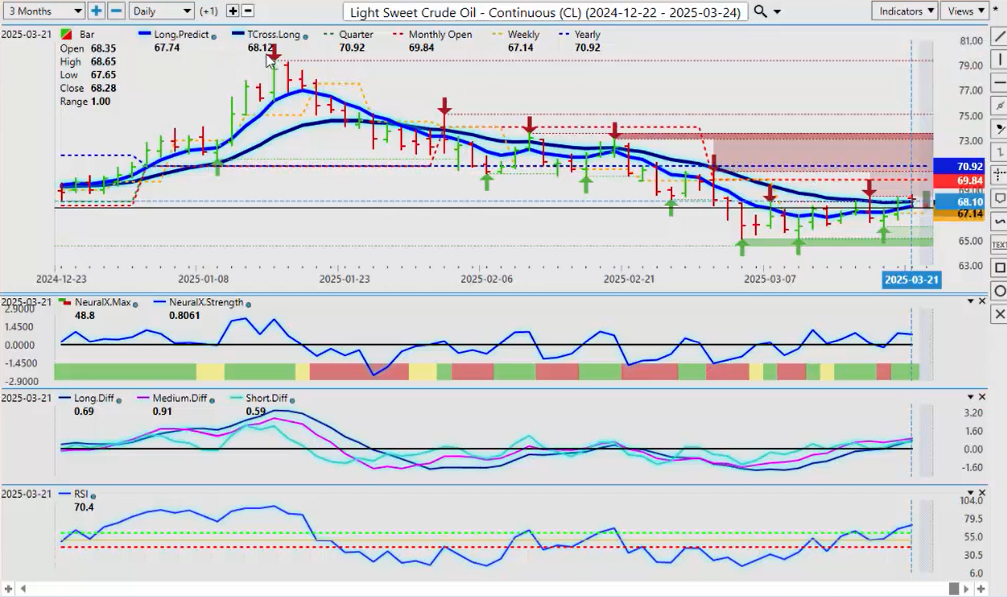
Now, with the Dollar Index rising, we can see that oil is now beginning to follow it higher also. We’ve had a pretty decent close on Friday here at 68.12; you can see that we’ve closed essentially just a hair above that area.
So again, if the dollar can extend its gains, it’s likely to pull oil contracts up with that. So, keep an eye on that. But for now, we do have momentum on oil. The medium and long-term predicted difference—keep your close eye on this as we go into the week. If that pink line does cross over the blue line back down to the downside, then we do still have a problem. And respectfully, we still are in a downtrend. We’re below the yearly opening price, we’re below the monthly opening price, and we’re just barely holding above the T-cross long. So again, both the dollar and oil a little bit shaky, with some hope that both can extend higher.
Gold
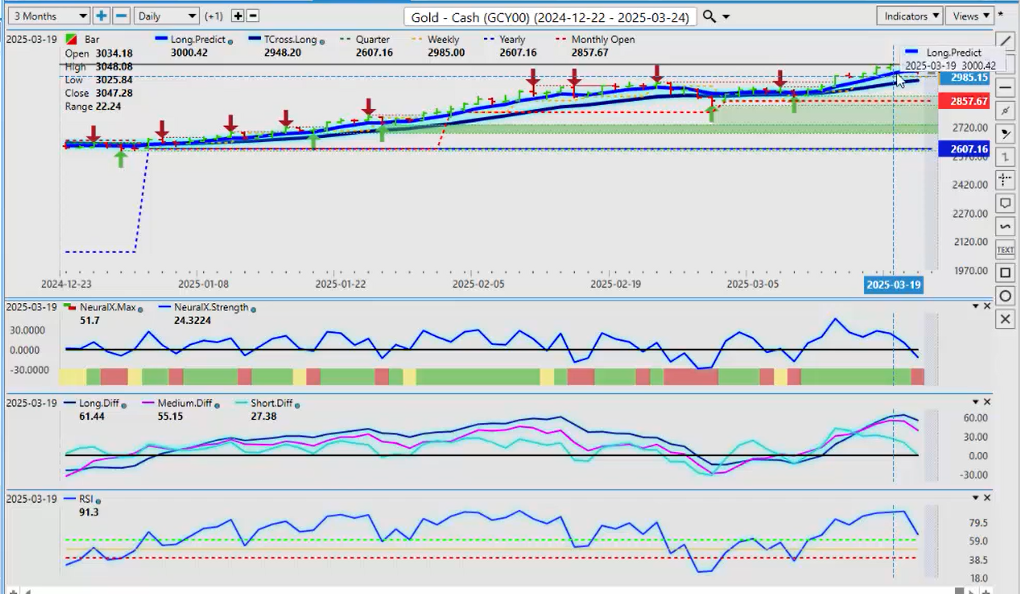
Now, gold contracts are basically stalling out here. About midweek, we had the initial push to start the week on gold, hit up into this 3050 area, and then you can see we just completely ran out of buyers. Now, in most cases, this is perfectly normal at the end of the month with that pending dollar strength. So for now, gold remains a very strong buy, but a retracement is perfectly normal; it’s healthy. Our T-cross long is 29065; our long predicted is 30016. Now again, those are our two main levels. I have seen pretty substantial drops in gold at the end of the month on that dollar strength, usually in and around $100 to $140 an ounce.
So respectfully, I believe we can potentially push towards 2965, but we first have to get past 30016. That’s that custom predicted moving average that I have here. And again, if we break that, break down below that and close below that, then we definitely have a problem, and we are likely heading to 2965.
Bitcoin
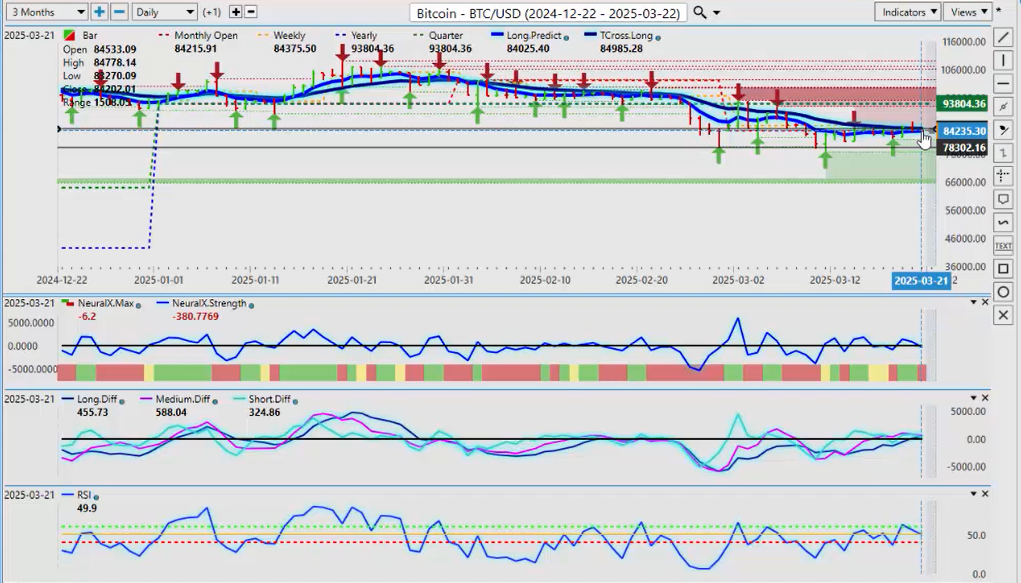
Now, looking at Bitcoin, going into next week, I believe Bitcoin can again recover even on dollar strength. Now, the reason I say that: we’re in the third year of a three-year rally on Bitcoin. I think we’re still going to see further upside, maybe not towards the end of next week, but in the coming months and weeks ahead. Bitcoin still remains strong. So we don’t have a lot of momentum here, but if we can get above our T-cross long next week—because again, guys, this is an outlook, not a recap of something that has already taken place—we’re forward-thinking here for next week. This video presentation is being done on Saturday afternoon at 2:00 in the afternoon. As you can see, it’s predictive in nature, so we use seasonal patterns, monthly patterns, predictive indicators, all of these tools that are in front of us to gauge market sentiment. So right now, if we can get above the Vantage Point T-cross long at 84,985 and hold above that, then I would look for a move back towards the 93,000 mark. And don’t forget, we’re going to start a new quarter here in less than a week, and with that will come some very strong opportunities.
Volatility Index ($VIX)
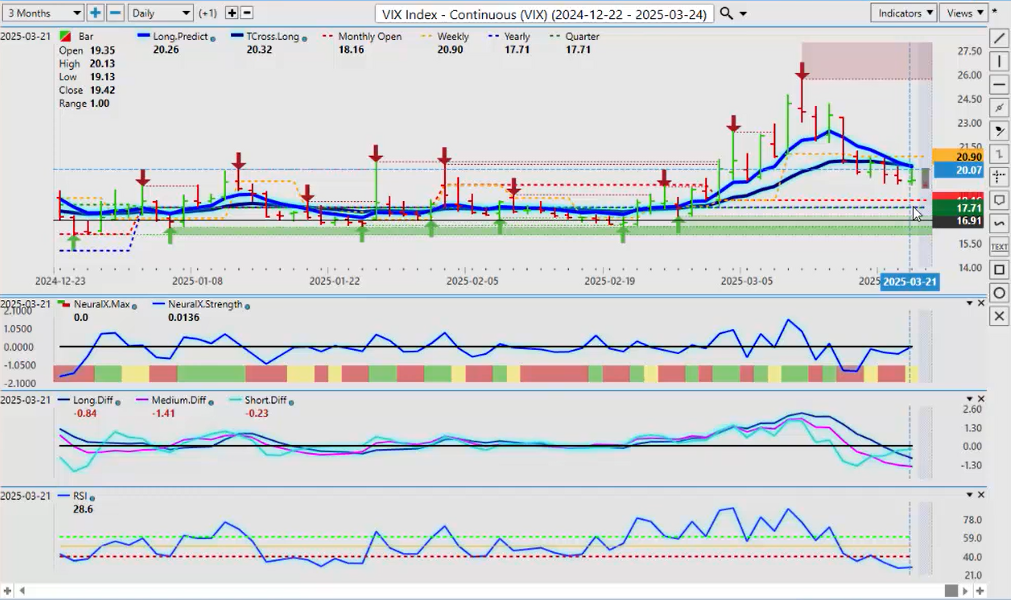
Now, the VIX again, you can see the VIX really struggling now, but we’re still positive on the year on the VIX. I absolutely believe there’s going to be more volatility in the VIX, in the markets in general, leading up to these tariff cut-off dates in April.
So right now, we’re back down below our T-cross long. We’ve had a significant failure up here that came in on March 11th. So again, watch our VPT cross long next week, 20.32. That is our key level here. If we’re holding below that, then the equities can still rise. And as I pointed out the other week, the dollar and the S&P and the NASDAQ have all been basically positively correlated to each other. So stocks go up; that doesn’t mean the dollar necessarily is going lower. But again, we’ll keep a very close eye on this. My only concern with the VIX is we’re starting to flatten out down here, 28.6 on the predicted RSI. Again, the short-term predicted difference on Vantage Point, measuring that short-term crossover, is still warning of some strength here, so be very, very cautious if continuing to short the VIX at these particular levels.
DAX
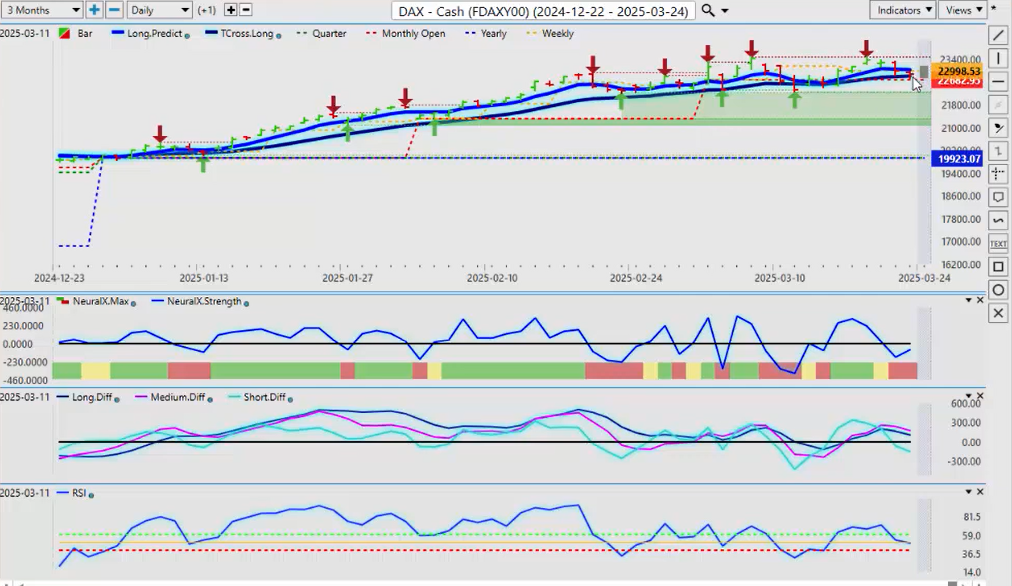
Now with the DAX, as I had said last week, I am predominantly bullish on that. We have been down on the week, but the DAX is a very different structural picture to the S&P 500, and that’s why I want to show it before the S&P. When we look at the DAX, we’re above our monthly opening price, we’re above our yearly opening price. It’s structurally very strong. When we look at the actual performance of the DAX, that’s even more attractive for longs here. And again, I don’t want anybody to misinterpret—I was definitely talking about not just shorts but longs here on this. So when we look at the DAX for the calendar year, the true performance model, we’re up 14%, as I showed last week—a very strong move.
So as long as we’re holding up in this region, the DAX longs still have a very strong bias. Now, that TCross long for next week is going to be 22,562. That’s the area to keep your eye on. But in most cases, the global indices are basically 95% correlated.
S&P 500 Index
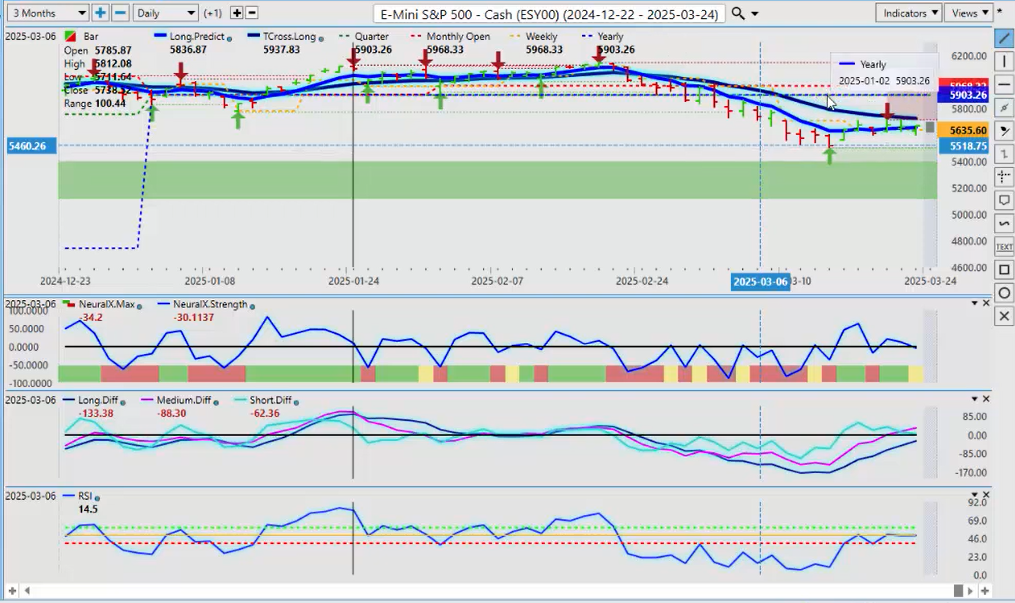
So now, when we look at the S&P 500, we see something very, very different here, and that’s why I wanted to do the DAX first this week. So in this, it is completely inverted, and this is something we don’t see; I don’t see very often. It’s been many, many years. I think since the financial crisis that I’ve seen this.
So while the DAX enjoys a 14% positive return, the S&P is actually down 4%. Is it officially in a bear market? No, it’s not, guys. We need to stay below that yearly opening price for a longer period of time. And as you can see right now, we actually have a buy signal. The medium-term crossover has occurred, but we have absolutely no momentum on the predicted RSI. So again, we’ll monitor this one. But if the dollar can extend higher, I believe it can pull the S&P back up with it, but we have to do that comparative analysis to a known positive correlation between the DAX and the S&P 500. That correlation is broken down; they’re actually now inversely correlated significantly.
And that’s why I’ve been a strong proponent of buying the DAX, not selling it, and I still remain in that camp despite the little minor sell-off, corrective move last week. Because again, most of your equities, your uncorrelated equity markets, they will tend to move lower when the dollar moves higher, but the S&P is moving up with the dollar index. Very important that I point out that correlation.
Euro versus U.S. Dollar
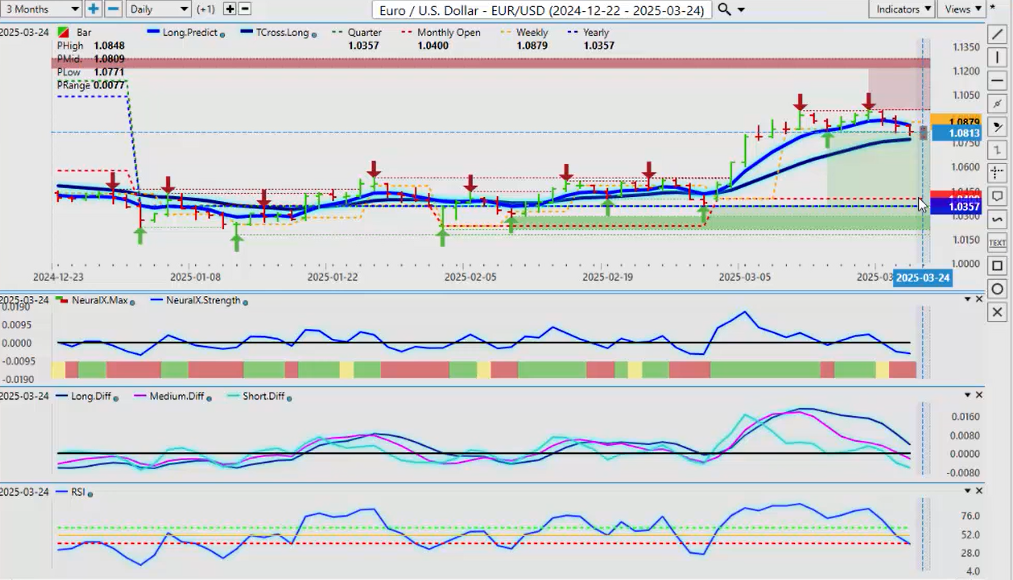
Now, going into some of our main forex pairs, the Euro having a pretty significant failure up at the 1.0950 area, approximately. That’s the second failure we’ve had at almost the exact same level. That doesn’t necessarily mean the Euro is ultra-bearish here, guys, but for now, we’re correcting lower. Our T-cross long is 1.0770. So I’ll give—I’ll throw something to the bulls and to the bears on this. If you’re bullish on this still, then as long as we’re holding above 1.0770, then you’re long at that area. Now, and you’ll notice the Vantage Point predicted low for Monday is also at that particular area. So, I believe that the Euro long trade is tired, and this could be it for it. But it is still positive on the year, and that’s what we have to make sure we’re looking at.
But we have a significant move from the monthly opening price, and in most cases, that’s a retracement. So, when we look at our predicted, our medium-term crossing over our long-term predicted difference, Vantage Point has actually not been bullish on the Euro since March the 11th, which is pretty interesting, to say the least, because that’s when the DAX started to have a little bit of trouble too. So again, the pink line crossing over the zero line right there tells us we have a medium-term crossover, a short-term crossover, but we don’t have a long-term crossover.
So and we’re going to be on that. So for the people that believe that the Euro is going to go lower, then you would put sell stop orders below 1.0770. We break down below that, and we are likely going to be moving back towards the monthly opening price, somewhere between 1.04 and 1.05, but that will take a bit of time to make up that kind of distance here. So right now, we’ll focus our area around 1.0770. If it holds, we’re long; if it doesn’t, we immediately start looking at shorts.
U.S. Dollar versus Swiss Franc

The US Swiss Franc, I think, we could see some opportunity on this next week. The one thing the Swiss Frank struggles with is when the equity markets are positive, but when the equity markets are negative, the Swiss Franc is a currency you want to buy because it’s a risk-off scenario. That’s the direct inverse correlation: equities up, Swiss Franc down. So if the stocks can recover with the dollar next week and into the following week, then that should push this pair higher. We’ve got to get above our T-cross long; that area there is .8859. That is our retracement point. Keep a very close eye, but in most cases again, be careful of one more sell-off on the dollar. And in most cases, what I’ve seen, 80% of the time, it’s a bear trap. So a little bit of push lower on this one, but we can visually see off the verified support low, .8758, that we have significant support. We have four failures at this level.
Now again, if I were to give something to the bulls and the bears, well, the bulls, we would be buying off of that low, .8756. And for the bears, I wouldn’t be shorting this, guys, unless we break this. So again, an excellent area to put a sell stop just below these four bars, well five actually when you look at it. That so this is clearly telling me that we have no sellers down here, but if we have a big equity market sell-off again, this level will give way.
British Pound versus U.S. Dollar
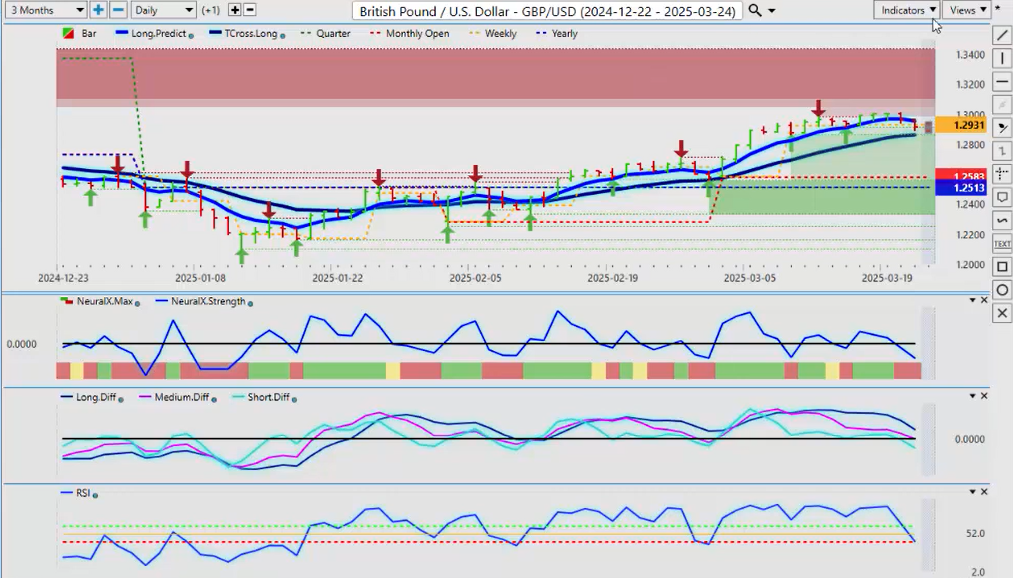
Now, with the Pound Dollar, going into next week once again, absolutely no buyers. This is the verified zone identified by Vantage Point on March, on or about March the 12th, that high, 1.2986, looks very, very similar to the Euro, where we just simply running out of buyers up here. So right now, we’re coming back down to our T-cross long, 1.2865. If we lose this area, then we are likely targeting the monthly opening price at 1.2583. That is entirely possible, guys, as been it’s been pointed out to me on here, the pound dollar can make some big daily moves. So yeah, two or 300 pips is not that could easily be made up in a week, maybe even a couple of days, with on a pair like this.
So be cautious, but the main area you want to watch for next week, 1.2865. If we’re holding above that area, you’ve got a long, but if it breaks down below that, and once again, because this is an outlook, not a recap of something that’s already taken place that has no value, we’re looking at putting potentially the other way you can do this is with a sell stop order below the TCross long at 1.2865. So we can monitor that area, but we’ve got a short ready to go. Or for people outside of the US, you can straddle the TCrosslong with both a long and a short, and whenever it makes a big push, I think it would be reasonable to say that the dollar strength would be limited to probably a week or two at best. So in that particular case, you can hedge it, play the downside, close your short, let it retrace back up. Just an alternative strategy to anybody outside of the US where hedging is still where we also were allowed to hedge, and we do not have a FIFO rule.
U.S. Dollar verus Japanese Yen
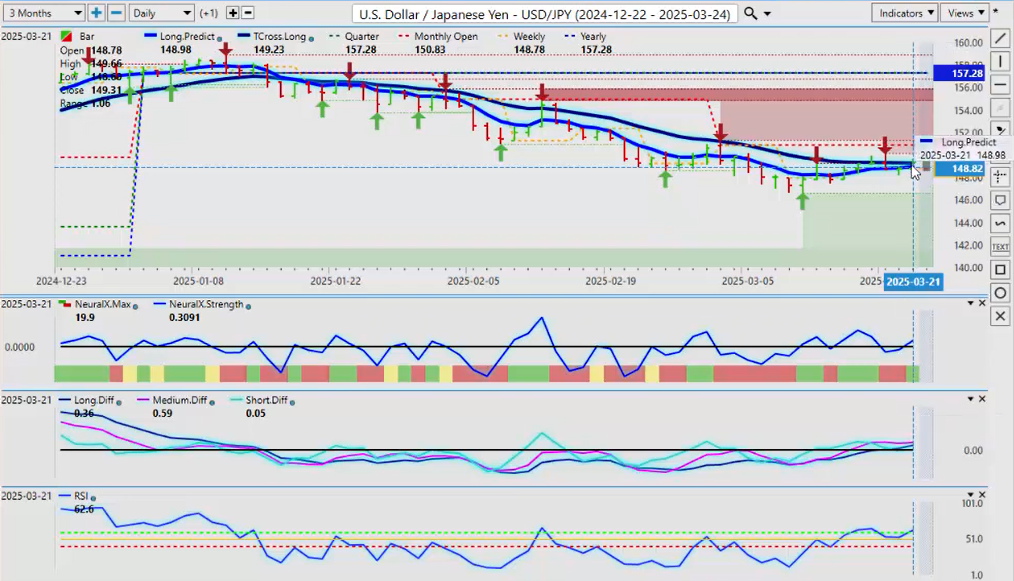
Now, looking at the Dollar Yen, going into next week, with the Dollar Yen, again, this is all basically buying or selling US dollars. So right now, there are signs of life on the Dollar Yen, but I think the best case scenario, 150.83, would be your retracement point. Shorts are heavily favored, guys. I think the Bank of Japan is going to ratchet up the rhetoric of hikes, while the Fed is going to be forced to cut inevitably. So again, we may get, but we’ve got to get past the T-cross long, 149.23. Uh, and even if we do, I believe the upside is going to be very limited. We have a verified resistance high, that first one coming in at 150.15, and then a secondary one at 151.30. So very significant resistance between these two areas, with a heavy short-side biased once we get past that period of dollar strength.
But with that tariff announcements coming in at the 1st or 2nd of April, we may not see any dollar strength here, and I do need to point that out, guys, and I have no control over what the current administration is doing.
U.S. Dollar versus Canadian Dollar

Now, the US Canadian, likely from the inside here, being domiciled in Canada, we are likely going to likely announce a federal election on Sunday, tomorrow, and that’s probably going to be around the end of April, what I suspect. So with that, I think it’s not out with the old, in with the new; it’s out with the old and back in with the old again. Very little change. I’m not sure which way the election’s going to go; it’s too close to call. But it is going to affect the Canadian dollar. So if that same old party gets in again with those same old policies, it’s been very, it’s decimated the Canadian dollar for the last nine years. So I think that longs are heavily favored, heavily favored here, in my respectful opinion.
But there again, there is going to be some volatility, but the medium and long-term predicted differences are rising. We’ve got the predicted RSI is rising with it. The neural index, the neural index strength, but there’s a lot of indecision around this one. You can see the long predicted and the T-cross long both at 1.4342, 1.4348. So this one here going forward, uh, easy peasy, guys. If we’re holding above these two numbers, we stay long; if we can’t hold above these two numbers, then there’ll be at least a short-term sell opportunity, and that would be likely down to 1.4167. But my optimism on this pair hitting that level is very guarded, respecting the tariffs, the Canadian election, the policy. There’s a lot of lot; there’s far more negatives on the Canadian dollar than positives. Uh, so again, we’ll see how it plays out, but that is the level to keep your eye on.
Australian Dollar versus U.S. Dollar

Now, the Aussie and the Kiwi, the market has really actually stayed positive on these two currencies, and the Aussie and the Kiwi got a boost from the China stimulus last week, which I believe will help them both into 2025. So we’re above our yearly opening price, we’re above our monthly opening price. Longs are favored, but I think a corrective move lower during this period of known dollar strength is reasonable. But I would further argue for the entire calendar year, guys, to break this down simplistically. We’re trading in a range between .6401 and the low side of that is .6088. So we buy down here, we sell up here, but ultimately I believe that it will be the .64 level that breaks. But I can’t rule out, in a risk-off scenario, another test of the bottom end of this range. But we are definitely in a channel here.
So right now, the VP indicators are saying we’re moving back to the lower towards the end of the lower end of this channel. But it will be very, very difficult for the Aussie to get past the yearly opening price at .6189, particularly if China continues with further stimulus.
New Zealand Dollar versus U.S. Dollar
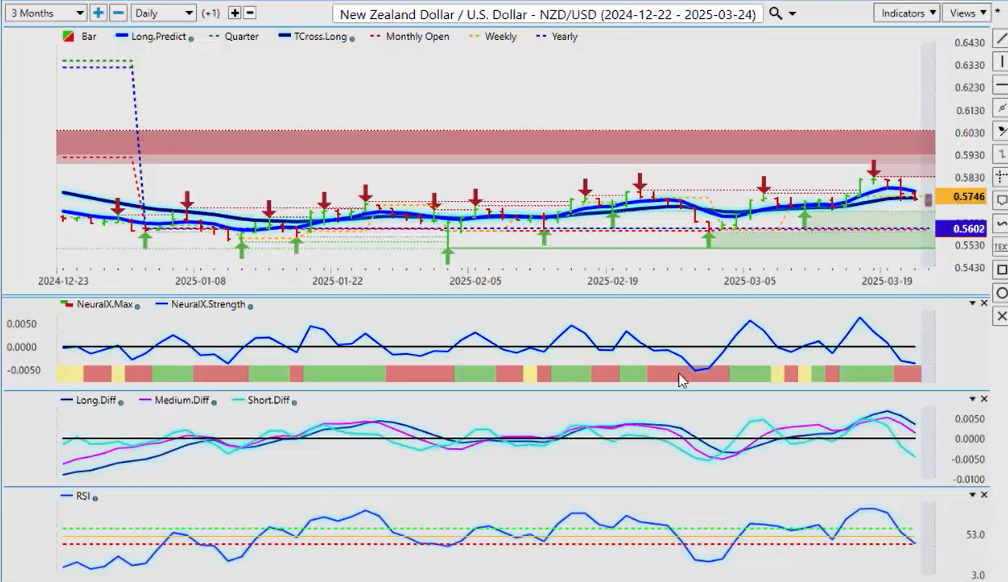
The same thing will apply to the, uh, to the, uh, Kiwi here. Uh, the Kiwi, getting some of its strength with that sell-off in Aussie New Zealand. So for now, the Aussie is the stronger currency of the two, but they will both be susceptible to a break lower on dollar strength. But I believe, guys, that that will be a buying opportunity on both of these two pairs, as China continues to promote, uh, or bring in stimulus for their economy.
So with that said, this is the Vantage Point AI Market Outlook for the week of March the 24th, 2025.


