


Welcome to the Artificial Intelligence Outlook for Forex trading.
VIDEO TRANSCRIPT
US Dollar Index
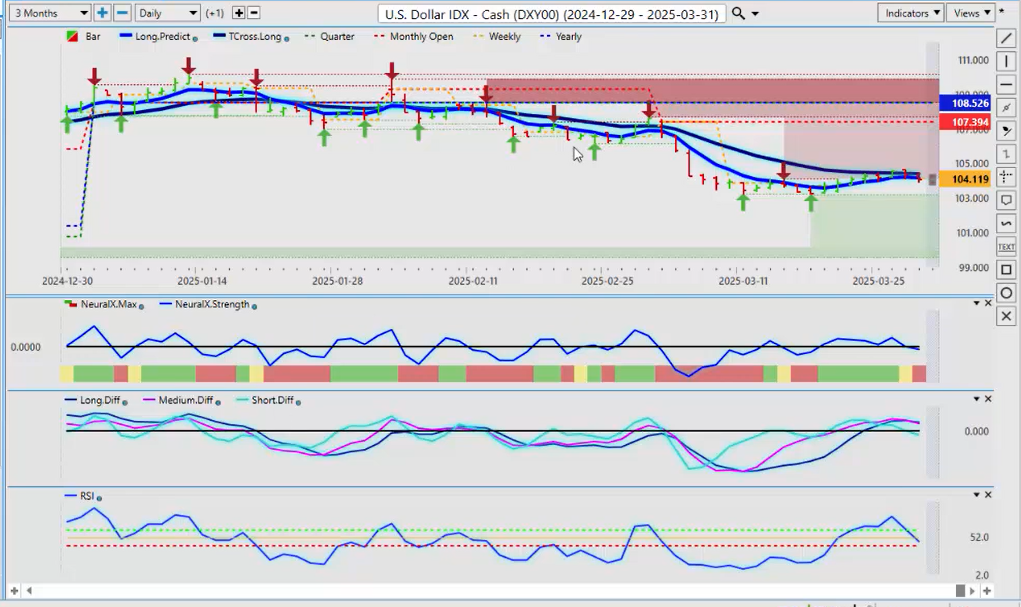
Okay, hello everyone, and welcome back. My name is Greg Firman, and this is the VantagePoint AI Market Outlook for the week of March 31, 2025. Now, to get started this week, we’ll begin with the US Dollar Index. Once again, we can see the dollar has recovered, based around that known period of US Dollar strength. The question is, can it continue? We’re all tangled up in the VantagePoint T cross long. That resistance is coming in at 10441, and that’s the key level we need to break through. Now, to be clear, the dollar remains very negative on the year; we’re below the yearly opening and the monthly opening price. Another sell signal is attempting to form right now; we’re just lacking momentum. But once again, we’ve had that corrective move higher into the end of the month. The question is, now, the payroll number next week is your main driver for volatility. Is the US job market going to recover? That’s the main question here. But again, with the tariff battle going on, the trade war going on, it’s having a negative effect on equities, on the Dollar, on a number of different markets. But for now, a very, very soft sell signal is there, but if again, we can break through that T cross long and stay above 10441, then the dollar strength is likely to continue.
Gold
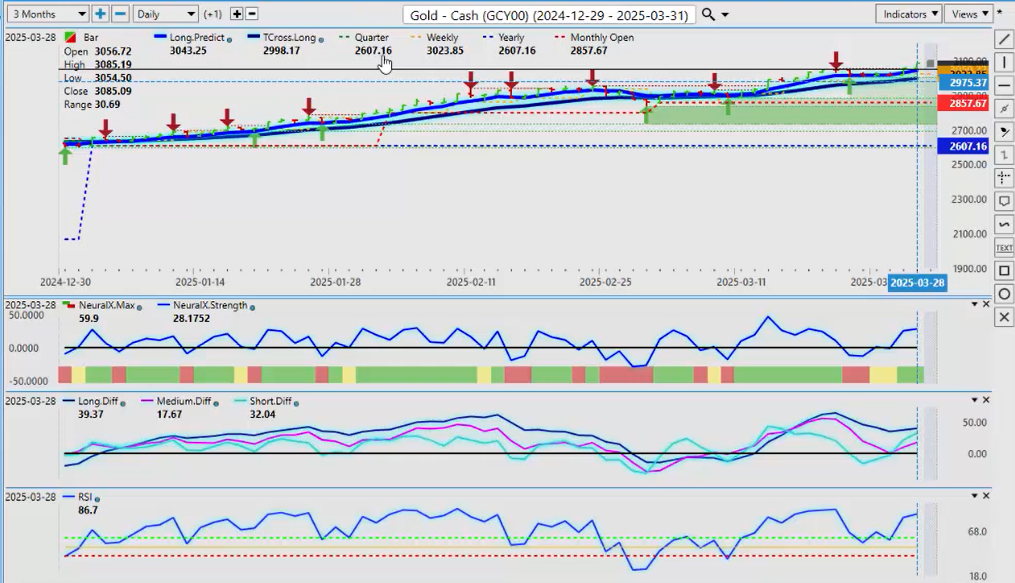
Now, when we look at Gold, once again, Gold contracts usually struggle right at the end of the month, but with that volatility around the tariff announcements, it has pushed Gold back up again. So, once again, remember that this is a fundamental that’s driving these gold prices, not technicals. So if Trump backs off these tariffs, then Gold should pull back. Now, our key supports come in at the long-predicted 3043, the T cross long 2998; those are our retracement points. But, once again, when we start April 1st on Tuesday, I believe we will have a new quarterly opening price, and I would strongly advise to keep a close eye on that particular level in the first month of April because again, that quarterly opening price will help guide us whether we’re above it—long, below it—short. So for now, Gold remains at all-time highs, but the question is, can it extend higher? The VP indicators are suggesting it can, but remember that fundamental driver: if this trade war goes away, Gold will come down relatively quickly.
S&P 500 Index
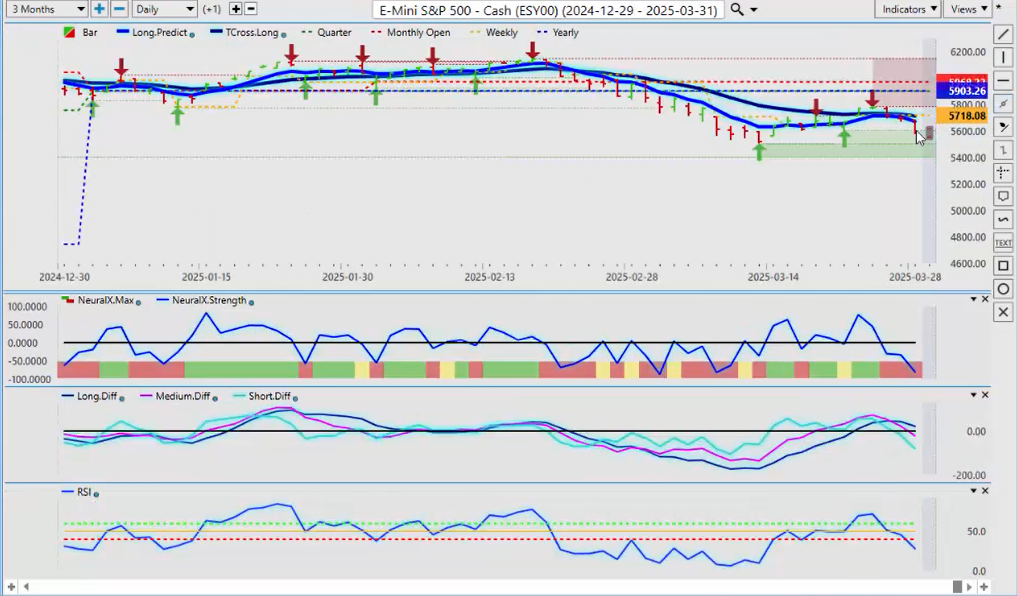
Now, when we look at the equity markets, they too remain highly correlated to the US Dollar Index, both below the yearly and the monthly opening price. We’ve had multiple failures into our T cross long, and then Friday, likely some profit-taking pushing it lower. But to begin next week, our main resistance area is between 5671 and 5714, the long predicted and the T cross long. Now, once again, we remain quite negative on the year. We have a fresh MA diff cross, our neural index is pointing straight down, and we do have momentum building on the predicted RSI. Now, in most cases, people will use a predicted RSI, a stochastic, a number of these very similar tools to show overbought and oversold when, in my respectful opinion, we should be looking at it from a momentum standpoint. So, a break of the 40 level suggests we have momentum to the downside, a break of the 60 suggests we have momentum building to the upside. So you can see, we got a few good days just like the US Dollar Index, and when the dollar turned, equities followed. So again, still very negative on the year and on the month, so the new quarterly opening price will be out on Tuesday night in the VP update, and that’s what we’ll be looking to gauge the strength of the overall markets.
Light Sweet Crude Oil

Now, Light Sweet Crude Oil, once again, coming up—and this is why we avoid that rolling performance model, guys—where we take a random 5 days, random 30 days, or 15 days, or even 60 or 90 days. We want to keep these anchor points locked to the current yearly opening and the current monthly opening. So again, Light Sweet Crude Oil has had a good move up last week, as per last week’s outlook, with that dollar strength, but now the oil is struggling here also. So we’ll keep an eye on this, but for oil to get really bullish here, guys, we’ve got to get through 7092. Shorts are slightly favored while below that level. In the VP software, our neural index strength is pointing down, we’ve crossed our zero line, predicted differences are also weakening, suggesting there’s going to be some downside coming next week, and the predicted RSI also pointing down. So, a number of different indicators are saying that Gold is likely going to struggle here, but if we can get above 7092, that will open the door back into the 7375 area. But my optimism on that occurring next week remains heavily guarded.
Bitcoin
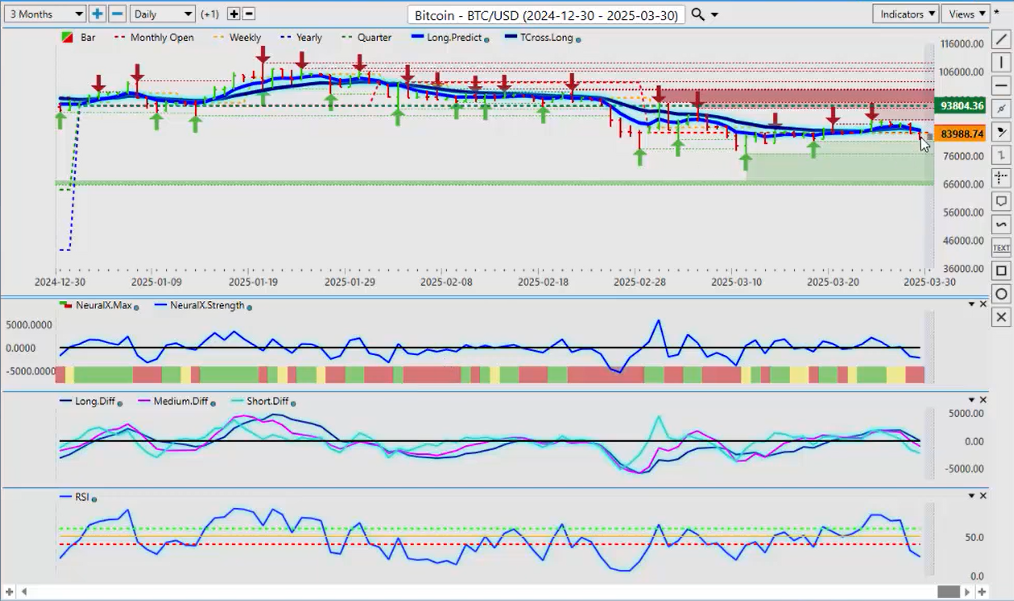
Now, when we look at Bitcoin, once again, Bitcoin is feeling the heat from the tariff war also, and again, we remain negative on the year. But in most cases, Bitcoin will tend to go a bit sideways in the month of March and April, but I believe we do still have some further upside. Our support levels down here, the low 76,000, we’re looking for that particular area to hold. Now, for next week, I can assess here that we do have a medium-term crossover, we’ve got momentum building to the downside, but remember, we’re also in a period of known US Dollar strength here, guys. So again, can the dollar remain firm leading into the non-farm payroll number? I don’t think so, because I believe the market believes the **US** labor market is weakening with these tariffs. So again, we’ll monitor it, but any kind of risk-on scenario will immediately see Bitcoin reverse back to the upside. But either way, believe we’re in the third year of a three-year rally, and we’re down on Bitcoin next year either way. But for the remainder of this year, I also believe that we can remain firm into October, November, barring any significant breakdown below that 70,000 mark.
Volatility Index ($VIX)
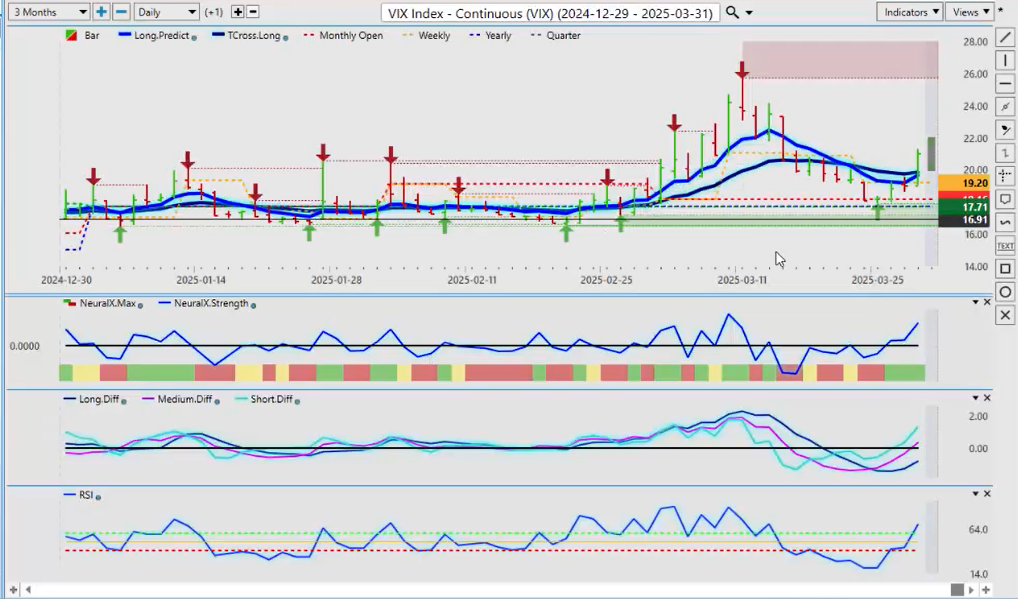
Now, when we look at the VIX, once again, the VIX is starting to show momentum, and another very strong example of why we use the current calendar yearly opening price, the calendar quarterly opening price, and you can see that that was our retracement; we hit that and went right back up again, and this is what most traders miss because they’re looking at random anchor points, where if we use the current monthly, quarterly, yearly, and even the weekly opening price, guys, it can be very powerful as a pivot level to or basically to gauge whether the market is bullish or bearish based on price action. So again, we’ve completely reversed the MA diff cross; you can see that we hit the yearly opening price, we had an MA diff cross that occurred at or about the same time, and we’ve broken through the T cross long. So again, the VIX longs are going to be based on a risk-off scenario. The tariffs being put in by the US, Canada, EU—all this big tariff war continues—the VIX will continue to climb. So we’ll monitor that, but again, Trump is flip-flopping a lot here, so I think if he feels the heat, he may back off this, and that would bring the VIX back down. But for now, it remains firm.
DAX
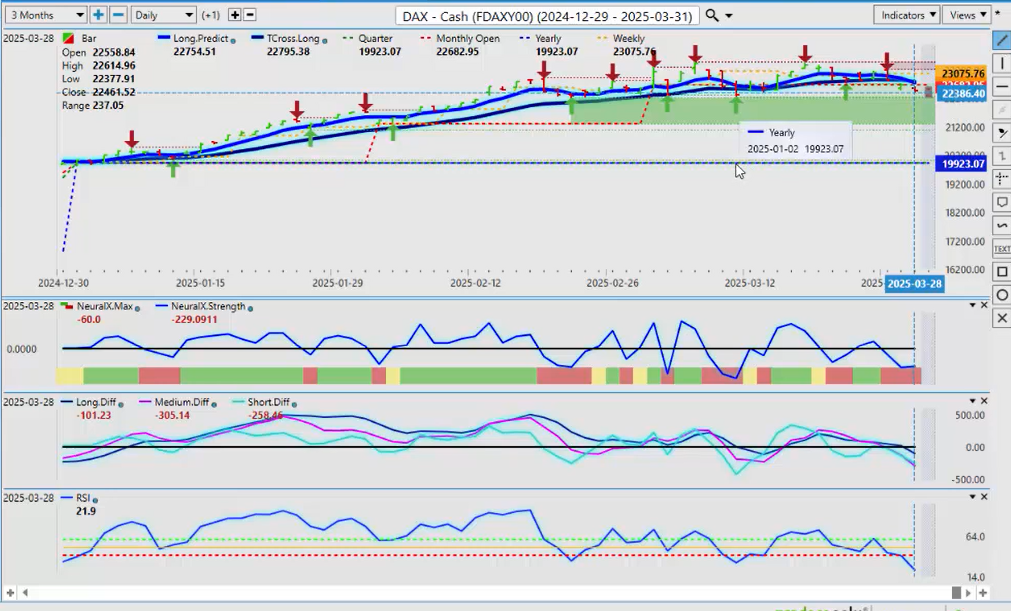
Now, the DAX 30, once again, I’ll have a look at that for my European friends. The DAX, it’s very, very important here, guys, that we understand that predominantly, I’ve liked the longs on this because it’s polar opposite to the S&P 500 and even the NASDAQ. And even with this minor pullback, we’re still up 12.67% on the year. Now, the key support levels here were basically running along in a channel; the low end of that is 22,320. I’m going to be looking for that area to hold, but for now, we are starting to get a stronger sell signal finally on this thing to the downside. But once again, be very careful; if that VIX reverses and the trade war ends, then your global equities will start climbing again, and that’s why I’ve had a strong bias to the upside on the major indices but particularly the DAX. So again, if we can hold down on these support levels here, then this is likely just a retracement. But again, next week’s presentation will be a good one too, guys, because we’ll have that new quarterly opening price, which is very, very important for us to gauge sentiment in the market. If we’re above that quarterly opening price, there’s a bullish bias, but if we’re holding below it, then the global equities could start to pull lower as the VIX rises. But again, we do have momentum building here. The only negative I could say for shorts here right now is that neural index strength. While the neural index is red, the neural index strength is not, guys; it’s actually running sideways, suggesting it’s getting ready to turn back up. So just keep an eye on the support levels of 22,320. We need a clean break of this, and then I’m all in for shorts, but we’re not there yet, guys.
Okay, now when we look at some of our main Forex pairs, and I am going to move a little quicker through here, we’re in a major ice storm in Canada, and I don’t know if the power will hold for much longer. So, but I do want to get this out. So right now, we can see the power of using the current monthly, yearly, quarterly opening price, but mainly the T cross long, a very, very powerful predicted moving average. You can see that we’re running right along this all week, and we were only able to close below the T cross long for one day. Now, I’ve often talked at the seminars and in the VantagePoint live room that I have a two-day rule: I need this thing to close below that VP level two days in a row before I’ll bite on a short.
Euro versus U.S. Dollar
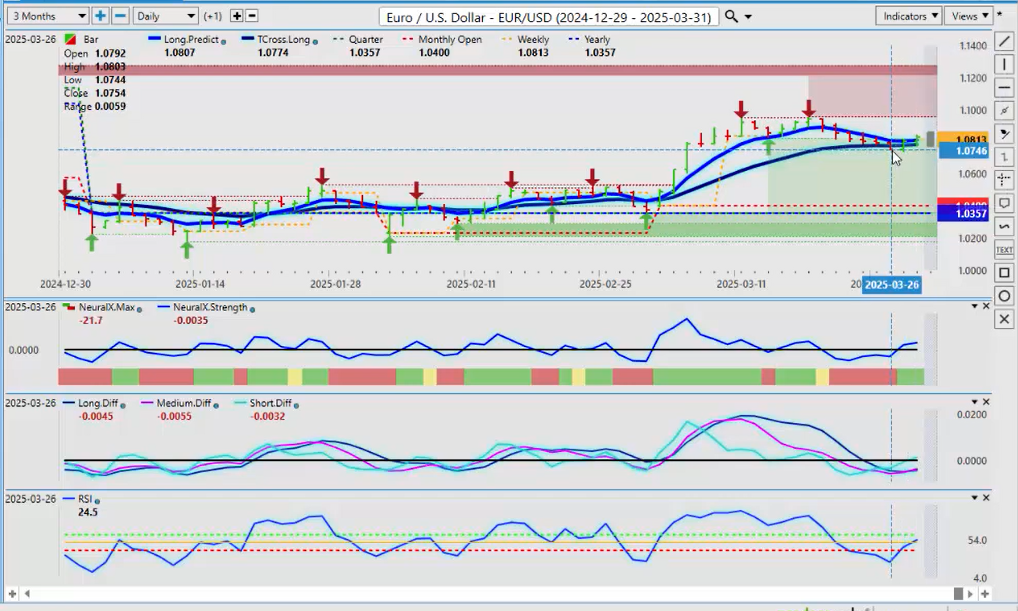
So right now, we’re continuing; the Euro is really putting up an epic battle here, guys, but the line in the sand for next week is 10781. So, if we break down below this, you sell; if we’re holding above that, we’re long. And again, the dollar cycle has been tightening up; a lot of the players have been exiting dollar longs prior to the non-farm payroll number, so there could be some life in the Euro here.
When I look at the neural index, the neural index strength, and I’ve got an MA diff cross that’s forming right off that T cross long, but let’s make sure we’re clear on one thing, guys: the Euro is not bearish on the year; it’s actually quite bullish. The current yearly opening price coming in at 10357, and we are firmly above that. So there’s a slight long bias here, but very, very slight. And the main thing is, know your levels, and if we know that that’s our line in the sand, well, one can put a sell limit order just below 10780. If it breaks through there, you pick up the short right away, but I would encourage you to trail your stops just to be safe because there will be volatility.
US Dollar versus Swiss Franc
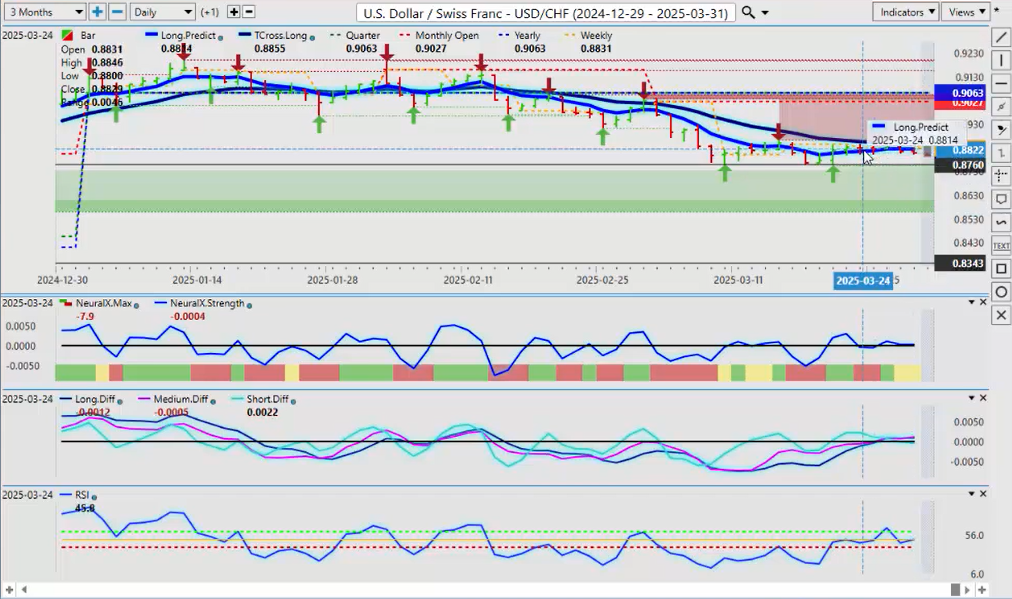
Now, with the US Swiss Franc, again, another dollar trade here, another one that breathes life into that Euro long trade, is that we’re unable to break through this T cross long. And whether you have a long or a short bias, there’s enough meat on the bone here, guys, for everybody. So right now, shorts are in control, but here’s how we would play this because again, this is an outlook, guys, not a recap of something that’s already happened. So these key levels to start Monday’s trading on the TR cross long is 8846. So one could put a buy limit order just above that T cross long, a buy stop, meaning as soon as it passes over there, boom, you’re sitting there waiting for it, and that’s been a very powerful strategy over the years. But that is our line in the sand. The indicators are still slightly bullish on this pair, so I believe we could get above it, but it’s all up to Trump and the Dollar Index.
British Pound versus US Dollar
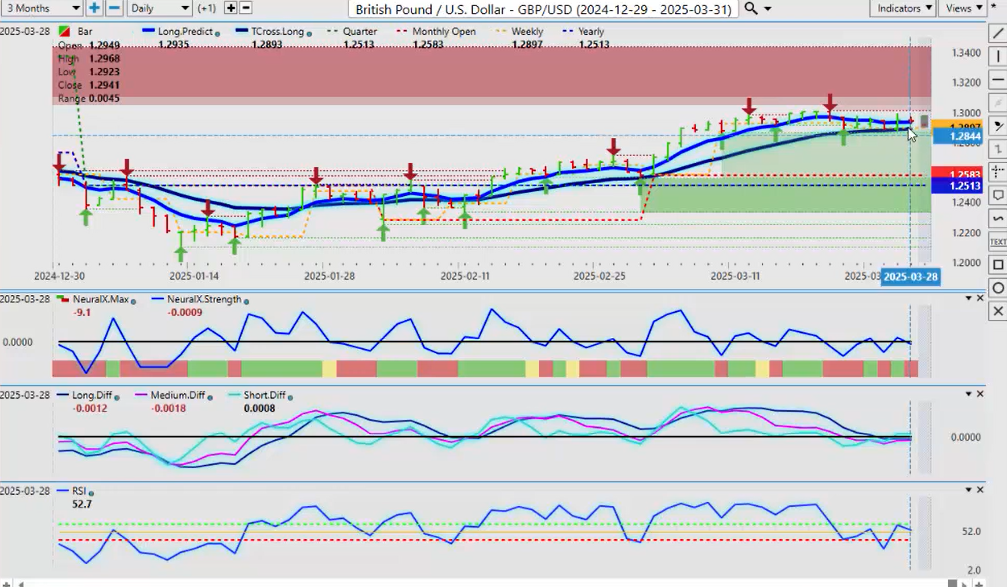
Now, the British Pound US Dollar, again, holding above its yearly opening price, surprisingly. The data, the Bank of England, not a whole lot of positive news coming out of England either, but you can see that if you have a long bias, then every single day you pretty much have a long off the T cross long this past week. And again, we have to break through that and close below that key level which comes in at 2893. We have to close below this level, guys, in order to have a retracement back towards our yearly opening price at 12513. The indicators right now are very mixed on this pair; we’re holding above the T cross long, but the other core VP indicators are suggesting there’s a problem here for longs, so be mindful of that, guys, and again, always make sure we know our levels.
U.S. Dollar versus Japanese Yen
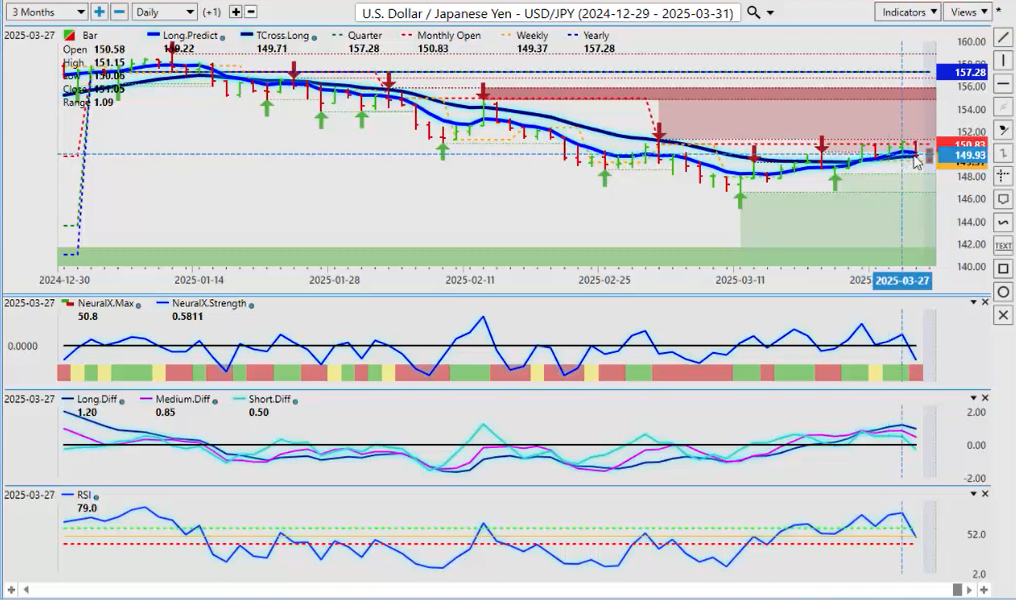
Now, the Dollar Yen has been a pretty wild ride this past week, but again, the importance of using proper anchor points. This is the red line is the monthly opening price, and as you can see, we have failed every single day on that monthly opening price. However, we have also had fantastic longs off the Tross long. So, guys, it can be this easy in trading if you know the correct levels and you avoid that rolling performance. I don’t care what this pair did over the last 60 days; I want to know exactly where it is right this minute in relation to that monthly opening price. And as you can see, the Dollar Yen has been below the monthly opening price the entire calendar month, so shorts, while even though we’re above the T cross long, shorts are still heavily favored here, and if those equity markets tank, the Yen will strengthen, so will the Swiss Frank, so keep an eye on that. But for next week, our line in the sand is 14973. So again, the way that the savvy trader can play this is we have buy stops above 1583, so if it does break out to the upside, we don’t care, that’s fine, we’ll have a buy stop ready to go, and we can have a sell stop ready to go the T below the T cross long at 14973, and again, this is the advantage of being an outlook versus a recap of the market. We want to be prepared going into next week’s trading and have strategies that we can use in real-time.
U.S. Dollar versus Canadian Dollar
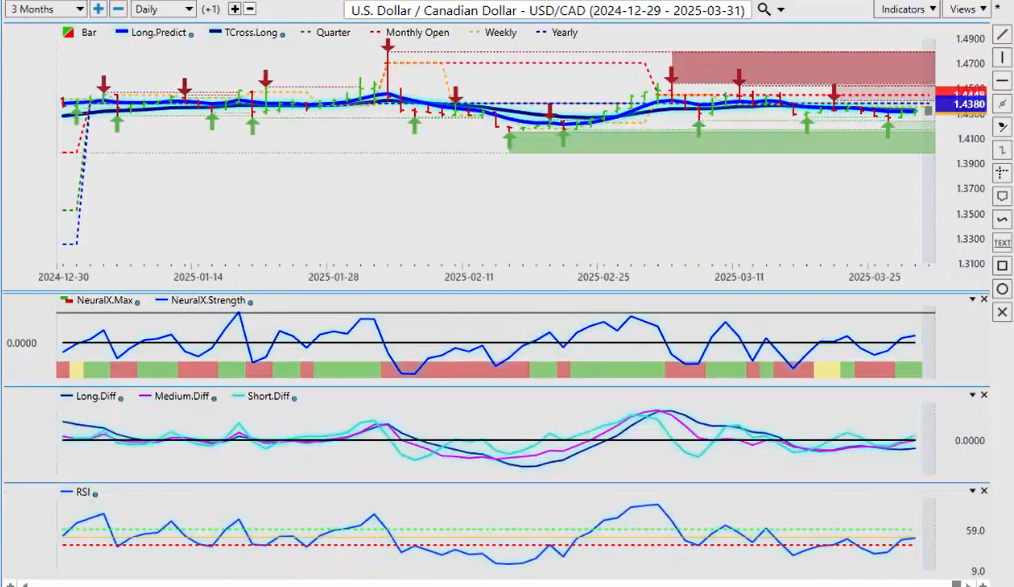
Now, with the US Canadian pair, even though I’m domiciled in Canada, I am not a buyer of the Canadian dollar. We’ve got an election coming up, a trade war, some very aggressive language from the non-elected PM, that the relationship between Canada and the US is done. I can say as a Canadian, it is not done, so we will see where this goes. But for now, the low point for the week here, 14235, always remember that this pair is notorious. 80% of the time, whatever it does on Monday, it does the opposite on Tuesday. So keep that in mind. I know it’s a little bit of a stretch with the Monday Tuesday reversal the last few weeks, but that’s because of the fundamentals of this tariff. But for now, guys, we have very heavy support at the low 14151, and our immediate resistance area is again that current monthly opening price, coming in at 14448. So we are in the lower end of this particular channeled range, and I believe that lower end will hold and ultimately there’s a long here. The VP indicators and the neural index, the neural index strength, the MA diff cross, and we have a rising predicted RSI suggesting that we can push through this. Now again, using that yearly opening price, all the battle lines here, guys, are going to be drawn around 140,380. That’s the area to keep your eye on. If we can get above that area, longs are good to go, but if we can’t, then we could see a little bit more downside, but my optimism on a stronger Canadian dollar either way remains heavily, heavily guarded.
Australian Dollar versus U.S Dollar
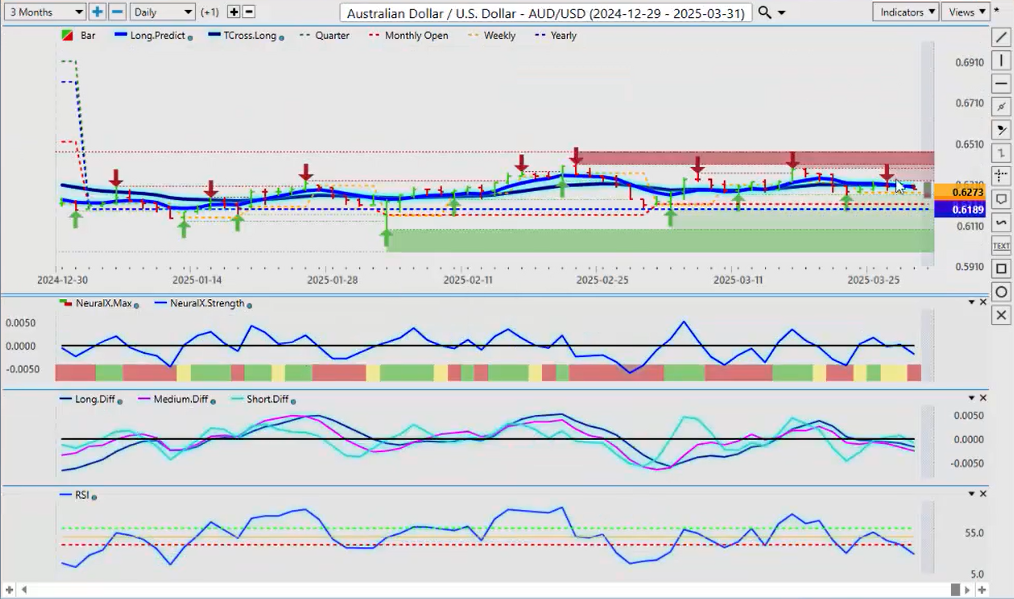
Now looking at the Aussie and the Kiwi going into next week, they’ve actually really bucked the trend here, guys. They’re holding above the yearly opening price, but it looks like we’ve got a little bit of pressure forming here. The T cross long, 63.06, if we can hold below that area, shorts are reasonable, but I believe buying down near 61.89 next week is the better play, and that’s right near that yearly opening price. Then in next week’s presentation, I’ll review that in relation to the quarterly opening price, which again is very, very important in the second quarter because it’s high volume trading.
New Zealand Dollar versus U.S. Dollar
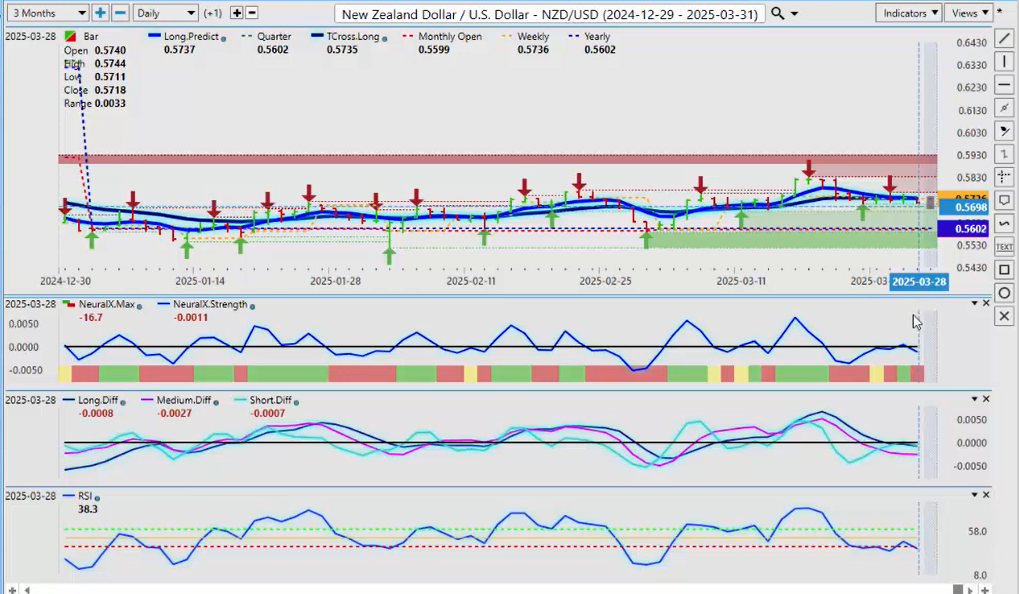
The same thing is going to apply to the Kiwi. And the Kiwi right now, again, they’re both a little bit bearish, but that’s perfectly normal at this time of the month. The Kiwi’s T cross long, the line in the sand, if you will, 57.35, short while below that, but if we get above it, then we’ve got a long pretty much right away. So again, using buy stop, sell stop limit orders with the VP software is a very, very interesting way to play these extremely choppy, volatile markets.
So, with that said, this is the VantagePoint AI Market Outlook for the week of March 31, 2025. Thank you for watching. Best of luck, and bye for now.


