Welcome to the Artificial Intelligence Outlook for Forex trading.
VIDEO TRANSCRIPT
U.S. Dollar Index
Okay, hello everyone, and welcome back! My name is Greg Firman, and this is the Vantage Point AI Market Outlook for the week of October 7, 2024.
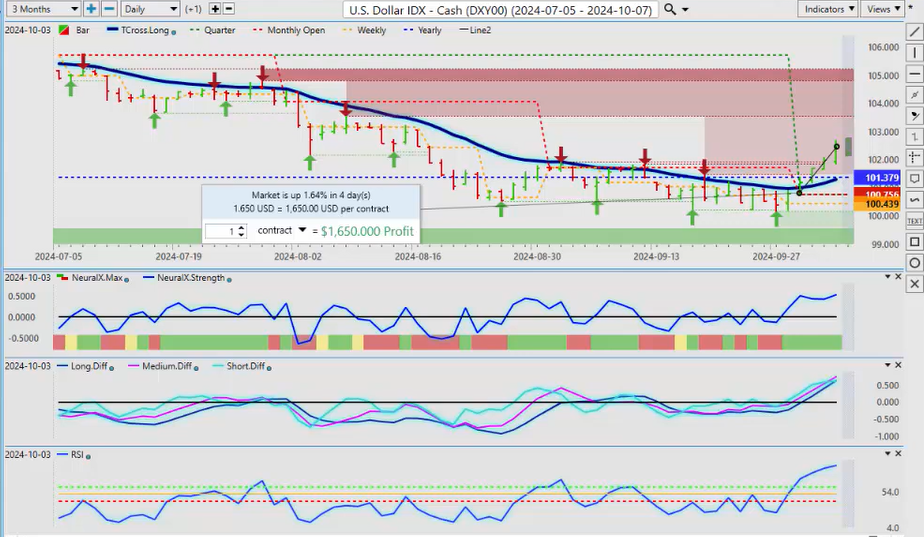
Now, to begin this week, we’ll start where we usually do with the very important US Dollar Index. Now, the dollar spiking higher on that unemployment numbers on Friday, but the data was still a little bit mixed, and we’re still missing about 900,000 jobs over the last year. But either way, it’s calmed down the expectations for a 50 basis point cut, not that the FED had ever said that to begin with. He had talked about 50 basis points by the year-end, which would mean 25 basis points in November and December, but the dollar has reacted positively to this. We are now up 1.64% in October. Now, very, very important that we’re using proper anchor points in our trading for the month, not a random 30, a random 5 days, or a random 30 days, because we need to know exactly where we’re sitting for the month of October. In most cases, between 1 and 2% is the max rise or drop for the dollar in the majority of cases. So right now, we have significant headwinds up here on the dollar anywhere above 102.50; we should be looking for a pullback. The VP indicators here are starting to peak, suggesting a turn could be coming. Now, in most cases, the week after the non-farm payroll number, whether it’s a good number or a bad number, the dollar usually starts to sell off, so all the gains are in there in the beginning of the month. And again, I would expect some sort of pullback. Now, again, I’ve been discussing the dollar strength at the beginning of October, the seasonal patterns, but they usually subside by mid-October. But the bigger seasonal pattern with the dollar is it’s usually structurally very weak after mid-October. So again, our retracement point is the T cross long at 101.28. We have turned back positive on the calendar year; 101.36 is the yearly opening price, meaning from January 1 to now, this is where we’re sitting. We’ve turned positive but very, very slightly.
Gold
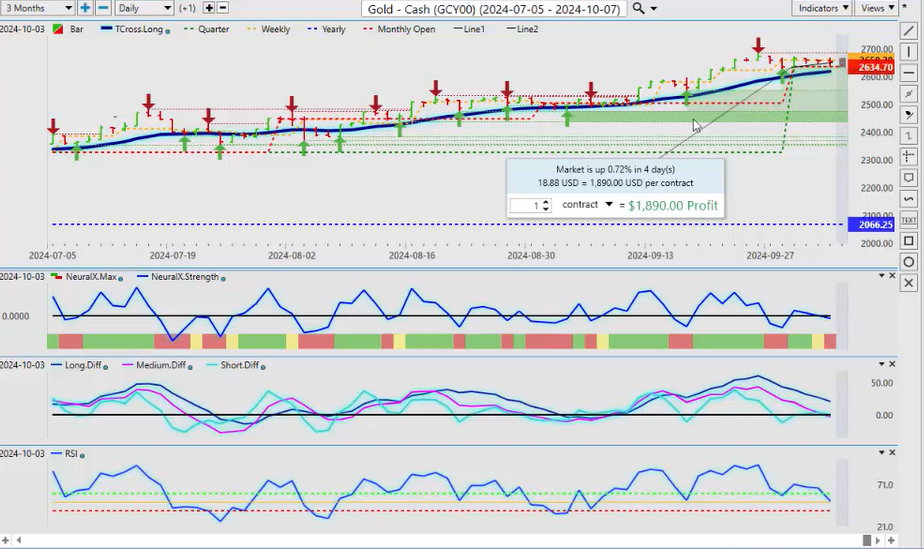
When we do a comparative analysis to Gold, now gold is still holding in there despite this excessive dollar strength at the beginning of the month, up .72% in the last 4 days. Now, the reason this is set at 4 days is that it is October 1. We always want to make sure we lock our anchor points down to the beginning of the week, the beginning of the month, the beginning of the quarter, and of course, the beginning of the calendar year. So right now, our T cross long for gold here is 2617. I believe we will pull back into the upper 2500 area, where it would be another buying opportunity into year-end. The VP indicators here in the medium term are showing weakness in gold. But remember, guys, we’re also in a risk-off environment here with the war brewing between Iran, the US, and Israel. There’s a lot of different things that are going on that can keep gold afloat, but either way, I expect it to move higher towards the end of the fiscal fourth quarter, which is between October 1 and obviously December 31st. So for now, our T cross long 267, the indicators are bearish in the medium term, but we need momentum if we were to sell this, but again, I believe that shorts are very risky anywhere below about 2580, 2560 in that area, is down as a pretty decent buying opportunity.
S&P 500 Index
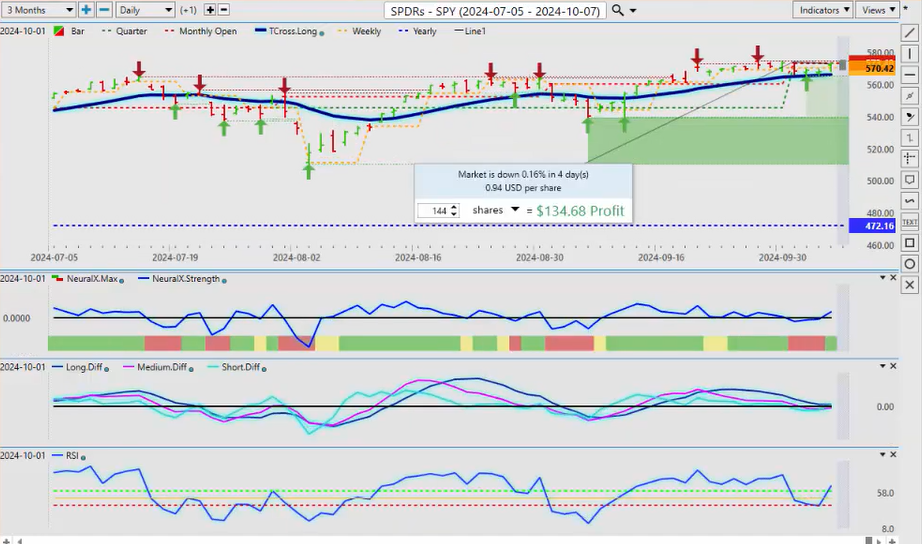
Now, when we look at the S&P 500 or the $SPY’s, the same trade here, guys, one is the ETF, but to be clear, in the month of October, we are not up 2.85% in the Spies; we are up a mere .16%. And this is what we have to make sure, excuse me, down 1.6%, we’re not up at all on the week or the month. We can’t pick random dates, random 30 days too, or cherry-pick bottoms to say, ‘Well, it’s up since this date.’ No, guys, we’re starting a new month; we’re starting a new quarter, so we need to look at that quarterly opening price 573. We need to get above that area and stay above that area in order for this to remain bullish. I don’t want to come back and pick random dates here and say, ‘Well, it’s up 2.8% or 5% or 9% from back here.’ Those are irrelevant numbers, guys. When we start a new trading month, then again, we have seasonal patterns that apply to that a number of different tools. But as you can see, we’re starting to see some bullishness turning around in the equities now that the FED has backed off his position a little bit. And again, more spin from the media. The FED never said he was going to cut 50 basis points in November or December; he said 50 more basis points into year-end. He’s now confirmed that, but we do have the FED minutes next week on Wednesday. Be careful around those minutes because it could say something different, but for now, these spies are down on the month, and they’re down on the week. The S&P 500 you can see is the exact same trade; it’s just on the future side or the cash side, so we’re down .24%, but we are not up anything on the week or in the month because we’ve just started a new month, so the T cross long on the S&P 500 once again, you can see that that’s going to come in about 5680. I believe we can pull back a little deeper than that, uh, so we’ll keep an eye on it for now, but the indicators are starting to roll over to the long side. When we look at the Russell, the additional equities markets here, the indices, they’re starting to turn positive also. We can see MA diff cross, our predicted RSI is recovering, and we’re closing above our T cross long.
NASDAQ
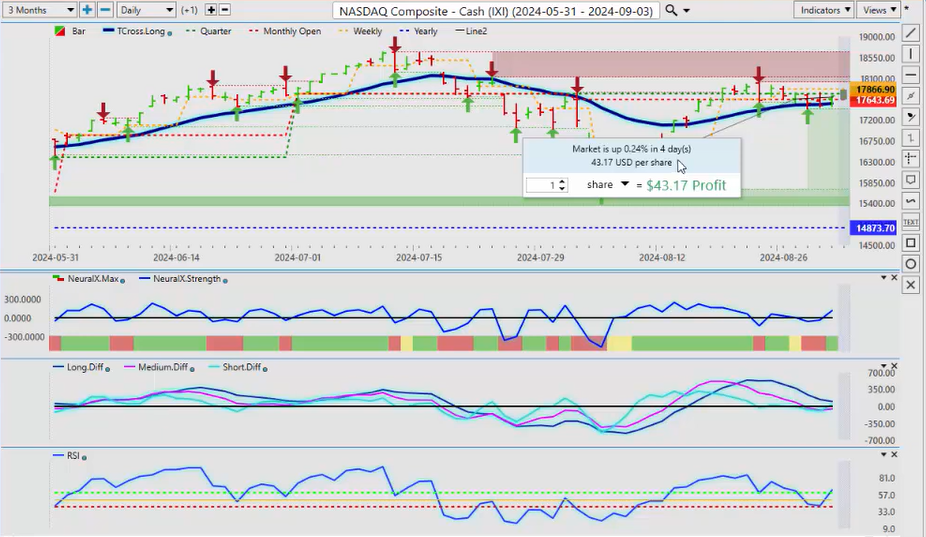
When we look at the NASDAQ, the NASDAQ is one of the few that was actually up last week. So, when we look at the NASDAQ, not up a lot, 0.24% on the month and the week, but if we look at it again, uh, we’re holding above our T cross long; that area is coming in at about 17,558, and that is an area that we should monitor very closely.
Bitcoin
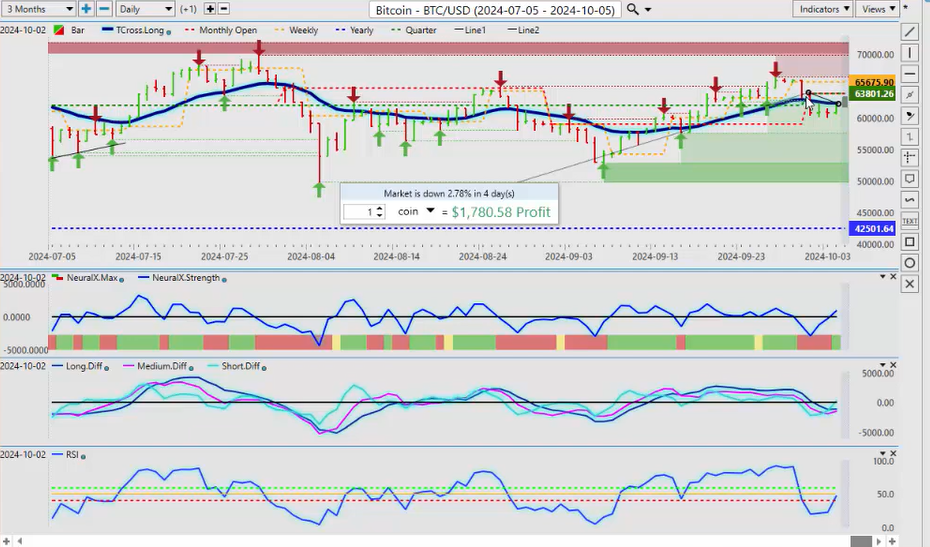
Now, the NASDAQ, I believe, is holding those gains because it’s very, very likely that Bitcoin is getting ready to move higher. When we look at the when I look at the VP indicators right now, uh, when I look at the accurate measurement of performance, we’re down 2.78% this particular week; that’s perfectly normal because we were expecting that dollar strength in that first week and again, once that dollar buying is done, then the dollar usually falls, which would be probably the latter part of next week. So we need to get back up above our T cross long, which I believe we shouldn’t have too much problem doing next week, 62350, but I will, on a side note, say that there are very, very good buying opportunities between 60,000 and about 57,000, but for now, our T cross long 62350. If we’re holding above that next week, then longs look very, very good in the month of October with that strong seasonal buying of Bitcoin that we’ve seen year after year.
Light Sweet Crude Oil
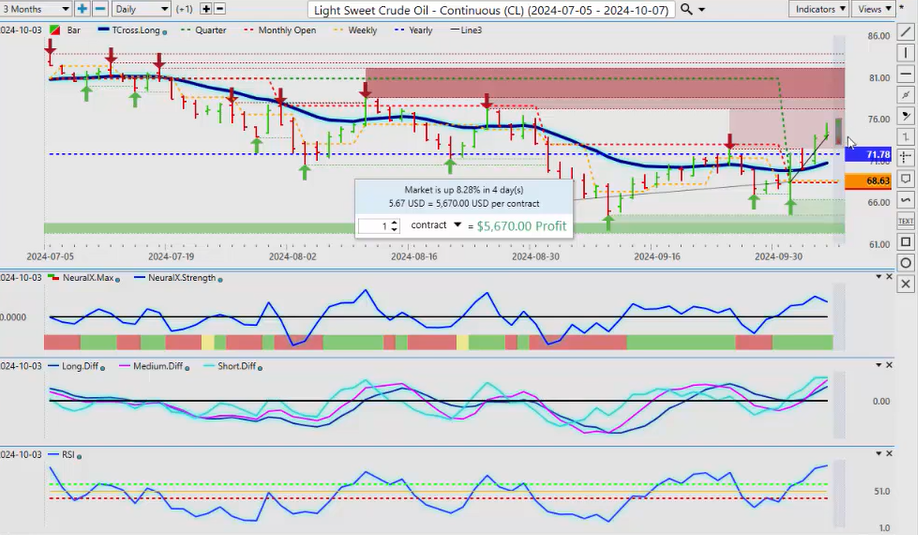
Now, Light Sweet Crude Oil has taken about an 8% spike here in the last part of the month, and that’s obviously due to what’s going on in the Middle East. I don’t believe it’s sustainable, but we will see. As you can, as we can assess here, we’ve got an MA diff cross, we’ve got a rising predicted RSI, but we’ve come up too far too fast, and again, I don’t believe there’s a lot of upside left on oil; maybe we can get up to the verified zone high at 77.25, 77.25, but that would likely be a selling opportunity based on the indicators. We can further assess here that the neural index strength, the neural index strength indicator, excuse me, is while it’s green for the neural index, the strength is actually pointing down, suggesting we’re getting close to a top. We connect that to the verified zone, and that points to a potential problem up here. And again, without this conflict accelerating, then would it have got up here to begin with? My answer is probably not. Oil has been down for months, so again, we’ll watch this area near 77, but the indicators are warning that the upside is likely limited.
Volatility Index ($VIX)
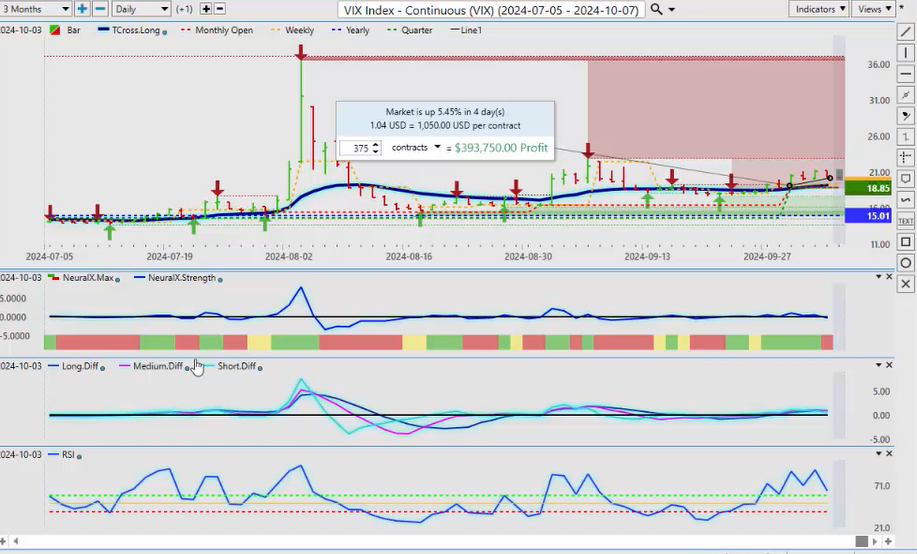
Now, on a comparative analysis to the VIX, the VIX having a pretty darn good week last week, guys, 5.45%, but again, I don’t want to be measuring performance from over here or over here or over or random five days here because those are not accurate numbers, guys. We start the beginning of the month, you’ll find that the best trading you’re going to see is at the first nine or 10 days of the month and the last five or six days of the month; it’s right in the middle of the month where stops are usually being run, so be careful with this, but for now, the VIX is still holding in there at that T cross long at 19.22.
DAX
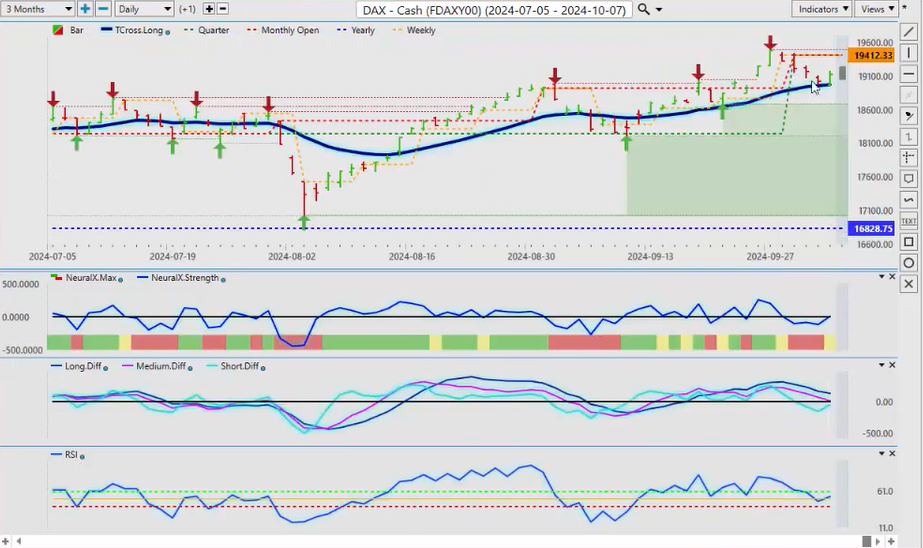
Now, when we look at the European equity markets, they’ve taken a pretty good hit this past week, but this is a perfect example of what a retracement looks like without putting in random levels. Uh, when I look at this right now, at the beginning of the month, we’ve had a pretty deep selloff, but you’ll notice where the market stopped on the European equities. They stopped dead right on the T cross long, and then buyers came in on Friday. So for the European Traders, our T cross long is$ 18,970. If we’re holding above that, I could argue we may have better value here, potentially, than even the S&P, but I would watch the NASDAQ very closely in October. I suspect it’s going to have the best performance of all of the indices. I suspect the NASDAQ is the one that will really shine here.
Euro versus U.S. Dollar
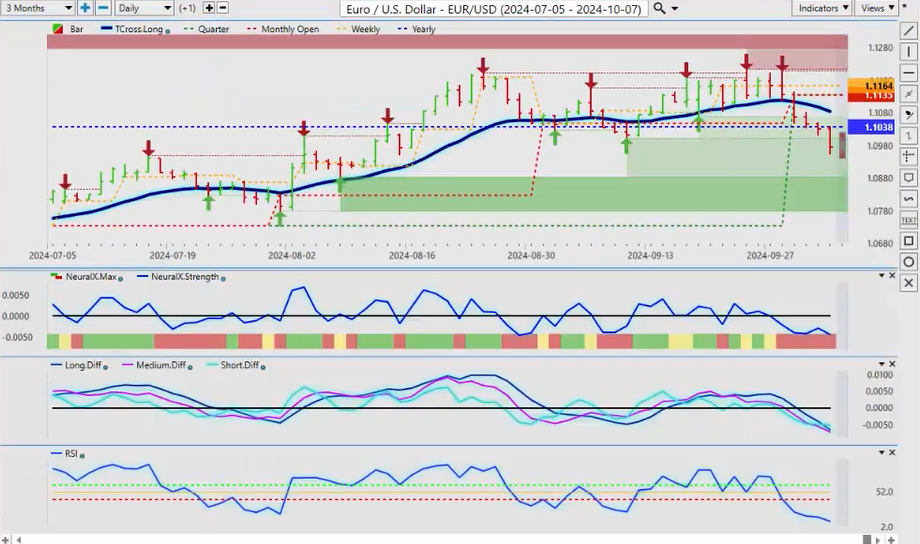
Now, when we look at our main Forex pairs, Euro taking a hit on the FED flip-flopping again, but in this particular case, I’ll argue that I’m not sure that he really flip-flopped. He did on the 50 basis points, but going forward, I heard clearly what he said, and it’s 50 basis points into year-end, 25, 25, but there’s still media still talking about 50 basis points, which I don’t see happening. But either way, guys, the Euro has responded obviously very negatively to the FED comments; that’s it, that’s where we are with rates. So we’ve crossed over the yearly opening price again. Random points, random 5 days, random 30 days, random 60 days, they don’t give us the levels we need. We want to use the current quarterly opening price, the monthly opening price, and that very important yearly opening price to gauge what the performance is. So the resistance here is very easy to identify for next week. The yearly opening price is at 1.1038, and our T cross long is at 1.1084. Shorts are viable while we’re below these levels. If these levels give way, which I believe is very possible by the end of next week, then we would look at longs again, potentially, but that’s we’re going to wait and see what the FED minutes are saying and how the ECB is going to respond to what the FED is doing. But again, those are our key levels, the main one being that yearly opening price if it comes back up to this at the beginning of the week, and it fails again, then that’s your area to short. But for the people that want to be on the long side of this, I would let it get back above 1.1038 and stay above that area and also overtake the T cross long and the monthly opening price. But as you can see from a structural basis, using proper anchor points, the current quarterly, the current monthly, the T cross long, the yearly, this is painting a very negative picture for the Euro, actually. So I will warn everybody of that, just to be clear.
U.S. Dollar versus Swiss Franc
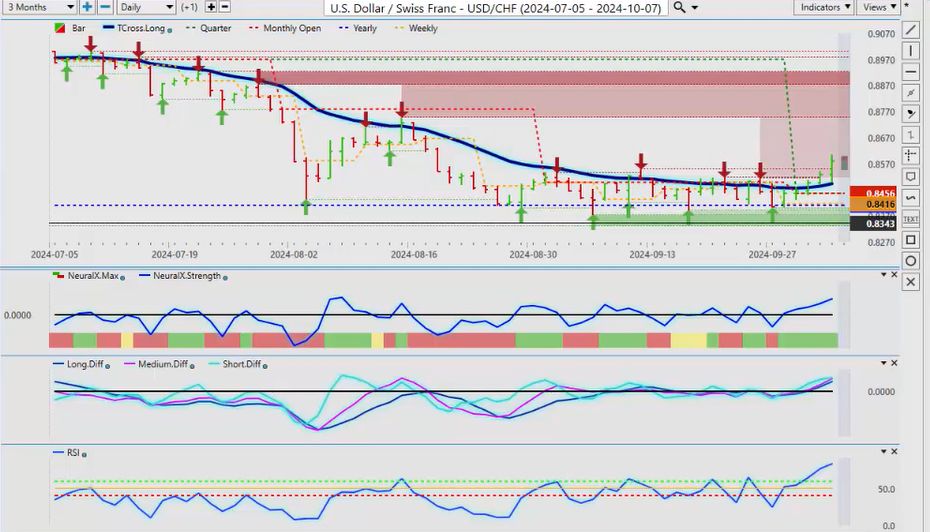
The US Swiss Franc, which is usually the inverse of the Euro, us, one goes down, one goes up. Well, over the years, we have definitely seen something different than that, and that is something we want to make sure we’re watching. Okay, so when we look at this right now, the US Swiss Franc has turned positive, but remember, the Swiss franc, like the Japanese yen, is a risk-off currency, meaning that if things accelerate in the Mideast, they get a lot worse. Flight to safety, we go into the Swiss franc, we’ll go into potentially the Japanese yen, but it will definitely go into the Swiss franc. So it’s a bit of a standoff between the dollar and the Swiss franc, but for now, uh, we’ve got our yearly, our monthly, our quarterly, they’re all stacked below the current price. So our line in the sand is that yearly opening price, and that’s coming in at about .8410. As long as we’re holding above that, longs are viable. The VP indicators are supporting that, but my optimism on further upside on this pair remains heavily guarded while this conflict in the Middle East rages on, so be careful with that. But the main thing is, use your proper anchor points, guys, the current monthly, the current yearly, and even the current weekly opening price is very powerful. If we’re staying above the weekly opening price, it tells us the buyers are in charge, but if I move that weekly opening to a random 5 days, then I’m basically lost in translation. So once again, uh, many different ways to do things, but also the T cross long, 8493, could be a tall order for us to hold above this, but we will reassess next week’s outlook, but for now, there is a bullish bias in this pair.
British Pound versus U.S. Dollar
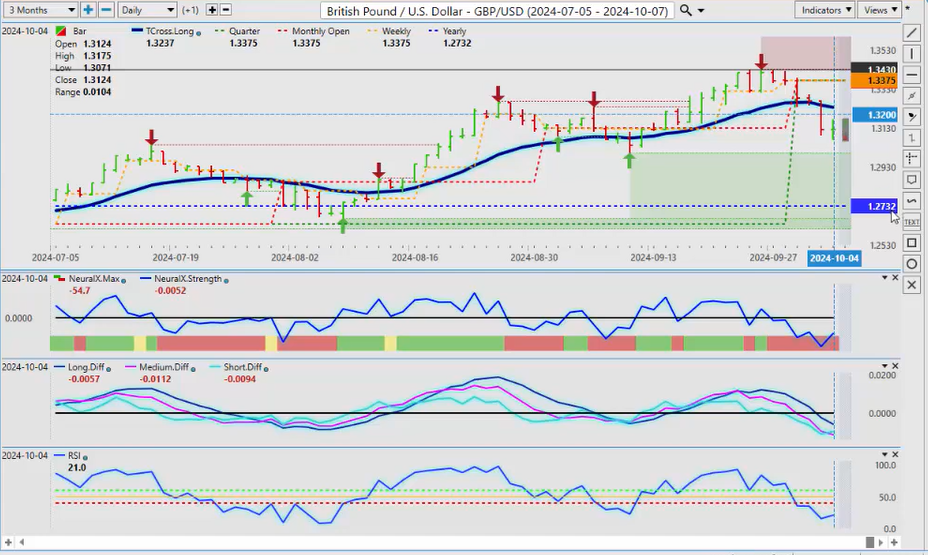
Now, the British Pound US Dollar, 1.2732 is possible, guys. It’s possible, but if we get down to that area, that’s going to be a buying opportunity into year-end. The Bank of England also getting a little more dovish now. That’s put a bit of pressure on cable here, so we’ll see where this goes, but my concern is that reverse check mark on the neural index strength. While the neural index is down, the neural index strength is saying, ‘Whoa, wait a minute, we’ve got a little bit of underlying strength here.’ So we’ll monitor this one, and you can see the predicted I RSI starting to turn also. So the main thing is, know your pivot levels. The pivot level there, 1.3237, that’s the big level to watch, the VPT cross long, and then, of course, you can see I’ve got the quarterly and monthly opening price just a little bit higher at 1.3375. So the argument would be, well, we can be short while below these particular levels, but ultimately we would be looking for this thing to turn around probably by mid to late month back to the upside.
U.S. Dollar versus Japanese Yen
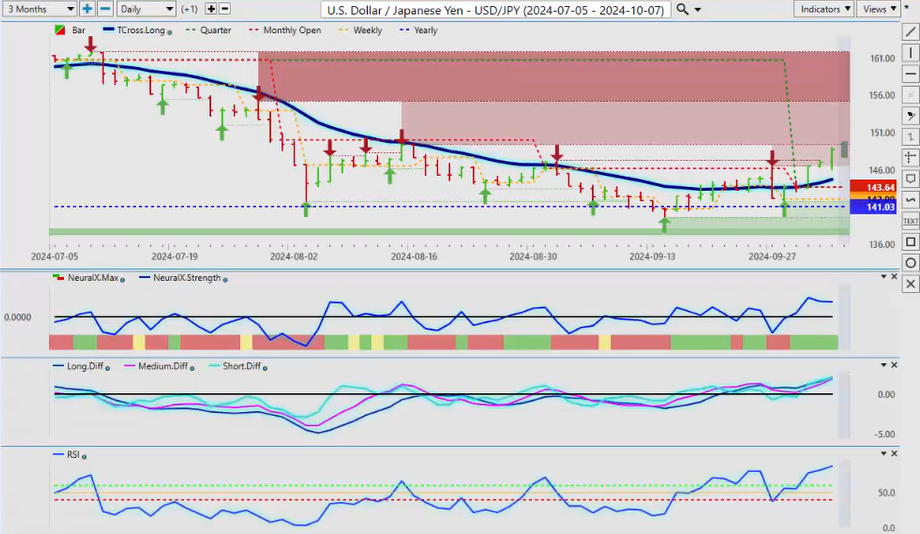
Now the Dollar Yen really taking a hit here. Uh, the dollar yen, the carry trade, well, every time the FED speaks, it kind of changes the rhetoric on the carry trade. He’s ultra dovish one minute, then he’s a little bit hawkish the next, then he’s cutting 50 basis points, he’s not cutting 50 basis points, but again, if he’s not going to be cutting any more 50 basis points, which is what the FED fund futures is showing, then they start to slowly move back into that carry trade, meaning long the dollar, short the yen, on the interest rate differential. But this is not a clear picture, guys. Japan is moving towards interest rate hikes, the US is moving towards cuts, so right now, for this coming week, we have a very significant verified resistance high at 149.32. Keep a very close eye on that particular level. If it’s going to fail, it’ll be just above that level. I don’t believe, even with the interest rate differentials, that we have enough to get back to 155. I believe the Bank of Japan will intervene in some way, shape, or form, likely by talking about rate hikes while the FED pushes rate cuts, trying to unwind this carry trade is what they’re likely going to do. So keep an eye on those two levels, uh, the indicators are still bullish on this pair, but again, that’s why we use verified zones to say, ‘Look, that’s a failure point; that’s a failure point.’ This here, actually, I could argue that this could be the failure point at 147.21, and it’s only a short-term spike, and by Tuesday, we slip below that. If that happens, it confirms that the carry trade is still in trouble here, so we’ll watch it closely, but either way, by the end of the week, I suspect at the very minimum, we could retest that 144.65 area.
U.S. Dollar versus Canadian Dollar
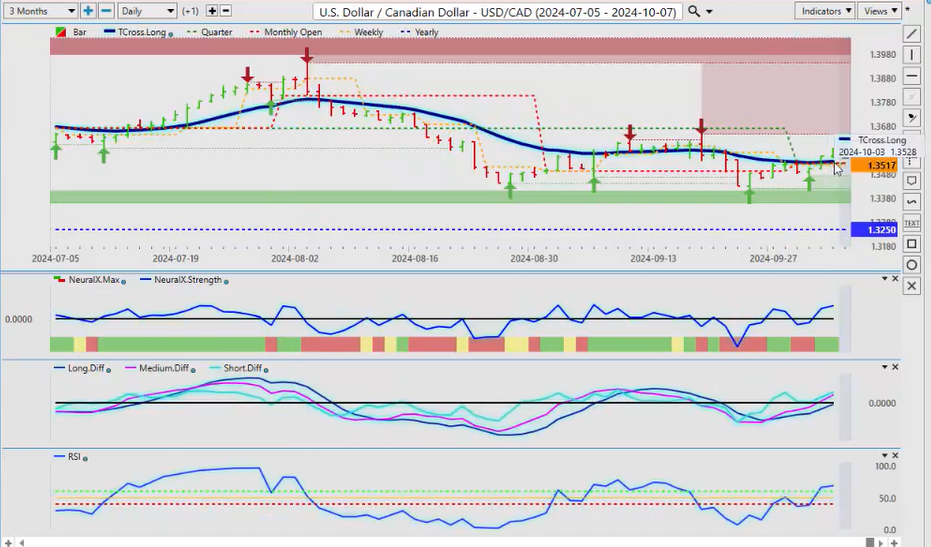
Now, when we look at the US Canadian pair, uh, what this is another thing that tells me that oil prices have limited upside because this should have been a positive for the Canadian dollar with oil prices rising, and it’s not. The Canadian dollar pushing higher, yet again, above our T cross long. We’ve remained above the yearly opening price, the pretty much the entire calendar year; this pair has been positive, meaning people are buying it. So right now, our T cross long, 1.3532, uh, you can see that I’ve got the quarterly opening price sitting at about 1.3526. If we can hold above this level, then longs are viable. I believe that they’re still some upside left here, uh, because again, the Canadian economy is not doing that well either, uh, tied to the US economy, uh, we’re still trying to determine if you’re going into a recession, you’ve been in a recession, there’s pretty strong arguments on both sides. My view is that the US has been in some kind of small recession for about the last eight months. That’s why the jobs number was so distorted. When there was actually lost a million jobs, not you didn’t gain a million jobs, you lost a million jobs. So Friday’s jobs number also very high on the leisure and hospitality and the health side. I think about 50,000 of those u3 numbers, that’s where they came from. So the rhetoric can change very quickly in these current mark conditions, conditions, but remember, we always look for dollar weakness going into towards December. We’ve just got to get the ball rolling, which is likely coming in the next week or two, at the latest.
Australian Dollar versus U.S. Dollar
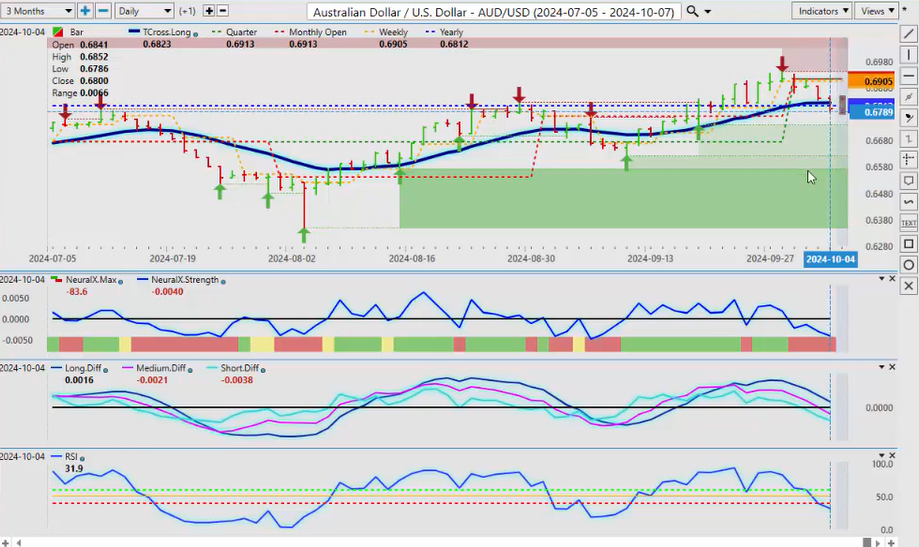
Now again, when we look at the Aussie pair, the Aussie has made a pretty big push past its yearly opening price, but again, it lost it on Friday. So the question is, can we stay below this? So I know there’s a lot of people watching this that are trading this particular pair, and it’s very strong. There’s a very, very high correlation to the global indices; if they turn around and go higher, which the VIX is not really supporting at the current time, but if they turn higher, they will pull the Aussie up with it. People will buy the Aussie, they’ll buy the Cad, and they’ll buy the Kiwi. So right now, we can see we’ve slipped just below that yearly opening price again, at at 0.6812. This is where the battle lines are going to be drawn, right around here. And what’s particularly interesting is now, we have the TR cross long at 0.6823, so this, if it does pull back, we are looking for a buying opportunity. I don’t think we’re going to get as low as 0.6622. It would take the equity markets crashing for that to happen, which is possible under the current global conditions, but for now, we’ll see if, for this coming week, the indicators are turning bearish. We’ve got momentum building to the downside. We’ve got a short and a medium-term crossover, but we don’t have a long-term crossover, guys, and that’s the beauty of looking at these predicted differences. We want all three of them below the zero line, so again, we’ve got to be very, very cautious around this particular time. And in most cases, the Aussie would get stronger into year-end.
New Zealand Dollar versus U.S. Dollar
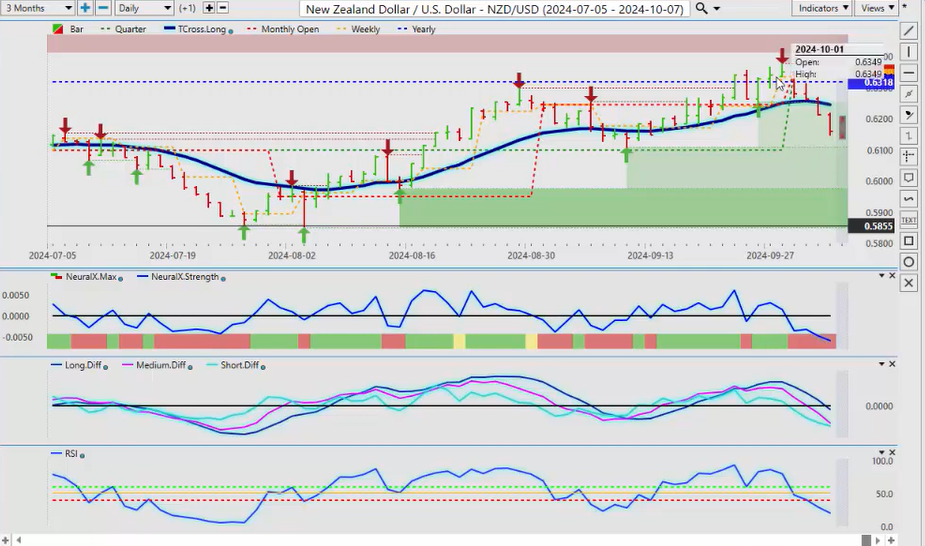
A very similar situation with the Kiwi; the Kiwi, though, really did struggle up against that yearly opening price, and it’s failed since then, and it’s accelerating down faster than what the Aussie is. So this is, I believe, coming from the Aussie New Zealand pair, and the Aussie New Zealand pair is moving higher; that means they’re buying Aussie us and they’re selling New Zealand us to buy the Aussie New Zealand pair. So if Aussie New Zealand starts to move lower, and I can briefly show that on here, right now, it’s moderately bullish, but you can see that we’re coming up against a very strong level, 1.1041. If we fail at this particular level, then New Zealand us longs are the ones you want to look at, and that’s how the cross pairs can affect the G7 pairs. So with that said, this is the VantagePoint AI Market Outlook for the week of October 7th, 2024.