


Welcome to the Artificial Intelligence Outlook for Forex trading.
VIDEO TRANSCRIPT
U.S. Dollar Index
Okay, hello everyone, welcome back! My name is Greg Firman, and this is the Vantage Point AI Market Outlook for the week of September 23, 2024. Now, to get started this week, we will begin where we always do—with that very important US Dollar Index.
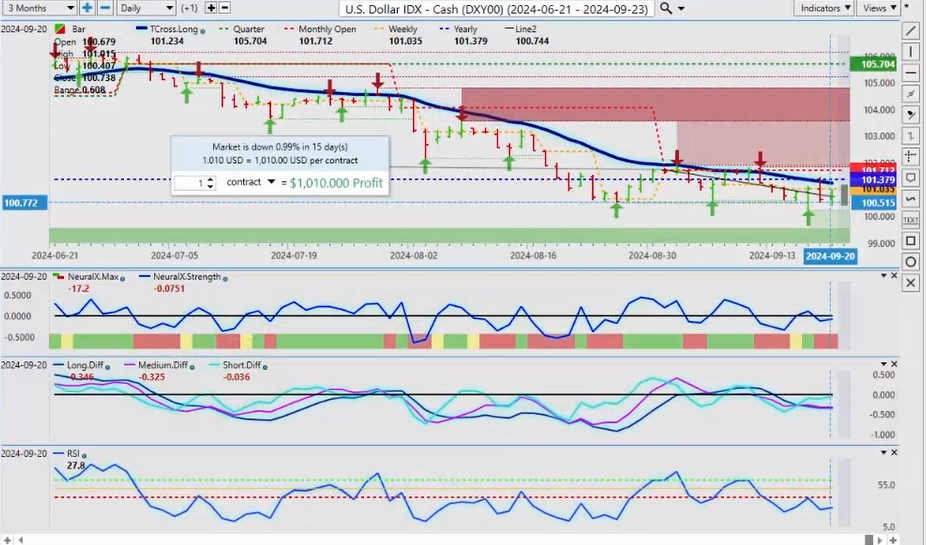
Now, the dollar is taking a bit of a hit. The FED surprised the markets with a 50-basis-point cut, but once again, it’s open for interpretation what he actually said. They’re talking now about bigger cuts coming, but in fact, what I heard him say was 75 basis points in total for 2024, and it’s data-dependent. So, while the dollar is down, it may not necessarily be out just yet.
In most cases, the seasonal pattern of dollar weakness is after October—the about October 5th is when it really starts—but right now, we’re below our yearly opening price. Our T cross long is also crossing over our yearly opening price. We know the dollar is going lower either way in October, November, and December, which are weaker months for the dollar. In the US fiscal first quarter, when the US fiscal fourth quarter ends on October 1st, that’s usually it, but there is required dollar buying during this period. Then, I expect it to move lower.
When we look a little closer at the VP indicators here, we do technically have an MA diff cross to the upside, warning that this initial move to the downside may not be true. We can see the dollar for the month, and once again, it’s very important that we measure performance accurately. The monthly performance in the dollar is down about 1% on the entire month. We don’t want to measure a random four days or five days or 30 days; we need to know exactly where we are in the calendar year, the week, the month, and, more importantly, the quarter. As you can see, the quarterly opening price is also sitting here, right around the 105.70 level.
So, are we going to retrace back to 105 by the end of the month? That is extremely unlikely, but a retracement to the T cross long and the current yearly opening price is very likely, as the market tries to digest what the FED is really doing here and how much further is he going to go with these rate cuts. Again, I think he’s been relatively clear by saying, “Okay, 75 basis points in total,” and next year we know we’re cutting further. So, we’ll see how it plays out.
Right now, there is a very soft buy signal on the actual dollar, and in most cases, the dollar, either way, is stronger at the end of the month and into the first week of the new month, with the overall yearly seasonal pattern into the end of September.
S&P 500 Index
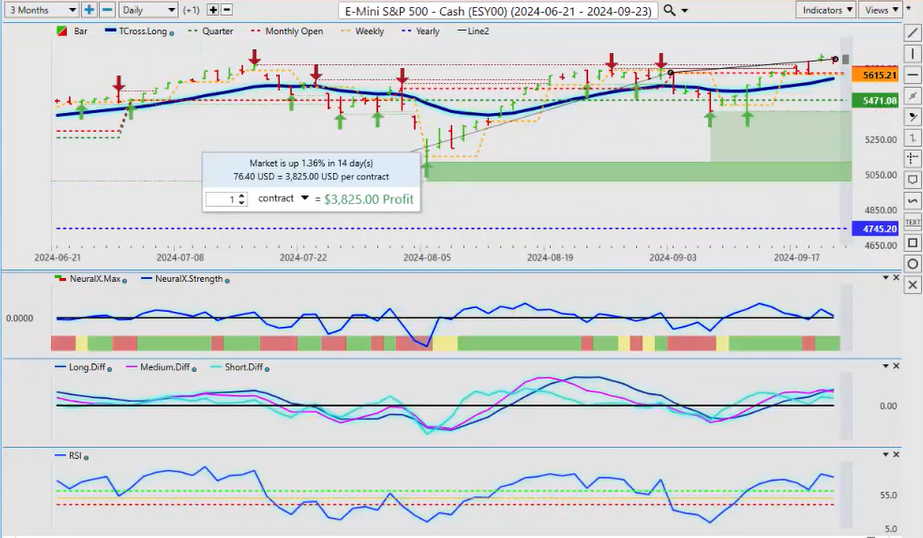
When we do a comparative analysis, it’s very important, again, that we’re not using that lagging rolling performance model or muddying up the waters with where the stocks were rallying or where they weren’t. The stocks have not done well in the month of September at all, and currently, they’re only up 1.36%. We can’t pick our points where we’re going to have our measurement of performance. We do that at the beginning of the year, at the beginning of the month, and, of course, the quarterly. So, when I look at this right now, you can see the S&P 500 is up almost the exact same amount that the dollar Index is down. That, by definition, guys, is intermarket technical analysis.
So again, not a big rally in these stocks like they’re trying to make it out to be. They’re actually still doing better, but again, in most cases, at the end of the month, you will see the stocks come under pressure. I don’t think that is going to change, as the market digests whether the US is going into a recession, whether they’ve been in a recession, or whether it’s going to be a hard landing or a soft landing—all these variables being manipulated by the media.
So, we’ve got to be very cautious here and make sure we have solid anchor points of performance, so we know exactly where we are. The S&P 500 actually just turned positive on September 17, and it’s because of the FED. So, if the market looks at this and says, “Well, wait a minute, let’s re-evaluate,” or, using Fed J Powell’s words, “Let’s recalibrate, shall we?” We can recalibrate here and say, “Okay, well, it’s not quite as strong as it appears to be.” And in most cases, after central bank cuts, their currency initially takes a hit but then gets stronger, so you’ve always got to keep your eyes open—at least until the beginning of October, and we get past this clear seasonal pattern.
As you can see here, the basis of intermarket technical analysis is where we have that very soft buy signal on the dollar. We also have a sell signal forming on the S&P 500 after it made all-time new highs, so that’s something to be very, very cautious about. I would respectfully submit that it’s very likely we’re going to pull back to at least the T cross long, and that would be at 5593. If we click on our F8 in our VP software, the main retracement point, or the intraday retracement point, would be 5652. If we break that, I can give you a secondary target of 5593.
But again, the factual percentage of what the S&P has done in September—it’s very important that we’re looking at that.
Gold
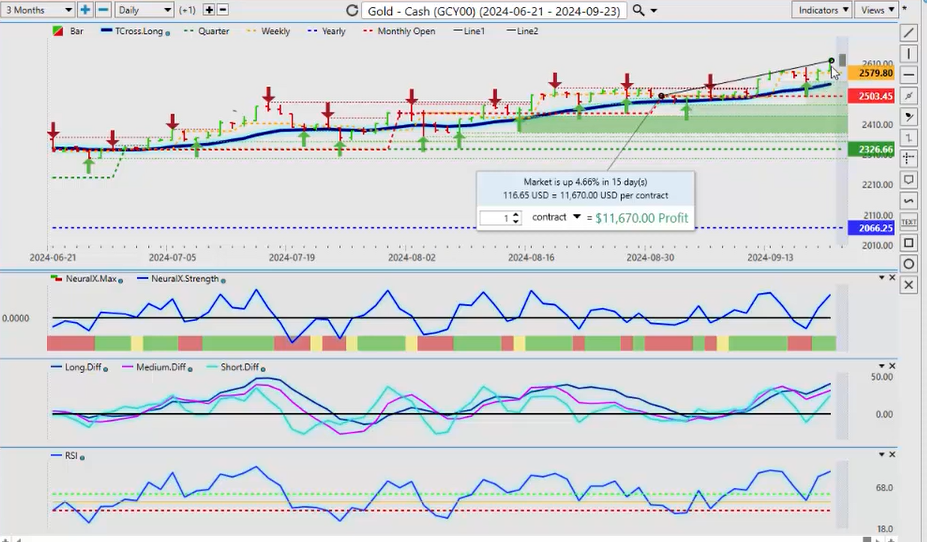
One of the top performers in September is gold, again hitting all-time new highs. The question is: Is it sustainable? I believe yes, it is, going into mid-October, November, and December. Gold usually does very well. Can it extend higher in September next week and the week after? That’s the million-dollar question. The indicators here are mixed; it’s still bullish, but in most cases, when you make a new high, you get a pullback to the T cross long at 2542. So, again, in my respectful opinion only, I would not touch longs until we pull back to at least 2542. It’s very, very important that we understand that.
Bitcoin
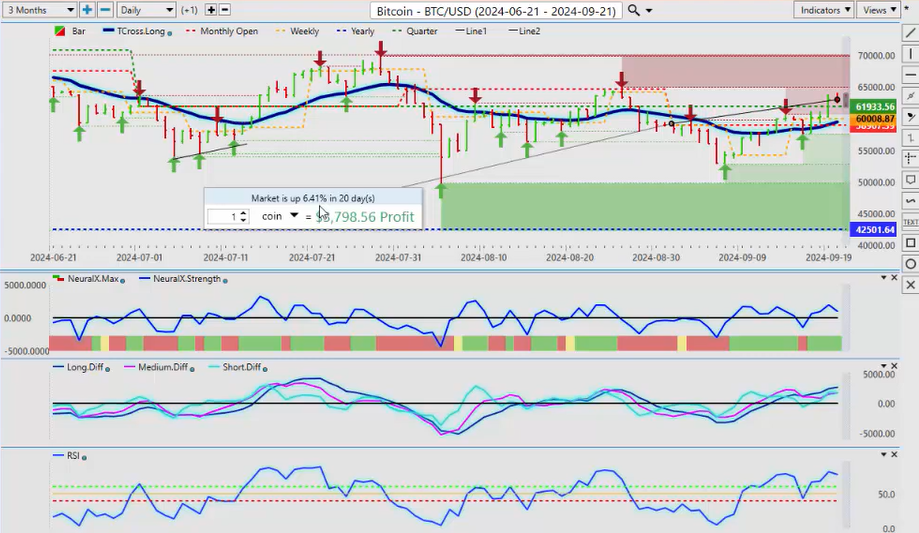
Now, when we look at Bitcoin, Bitcoin, again, is outperforming gold in September. We need facts, not fiction. We can’t randomly pick where our performance is. We start, and we use our anchor point at the beginning of the month so we know exactly where we are. Now, with Bitcoin, in most cases, as I’ve said on these outlooks for many, many years, October is a strong month for Bitcoin. So, I could see a significant pullback. Again, we’ll use our anchor point of the monthly opening price and the T cross long, both coming at around 59,500 in October. But for now, you can see that the neural index strength, the predicted RSI, and we did have an MA diff cross over here the other day. So, I do anticipate a pullback right around that 60,000 mark. But I will throw it out there—it’s still possible we could get into the lower 55,000 mark or the lower 50,000 mark, excuse me, by the end of the month, but if we’re that lucky, guys, it would be a fantastic buying opportunity.
Light Sweet Crude Oil
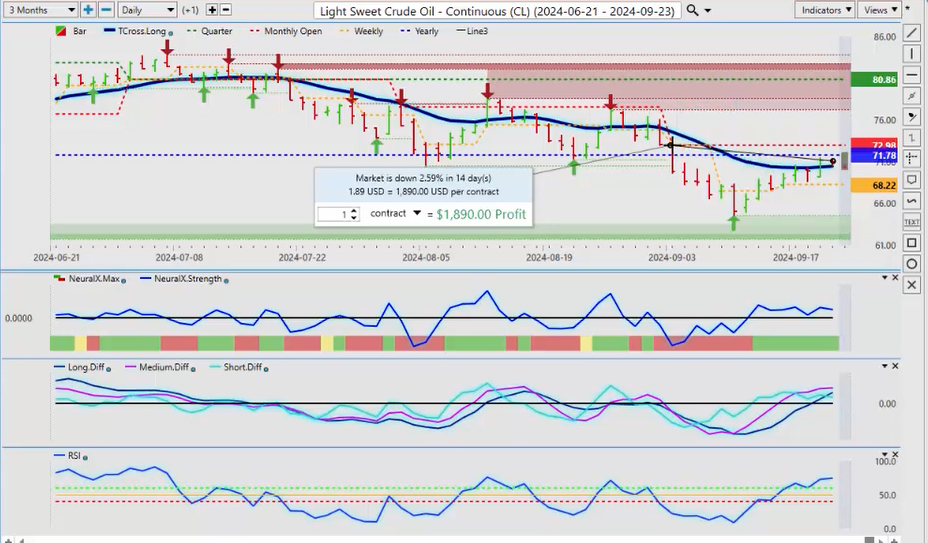
When we look at light sweet crude oil, once again, we have to measure where we are in the month. Oil has done very poorly at 259. Some of your older seasonal tools will say that oil is very strong in August and September, but we can see that’s just not true, guys. We broke the yearly opening price, we tested it multiple times in a very weak August, and then we broke down on September 3rd. We pushed down as low as 64.53, rebounded, but now we’re back up at the yearly opening price at 71.78.
I do think the market’s going to be looking at this and saying, “Okay, are we going into a recession here?” If they do, then, in most cases, oil doesn’t do well. Gold does well. Maybe even Bitcoin will do pretty good, and stocks could be very shaky, as I already mentioned.
But for now, this week, you can see that our medium-term strength is already starting to weaken here, right around that current yearly opening price. The monthly is just above that at 72.98, so all of our resistance is stacked in there pretty tight for potential shorts. But to go long, guys, it’s the same thing as the stock market. We’ve got to get above the monthly opening price. We’ve got to turn positive on the month to confirm that we do have some kind of bullish momentum. But the VP indicators are very sideways on this, and we’re holding at those yearly opening price levels.
Volatility Index ($VIX)
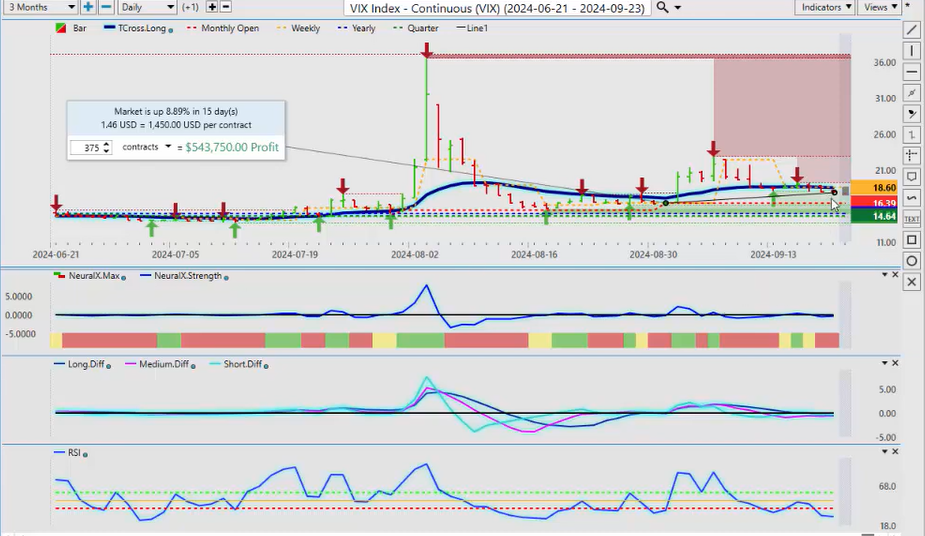
Now, when we look at the VIX, for example, it still remains above its monthly and yearly opening price. The VIX, on September—this is what they’re not telling you, guys—they’ll mix it all up and say, “Okay, the last five days’ performance is rock solid,” but they fail to mention that, oh wait a minute, it actually hasn’t done well in the month, where the VIX is up 8.89%. That is, again, one of the ways we use intermarket technical analysis to gauge whether or not this is actually a true rally in the stocks or if they’re getting ready to turn lower, as some of the Vantage Point indicators have suggested is possible. So, right now, the VIX is holding above its monthly opening price and our yearly opening price, but we are slipping below the T cross long at 18.57. Watch this level very closely. I could see a test of our monthly opening price and then potentially a rebound into month-end.
DAX
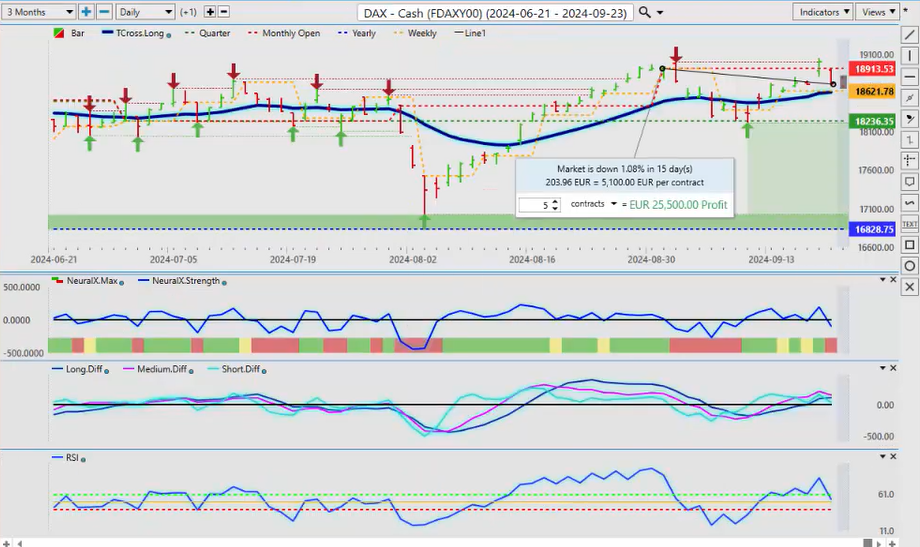
Now, when we look at the European markets—and again, I often bring in the European markets for everybody to show the intermarket correlations—in most cases, the DAX and the S&P 500 have about an 85-90% positive correlation. So, is the DAX warning American and Canadian traders to be careful of their respective equity markets? So again, being down 1.08%, very seldom does this European index correlate with the Dollar Index, so this is very curious. You can see how it tried to break above the current monthly opening price. That’s why it’s very important we use the current monthly opening, not a random five days or 30 days. We need an anchor point, guys, to say, “Okay, this is the performance.” So, right now, this is very curious to me. It’s down 1.08%, potentially on a hawkish ECB with Lagarde. But either way, we’re above our T cross long. If the DAX breaks down below the T cross long at 18,607, I would again respectfully submit—be very, very cautious with the European or North American indices, because they could come under selling pressure, and this may be the warning we’re looking for.
Russell 2000 Index
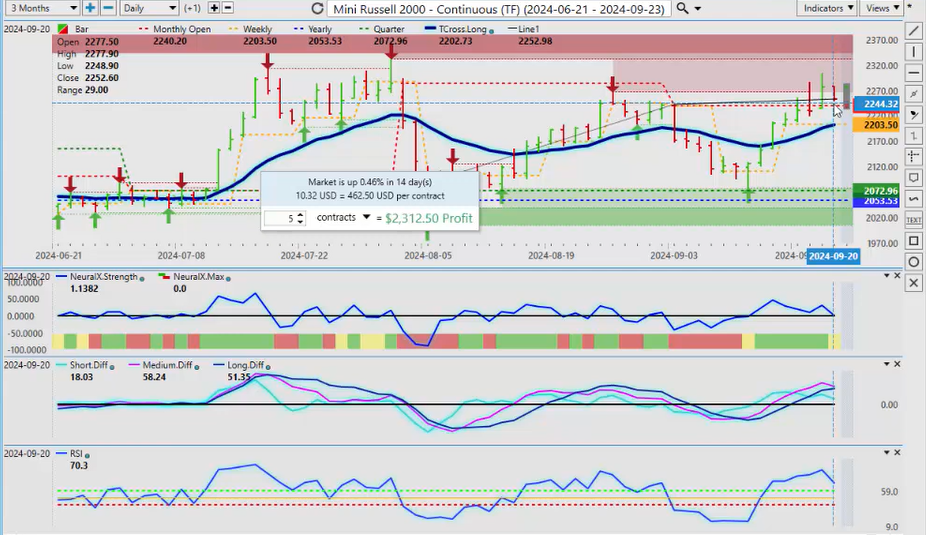
So, if that MA diff cross completes, there definitely could be a bit of a problem here. But one of the ones I will throw in as an added market for this particular week is the Russell 2000. I’m watching this very closely because the small caps, I think, may be able to outperform the large caps because of these rate cuts. So right now, the Russell is above our T cross long, the quarterly, and the monthly opening prices are stacked very nicely down here. We’re holding, at least for now, above the monthly opening price. So, I would watch this as an alternative to the S&P and the NASDAQ. I think that this one is maybe to some degree not getting enough attention, but now that the FED has done 50 basis points, this particular index has my eye. So, watch the Russell this week. Our monthly opening price there is going to come in at 22.40—keep a very close eye on that level to see if we can hold it. But either way, our T cross long at 22.07—I think we have a relatively decent buy down at that particular area.
Euro versus U.S. Dollar
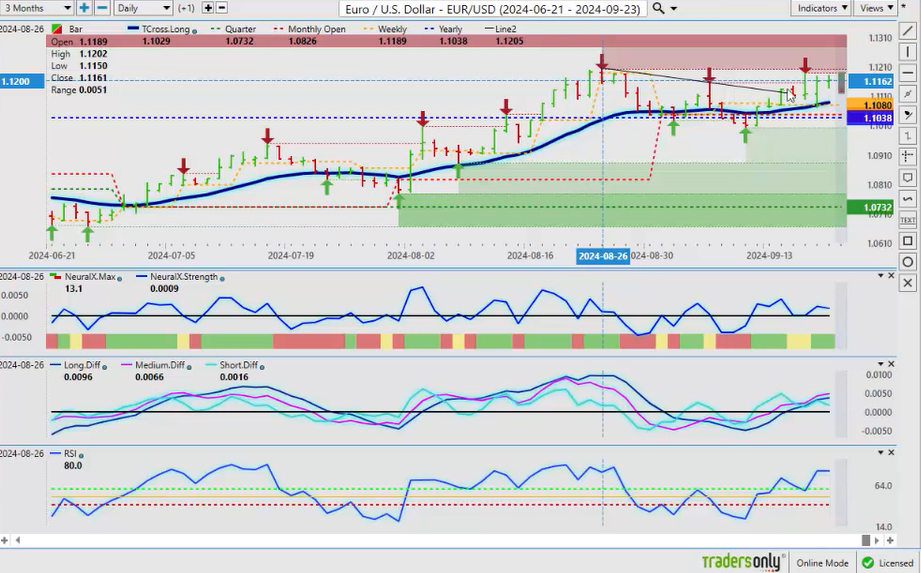
Now, as we look at some of our main Forex pairs going into this week, all eyes again are going to be on Euro/US, which has a 100% inversely correlated relationship to the Dollar Index. As you can see, we’re stalling out here again. This is confusing some of the Forex traders, but the VP indicators are very mixed here. We have the yearly high in the Euro up here at the 1.12 level, but we haven’t been able to make a new high. So until such time as we do make a new high, the probability of a pullback is very, very high going into month-end, potentially as early as this week. Be careful with this one because, again, I don’t think the dollar, at least in September, is just going to get killed. It would have to break down and stay below the 100 level consistently before we would start aggressively buying this particular pair.
U.S. Dollar versus Swiss Franc
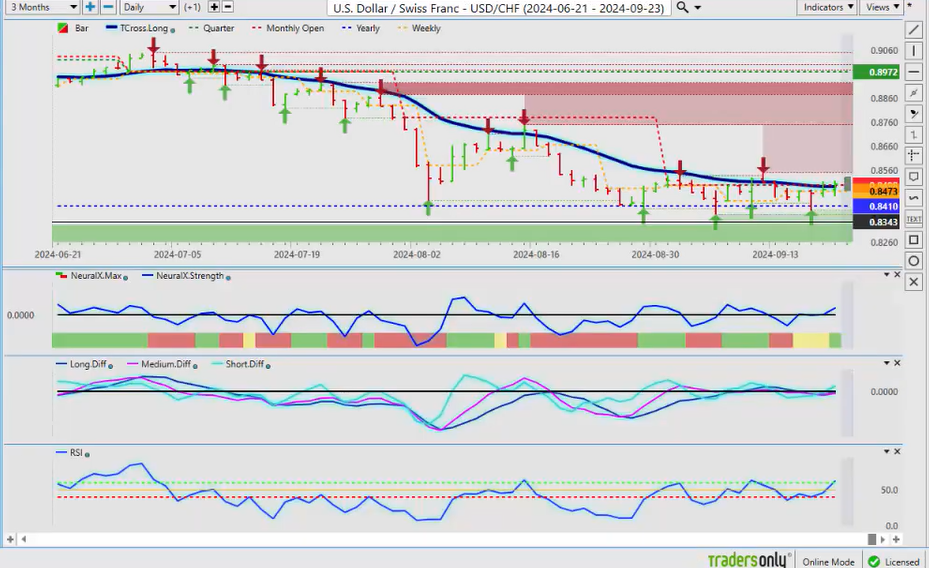
Now, when we cross-reference that to the US/Swiss Franc—now, once again, the US/Swiss Franc is an interesting pair because it’s really made up of Euro/US and Euro/Swiss Franc. That’s really what US/Swiss Franc is. So, as you can see, despite that softer dollar—the dovish… well, some are interpreting the FED as very dovish—I could interpret parts of what he said as quite hawkish. So, tomato, tomato. We’ll see. But again, he hasn’t been clear in the last year and a half, so I’m not going to bet everything on him, meaning J Powell.
So, right now, this pair is actually showing signs of dollar strength, but that would have an expiry date of about early October. The indicators are suggesting there is momentum building to the upside on this particular pair, which would inversely push Euro/US down, not up. So, be careful, and don’t think it’s an easy short on the US dollar because, at this time of the year, I don’t believe it is. We need to be a little bit cautious, but you can see that there are still some signs of life in the dollar against a very sought-after currency like the Swiss Franc. So, be cautious with this one.
British Pound versus U.S. Dollar
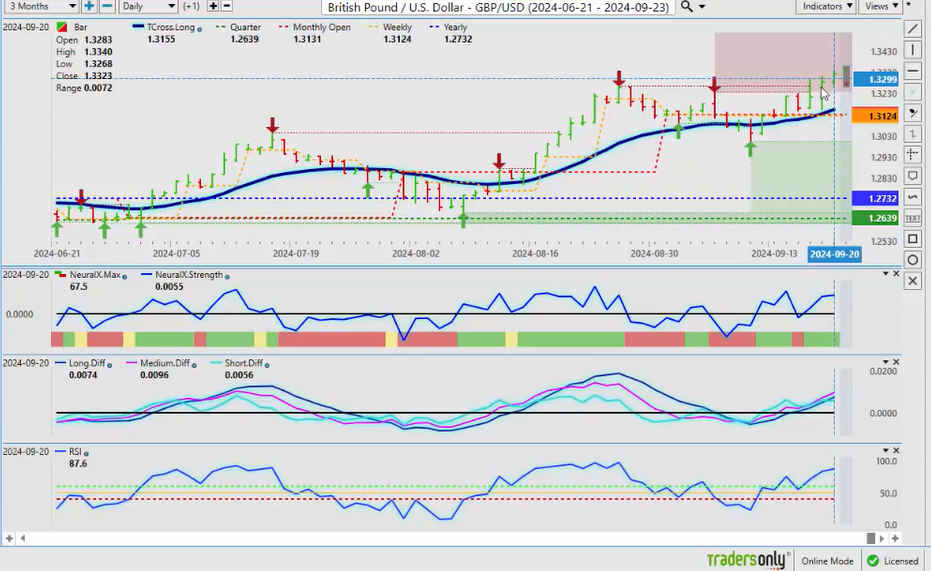
When we look at the Pound/Dollar, once again, the Pound/Dollar is making a big push. The Bank of England is not cutting any further, but they will be cutting, guys. Regardless of what they say, they will be cutting. So, I believe that, either way, the Pound/Dollar goes up in mid-October, like it’s done in many other years, due to that seasonal pattern of US dollar weakness. Right now, everything does look structurally fantastic—the quarterly opening, the yearly opening. All of the action is going to be down here at the monthly opening price, which is coming in at 1.3131, and our T cross long is at 1.3155. We would be buyers down at that particular area, assuming that the dollar remains under pressure after early October.
U.S. Dollar versus Japanese Yen
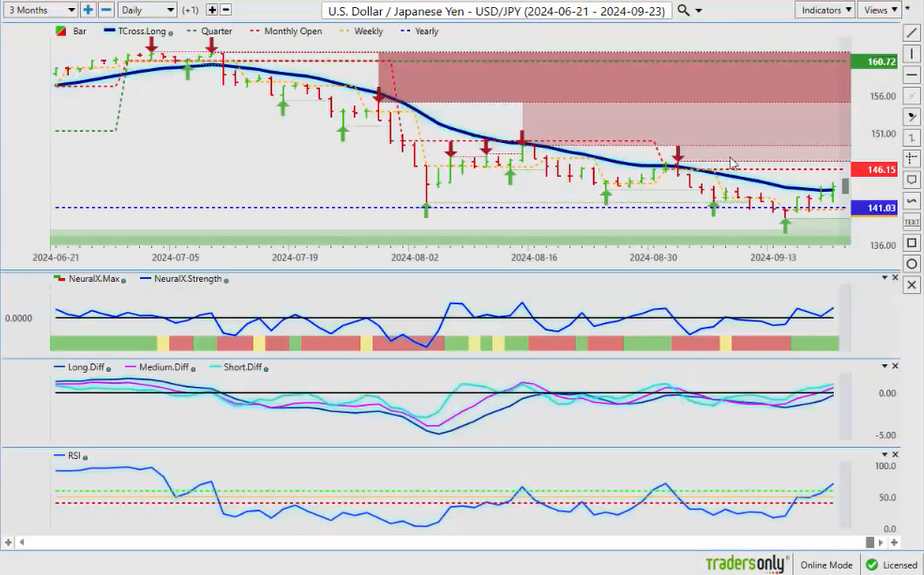
Now, the Dollar/Yen is the one I get more questions on than any other Forex pair—the carry trade. Again, the Bank of Japan did not hike, and the FED did cut, so it did alter the interest rate differential between them a bit. But it is showing signs of bullishness. However, here’s my opinion, and it’s my opinion only—we would have to clear 146.15 and stay above this in order to buy this pair again. I believe the interest rate differential will continue to change between the Bank of Japan and the Federal Reserve well into 2025, and the carry trade will start to come apart at the seams. When that does happen, this pair can drop very, very quickly.
While the indicators are moderately bullish, once again, that would be a very short-term play. I will further point out that the Swiss Franc and the Japanese Yen have a very high correlation to gold. So, when gold completes its pullback and starts going higher, we look at buying Yen, buying Swiss Franc, and shorting dollars. That’s the intermarket connection here, guys, that most indicators struggle to tell us—understanding how the interest rates play into all this. So, right now, we’re holding below 146.15, and I don’t believe we will overtake that level. If we do, it will be very short-lived.
U.S. Dollar versus Canadian Dollar
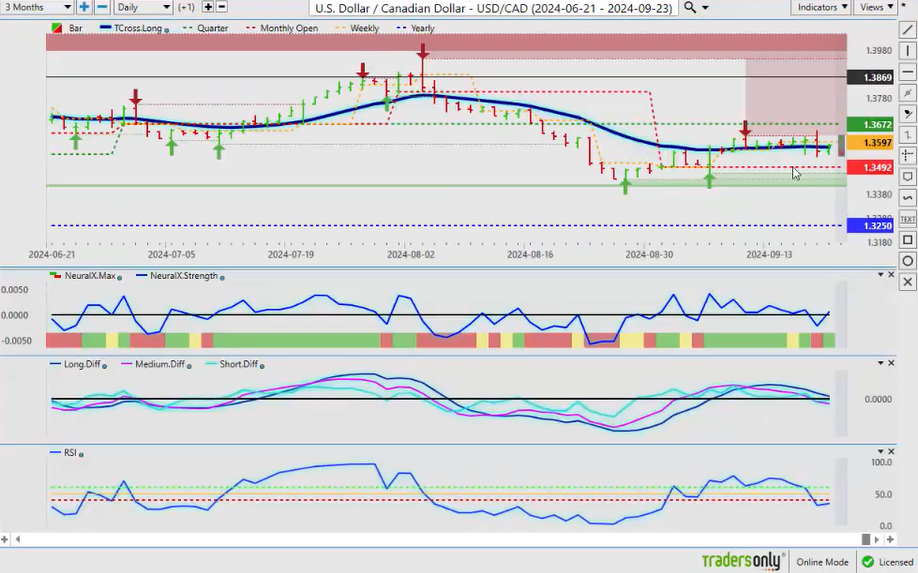
Now, when we look at the US/Canadian pair—once again, the Canadian dollar really has not done well at all, and it’s unlikely that it will. There’s election talk here in Canada again, so there’s going to be volatility here. But if stocks and oil move lower—more specifically, if stocks move lower, even temporarily—it will push this pair up. You can see the battle lines are drawn right along the T cross long. We have the quarterly opening at 1.3672, and we have the monthly opening at 1.3492. That’s what you’re playing here, guys, okay? We’re looking for a break on either side of that, but I actually believe it will probably break to the upside, at least up until early October. The indicator—the reverse checkmark on the neural index strength—is warning of that, but we do have an MA diff crossover here. The medium-term crossover has taken place, but the long-term crossover has not completed, guys. So, we need to be very cautious around this particular area, as we’re flattening out on the predicted RSI. So again, if the S&P, the NASDAQ, and the Dow start to drop or come under pressure, then the Canadian dollar, the Aussie dollar, and the Kiwi dollar will all come under pressure, right?
Australian Dollar versus U.S. Dollar
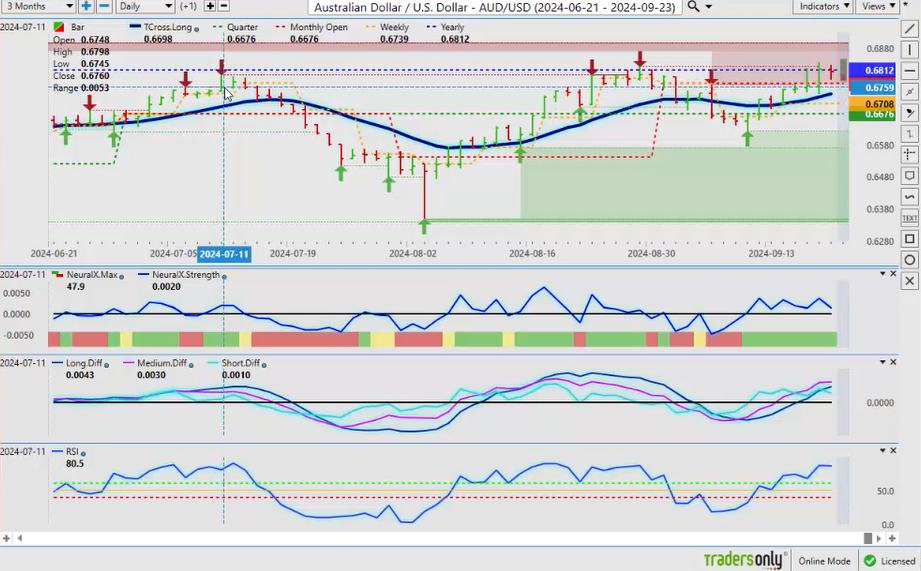
When we cross-reference that to the Aussie pair, we can see that they are battling it out at the current yearly opening price, and this is why I have stressed the rolling performance model. Saying, “Okay, well here’s the performance of US/Canada from this bar to this bar, and this is what they will try to sell you on.” That’s not factual, guys. The Aussie has not been able to turn positive
for the better part of the year. It tried again over here in July; it tried multiple times here between August 23rd and August 29th, ultimately failing again. Now, to this point, I do believe we will ultimately break through the yearly opening price at 0.6812, but we need to push through this area before we start buying this pair, because there’s always that risk of a significant selloff over the next couple of weeks if equity markets slide.
So, keep an eye on 0.6812—that’s the main level. The indicators on VP show our neural index strength is starting to pick up on something, guys—that’s all I can warn you about. The intermarkets are showing there’s a little bit of trouble here. When you connect the dots to the current yearly opening price—again, a lot of people will argue and debate, “My indicator is better than your indicator; my system is better than yours.” Guys, we need price action to tell us. We’re not going to debate whether it’s bullish or bearish. What is its performance on the month and on the year? Here, it has not been good. So, if we can turn positive, which I believe we can, then ultimately, Aussie/US will be a very good long into year-end and likely into 2025. Right now, you have to be cautious.
New Zealand Dollar versus U.S. Dollar
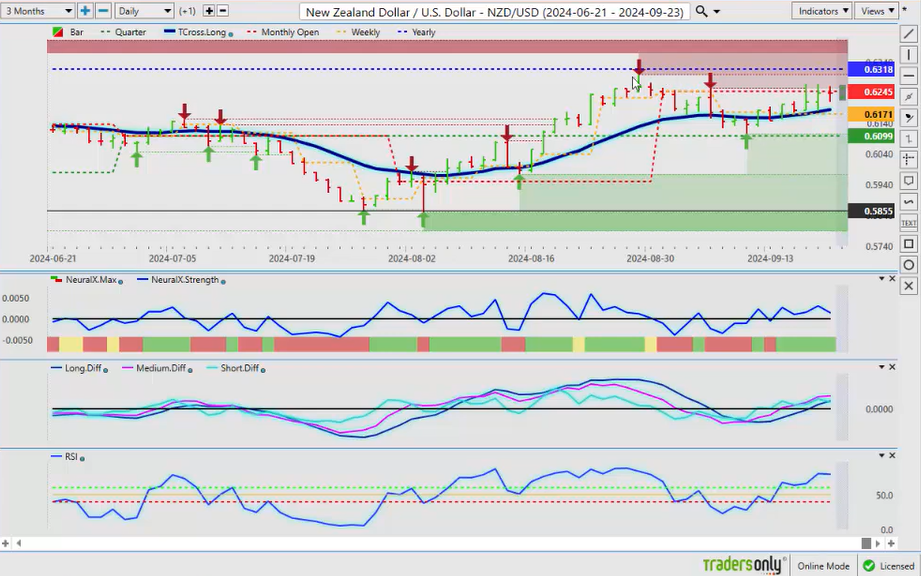
The same goes for the Kiwi with New Zealand/US. This is not a coincidence, guys, that it failed at the yearly opening price. It came back, retraced to the VP cross long, and now it’s gearing up for another run at 0.6318. But we’ve got to push through that. If we can’t push through it, then there’s always the risk of a selloff.
So, the indicators—again, we’re still in a fundamental trading situation, and how the market’s going to digest the FED—it usually takes three, four, five days for the market to really look at this and say, “Okay, what did J Powell really say? What do we think he’s going to do?” But at the end of the day, I heard the same rhetoric: The labor markets are improving, but it’s going to be data-dependent. So, data could change things very quickly, in fact, as early as next week on some of that PCE data.
So, with that said, this is the Vantage Point AI Market Outlook for the week of September 23, 2024.


