


Welcome to the Artificial Intelligence Outlook for Forex trading.
VIDEO TRANSCRIPT
U.S. Dollar Index

Okay, hello everyone, and welcome back. My name is Greg Firman, and this is the Vantage Point AI Market Outlook for the week of September the 9th, 2024. Now, a very choppy, volatile week this past week, but the dollar is trying to recover here despite a very poor non-farm payroll number. Again, but in my respectful opinion, only 142,000 jobs is not as bad as what they’re making it out to be. Now, in most cases, the US dollar is strong longer in the month of September due to that fundamental of required dollar buying, which usually ends around the third to fourth week of September. So, with that said, let’s look at the indicators in VP. We’ve come up at a full retraction to our T cross long, then we have failed, but on Friday, even after that payroll number, the dollar closed higher on the day. That is very interesting. When we look at the neural index strength, it’s pointing up with the neural index, and as you can see, the medium-term diff and the long-term diff, which is measuring the strength of the medium and the long-term crossover, has not completed to the downside.
So, once again, we will monitor this, but what we’re really looking at is the current yearly opening price. Can we hold and get back up above this 101.37 area? ‘Cause again, there’s a bit of a mixed yearly opening price, one based on the Asian open, the other one based on the New York open. The Asian open for the dollar Index on the calendar year, I believe, is 101.05. So, I would keep a very close eye on that, but for now, once again, the dollar may be down but not out.
S&P 500 Index
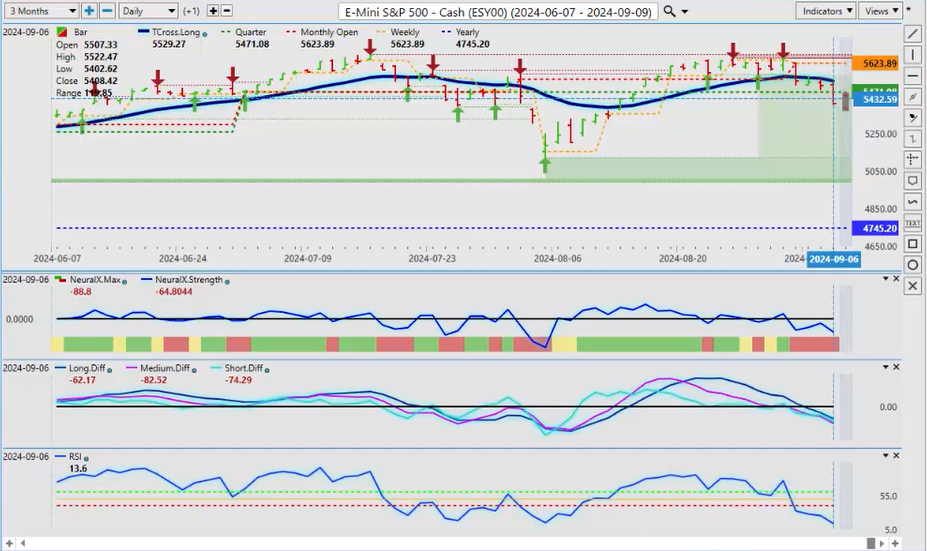
Now, when we do a comparative analysis to the equity markets, more specifically the S&P 500, you can see that it responded very negatively to that labor report. But again, in my respectful opinion only, this started right at the beginning of the month. When we look at the beginning of trading on September the 3rd, the equities immediately started moving lower, crossed below the T cross long on the very first day of trading, multiple retracements to the T cross long, and then a power selloff on Friday as recession fears begin to surface. The reality of a likely recession is coming. Not only that, why is the Fed not cut when all of the other central banks have? Now, the specific outlook here for the equity markets, we’ve again failed at the yearly opening price, but we are still very much positive on the year, 4745. My concern is that there are a lot of factors at play here: the economic data, the Fed. Is there going to be a recession where stocks usually do very poorly, and it’s gold that does better? So, right now, uh, we’ve also broken down below that very important quarterly opening price, 5471. That’s the area we want to keep our eye on to begin the week, to see if we can turn positive on this quarter. But as I’ve already stated in multiple outlooks, stocks usually don’t do well either way in the month of September, and that has been, uh, again picked up in the VP software on the very first day of trading.
Gold

Now, when we look at gold, once again, I believe, well, I think we’re four or five weeks out from gold Longs that could come earlier with the Fed cutting. Assuming he’s going to, for sure, now, uh, I don’t think he’ll cut 50 basis points. I want to take that off the table. I think he will go slow and steady, data-dependent. I get this question on a daily basis, uh, but I think that would be a disaster if he goes 50 basis points. So right now, uh, gold should have actually have finished the day considerably higher on Friday, and it didn’t. We’re right on the TR cross long. We’ve got a verified resistance high that’s 2527. It will be very difficult for gold to make gains above 2550 this month, 2560 at best, uh, unless something dramatically changes to push money into gold earlier, but I believe they will buy dollars first. So right now, for the next TR, for next week’s trading, we’ve got our high 2527, and we’ve got our T cross long sitting at or about $2490. These are your areas we must stay above this T cross long, but as you can see, the VP indicators are telling us gold is moving lower, and from a seasonal perspective, if nothing else, and the inverse correlation to the dollar Index, then I believe these indicators to be correct, that gold is likely to break down below 2490, uh, probably by midweek. However, on the flip side of that, if it does hold, then definitely, uh, there could be, uh, Longs there, but I also think it won’t be until mid-October until gold really starts to regain that momentum or potentially after we get the Fed statement later this month.
Light Sweet Crude Oil
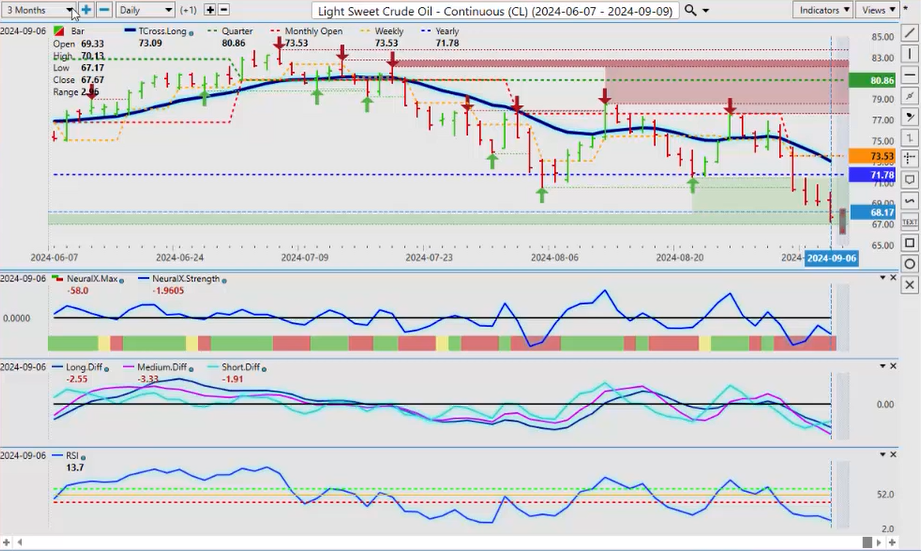
Now, light sweet crude oil, again, I’ve talked about this repeatedly over the last several weeks that August is not a month to be buying, uh, light sweet crude oil or Brent, but it is a good month to start getting long on nat gas. There is an inverse correlation between oil and nat gas. I have very strongly emphasized that, that inverse correlation, and that oil, the oil seasonality is back in May, June, July, and we start to get to the end of that seasonal pattern around the beginning of August, and as you can see, in the month of August, oil did not do well at all. So, I believe the indicators, however, now are getting a little bit stretched to the downside. We could see some recovery, uh, on here, here, but right now, if I believe too, like the equity markets, oil is responding to that US Labor report and is further thinking, look, we are moving, if we’re not in a recession already, we are moving towards that, and it may not be a soft landing. And again, there’s not a lot in that, not a lot of positives in that labor report, uh, the unemployment rate did tick down a bit, but I will argue the U6 number ticked up to 7.9, which will likely invalidate that, that rise, uh, or that move lower in the unemployment. But the indicators right now are still saying yes, we have more downside. What I will say is that the further we move away from the T cross long at 7, 7309, the more likely it is we’re going to retrace back to that area. Now, the yearly opening price sits at 7178. That will be the hurdle for oil and also the likely first retracement point, point.
Bitcoin

Now, when we look at Bitcoin, once again, Bitcoin has a known seasonal pattern, and that usually begins in or about the third to fourth week of September, so I would be looking for long trades here, potentially as we move into September, but the latter part has been the better play, at least for me. The yearly opening price, 42501, uh, we’ve got a verified support low that’s coming in at, keep an eye on this area here because I believe that’s where we can get our bounce this later this month, and it’s, I don’t think it’s a horrible long where it is right now, uh, the ma diff cross is picking up on something here, but, uh, again, we are going to have another volatile start to the week, but watch this level very closely, and then I will be looking for an MA diff cross to start moving back towards that zero line. The predicted RSI, 5.6, not suggesting we’ve got a lot of downside here. Now, it can still move lower, but that’s why we use the verified zones to identify a potential buying area or just below that where they could be setting up that potential be trap.
Volatility Index

Now, when we look at the VIX, again, the VIX plays into everything we’ve discussed here. H, and as you can see, what I’ve talked about over the last several weeks, the VIX holding above its yearly opening price at 1486, and now we’re starting to extend higher. Do anticipate the VIX is likely going to move higher next week. There isn’t. We do have the, the US CPI number. I don’t think that’s going to help stocks much either, but we’ll see here. I believe stocks can recover towards the end of the month into October, November, December, uh, but that will depend on what the Fed’s plan is here. What is he going to do? What’s his out? What’s his outlook for the economy? A lot of different factors, but for now, this signal on the VIX actually is just starting, guys, so be very, very cautious next week on your stock index trading and your individual stocks, also.
DAX
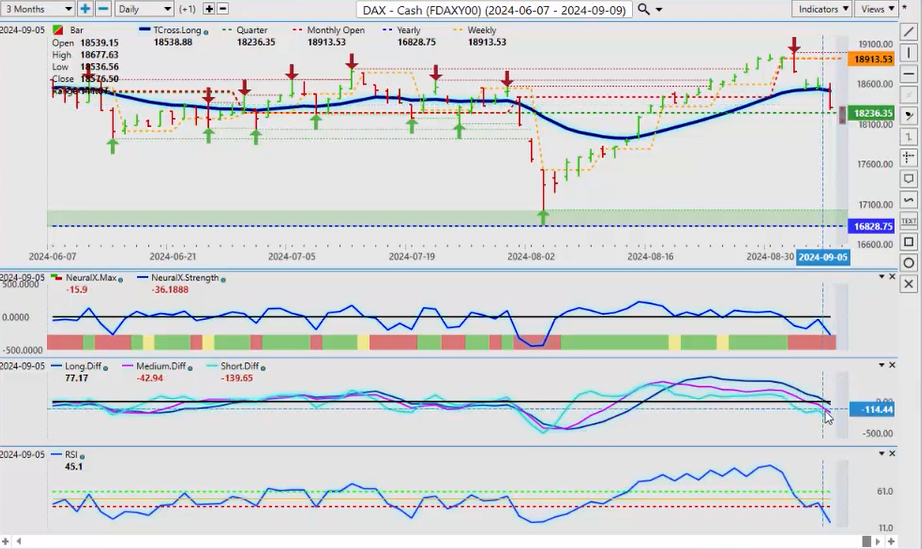
Now, when we look at the European markets, the DAX, uh, you can see that it is extremely correlated to the U to the US Equity markets, more specifically the S&P 500. Now we’re still above the quarterly opening price at 18,23, but that level is likely going to break early in the week. That’s what I would be cautious of if you’re going to short the major indices. I believe shorting the European market is better than the US market right now because I’m getting slightly better value here. Now, on the flip side, if we hold above the quarterly, then we could see the S&P recover also, but I think that’s very, very unlikely at this stage, and as you can see, the DAX 30 is, its its selloff is just starting, so there’s better value potentially here on shorts than the US indices, so just keep that in mind.
Euro versus U.S. Dollar
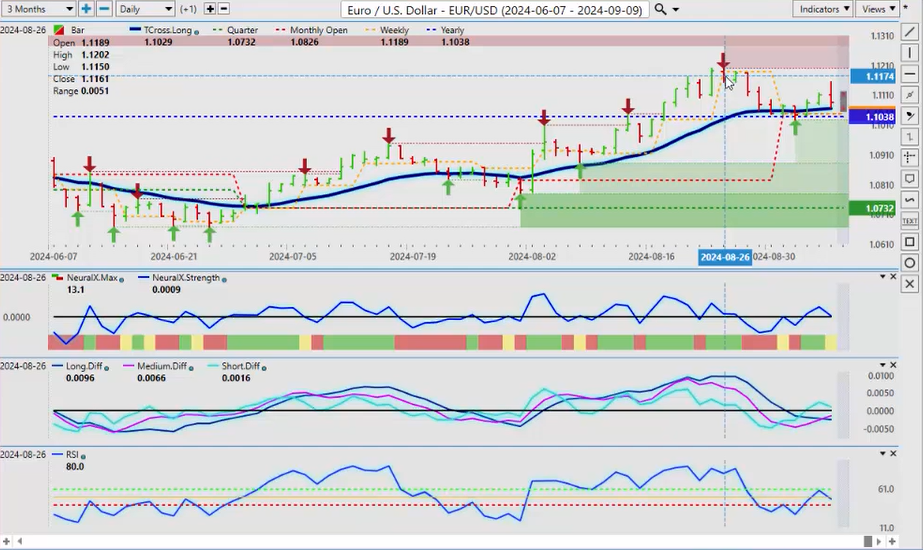
Okay, now when we look at our main Forex pairs, again, with Forex Trading, we’re either buying or selling US Dollars, and I think sometimes we forget that, and we separate these pairs like they’re different somehow. Now, that is US/Canada. I believe is slightly different than the other pairs, but if the dollar Index is going to recover, then the euro/us is potentially going to break our TR cross long at 110.65. Now, you can see this big down Red Bar, the European currency should have benefited from that weaker payroll number and the coming Fed, uh, rate Cuts, but it didn’t, and that’s the power of seasonal patterns. So again, we know exactly where our levels are, our T cross long. If you’re a buyer, you’re buying between 110.65 and the yearly opening price at 110.35. If you’re a seller, just set up your sell limit orders below 110.30, 11030, and that would, and if that order is triggered, then you would likely see that would confirm that we’re still we still have dollar buying in the month of September, so those are your key levels, uh, the ma diff cross has crossed to the upside, but remember, that could just be moving back towards our most recent high at 112, and I would need a clean break of 112, which I believe we could see later in the year, but again, when the US catches a cold, or when the US sneezes, I think the saying goes, everybody else catches a cold, so always keep that in mind. But the main thing is, know your levels, and right now, it’s slightly bearish on the Euro, but if we can hold above these two levels, then you may still have a long, but there is a heavy short bias strictly because of that seasonal pattern.
U.S. Dollar versus Swiss Franc

Now, now with the US/Swiss franc, going into next week, always remember that the US/Swiss franc is going to be affected by the carry trade, meaning the dollar/Yen carry trade. If it sells off, then so will US/Swiss franc, even if the dollar is strong against other currencies like the Canadian dollar, the Aussie, the Kiwi. These are important currencies also, but so is the Swiss franc. So right now, we, there, the bulls and bears have been fighting it out at the current yearly opening price, basically since October the 5th. This tells me that this level is likely going to break either way, even with dollar strength against the other currencies. Equity selling off, that favors money going into a risk-off Swiss franc, risk-off Japanese Yen, potentially, but either way, I believe the carry trade comes undone, and if we are looking to buy dollars, probably US/Japan and US/Swiss franc are not the best places. Okay, so the indicators here are very, very mixed here around the zero line, so our, we know where our retracement point is, the T cross long, 85.25. In my respectful opinion, either way, shorts are reasonable while below this particular level.
British Pound versus U.S. Dollar
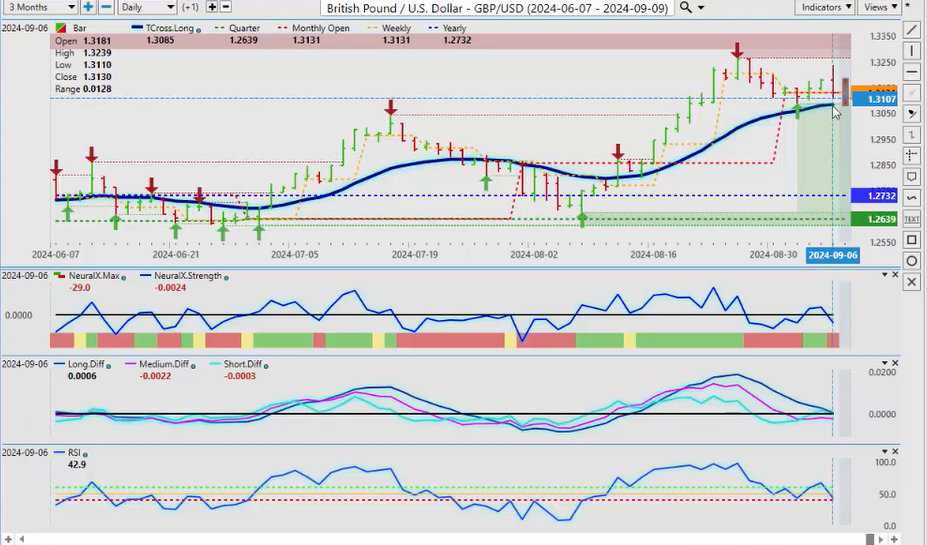
Now, the pound/dollar once again tried to recover this week, and then on Friday, on that payroll number, the direct correlation between the Euro, the pound, the Canadian dollar, the Aussie, the, the New, the, the New Zealand, they all have one thing in common here, and that is they have a correlation to the equity markets, more specifically the S&P 500. If it’s going lower, chances are the dollar is going higher, putting pressure on these other currencies, so keep an eye on the equities, guys, your Forex Traders, you may not know it, but you are trading equities, you just don’t probably don’t realize it, so watch this closely, but I believe the pound could be in a bit of trouble here, too, at least for the month of September, then we’ll revisit it in October, but our T cross long, 1.385. We need to hold above this level, guys, or you’re looking at a, a much, uh, much more significant retracement.
U.S. Dollar versus Japanese Yen

Now, with the dollar/Yen, once again, uh, we are approaching a make or break area, the, the current yearly opening price on this, uh, it’s very, very important, and you can see that we’ve come down close to testing that 141 level, 141.7, but if we break down below this, then we have a very, very good short trade, not only for the remainder of the year but potentially into 2025, so keep an eye on this. The indicators are quite bearish. The, again, the only concern is that seasonal pattern of dollar buying, but it may be unaffected on this pair because of that carry trade coming on, unwound, the, the people that have been borrowing Yen and buying currencies and other things, buying boring cheap money, well, that’s coming to an end, so they’re going to look at that and say, I think we better close down our positions, and then you could really see the Yen strengthen, and that’s, and that’s not even counting that I believe the Bank of Japan could step in here and hike and take advantage of the Dollar’s misfortune. So, we’ll see, but for now, uh, shorts are heavily favored while below 145.62.
U.S. Dollar versus Canadian Dollar

Now, the Canadian dollar, once again, uh, in most cases, this pair goes up in the month of September on dollar strength. Uh, the Canadian economy not doing any better, much worse, actually, than the US economy. The Bank of Canada’s cut multiple times, so when we look at this, our current monthly opening price, 134.92, this is a make or break area. You can see that it’s been holding above this the entire, uh, week, this past week, or the first week of the month, so we, we’ve closed on the T cross long, 135.65. If we break this level, which is very likely on because again, the Canadian dollar is a very high correlation to stocks, stock indexes. If they continue to slide, this pair goes up, not down, and we, the Canadian dollar, also a very high correlation to oil contracts. Oil is slipping poorly, so everything favors the upside here, but the main thing is, guys, if we know our levels, the monthly opening price, 135.92, the areas that are going to contain this, the T cross long, 135.65, and our quarterly opening price up here at 136.72, this is directly what we’re dealing with here, guys, and, and again, if you believe that this pair is going to go considerably lower on dollar weakness, just always remember that, um, the US’s biggest trading partner, Canada’s biggest trading partner is the US, so if they go into recession, trust me, Canada is going to be hit far worse, so it does favor the upside. The VP indicators are confirming that. We’ve got some momentum. Always remember that. I’ve talked about this pair. It has a classic Monday Tuesday reversal, so whatever it does on Monday by 10, 11, in the morning, it usually moves the opposite way, so we would be looking for this pair to move lower on Monday, so potentially we could buy it on Tuesday because remember, also, this is an outlook, not a recap of something that’s already happened.
Australian Dollar versus U.S. Dollar

Now, the Aussie and the Kiwi are going to fall into this are likely going to suffer the same fate as the Canadian dollar, and you can see we’ve had massive failures at the current yearly opening price, 68.17, approximately. I’ve been talking about this level all the way back since July, that this is the area we must break. We have failed at this again. Now, we’ve lost our T cross long. The Aussie, to be clear, guys, I know we hear, hear a lot of different things that are not factual from the media, but this pair has never been profitable in the calendar year 20124 for anything more than a few hours, and that was on this day right here, uh, August the 29th. Okay, so be very careful with this one. I think we, we could have some decent long trades later into the, into the fourth quarter, but for now, still carrying a bearish momentum, and the indicators in VP are clear, confirming this.
New Zealand Dollar versus U.S. Dollar

Same as the Kiwi. We can assess that the Kiwi also tried to break above its yearly opening price, turn positive on the year, and it was another epic failure. Now, this is the benefit of the using the predicted moving averages that we have, our T cross long that provides us a price target on the downside,
61.68. If we break this, our next price target is the current quarterly opening, 60.99. We do this in a step formation, but the way that this is looking, guys, the yearly opening price up here, then the monthly, if we break down the below the quarterly opening, it’s a very, very bearish sentiment, at least for the near term. We have a fresh medium-term crossover. Our long-term crossover is about ready to go off, so once again, and we have momentum here on the predicted RSI, breaking the 40 level, so we are going to see a very volatile start to the week, week. We’ve got to deal with the aftermath of the non-farm payroll number, and then I believe the US CPI is on Tuesday, so there will be no shortage of volatility next week, but with that, there will be opportunity. So, with that said, this is the VantagePoint AI Market Outlook for the week of September the 9th, 2024.


