


Register for a Free Live Training
Hot Stocks Outlook uses VantagePoint’s market forecasts that are up to 87.4% accurate, demonstrating how traders can improve their timing and direction. In this week’s video, VantagePoint Software reviews forecasts for SPDR SPY($SPY), Las Vegas Sands ($LVS), Xerox ($XRX), Bluebird ($BLBD), Nike ($NKE), Super Micro Computer (SMCI), GSK ($GSK)
Hello again, traders, and welcome back to the Hot Stocks Outlook for April 11th, 2025. I hope you all have had an excellent week out there in the financial markets. As always, we’re here to take a look at the most recent VantagePoint A.I. predictive forecast. If you haven’t already, make sure you go ahead and click on the link down in the description below so you can sign up for a live demonstration and learn all the specifics about how these predictive technologies and indicators are helping traders make much better trading decisions out in the marketplace.
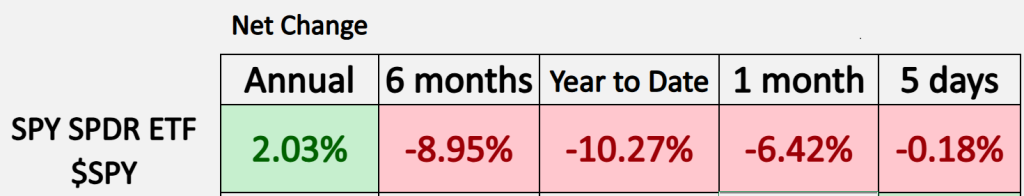
Now, we’ve certainly seen a lot of volatility, and we can see that as we look at the **SPY ETFs**. This gives us our sense of the broader equity space over some of these given chunks of time, and we can see now year-to-date we are down over 10%. This is obviously from a lot of the recent volatility and noise around tariffs. It’s really important to understand where VantagePoint has an edge: regardless of earnings reports, Fed announcements, tariff news, VantagePoint’s predictive accuracy remains extremely high.
What’s interesting about this is we’ve been talking a lot about metals and mining stocks—that’s where there are a lot of bullish signals coming through with VantagePoint. We’ve also highlighted some short opportunities that get accelerated as news hits the market, clearly showing that the forecasts were very bearish in some of these areas.
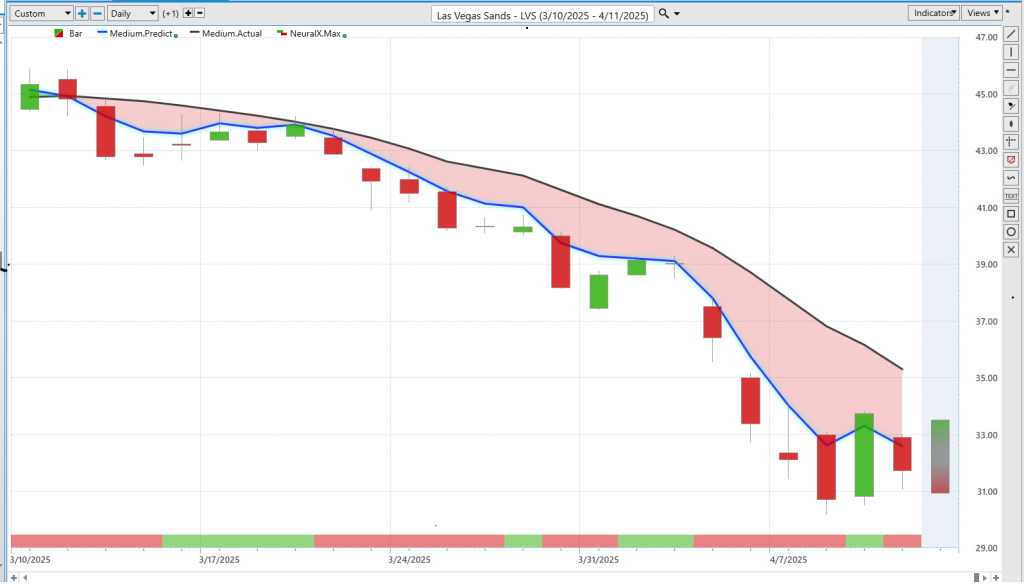
Let’s start out here with **Las Vegas Sands ($LVS)**. This is a great example of how all of these predictive indicators and tools work together. What we’re looking at is daily price action—each candle represents a full and complete trading day. The first thing you’ll notice up against the price data is a black line and a blue line. The black line is the simple moving average, looking back at the previous 10 closes. Traditional technical analysis smooths data but lacks predictive capability.
VantagePoint traders, however, compare that black line to a proprietary predicted moving average (blue line), which forecasts where prices are expected to go next. When the blue line crosses below the black line, it suggests prices will fall, and the trader may look to short, buy puts, or act accordingly.
This forecast doesn’t rely on the past alone. VantagePoint incorporates intermarkets—dozens of markets known to influence future prices—be it ETFs, commodities like gold, financials like the dollar index, or global interest rates. Artificial neural networks analyze this data to create highly accurate forecasts.
With **Las Vegas Sands**, shares are down about 29% since the forecast 23 trading days ago. This has already been in a downtrend and got weaker as recent news hit. At the bottom of the chart is a bar going from green to red, back to green—another neural-network-based indicator tuned to solve short-term (48-hour) strength or weakness.
We also have predicted highs and lows. These tools solve different problems using different neural networks, collectively producing the overall forecast. As we’re in this downtrend, the neural index may turn bullish and we see some sideways movement, but that doesn’t change the overall downtrend. These forecasts help traders make informed adjustments.
You often see moves up toward the predicted high, where you’d consider shorting or taking profits, then movement toward predicted lows. It helps guide traders according to their strategy.

Another example: **Xerox ($XRX)**. You can spot weak conditions in weak markets to focus on the bearish side or hedge the portfolio. This forecast goes back to the beginning of February or end of January. The blue line crossed below the black line and the stock has dropped about 57% over the past 51 trading days.
What makes this exciting is the daily predicted highs and lows. Once you’ve identified a long-term trend, you can do trade management each day. For example, in **Xerox**, there are about 20 days where price hit the predicted high and then traded lower—a testament to the value of these forecasts.
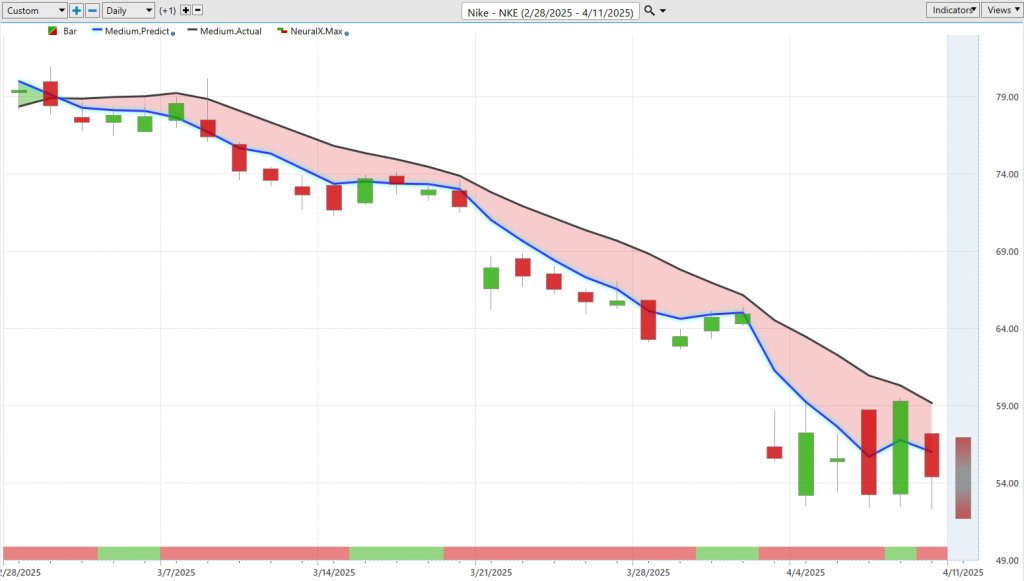
Now, **Nike ($NKE)** is another compelling case. Similar to the broader market and indices, it’s been weak—making it a good candidate for hedging or shorting. As expected, the news impacted it significantly, and traders who acted early benefited. The stock is down 29% over the past 27 trading days, and just from recent predicted highs, about 15–16% in just eight days.
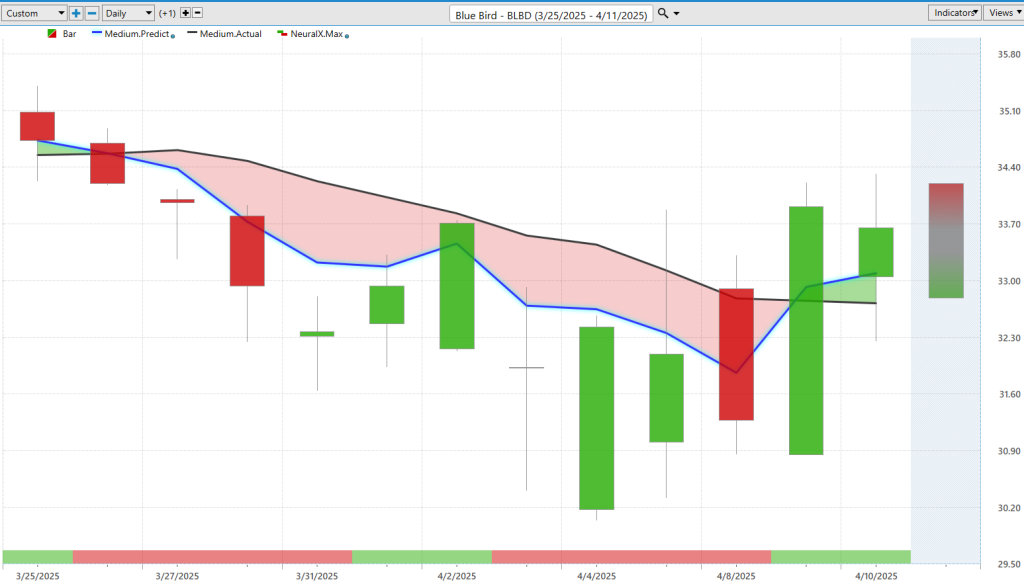
Now to **Blue Bird ($BLBD)**. It’s interesting because it’s been on my radar. Recently, the blue line crossed below the black line, and the neural index turned bearish. There’s been a lot of noise in this forecast, but some conditions are starting to reverse. So while many stocks like **Las Vegas Sands** and **Xerox** are still in downtrends, some stocks like **Blue Bird** are starting to pivot.
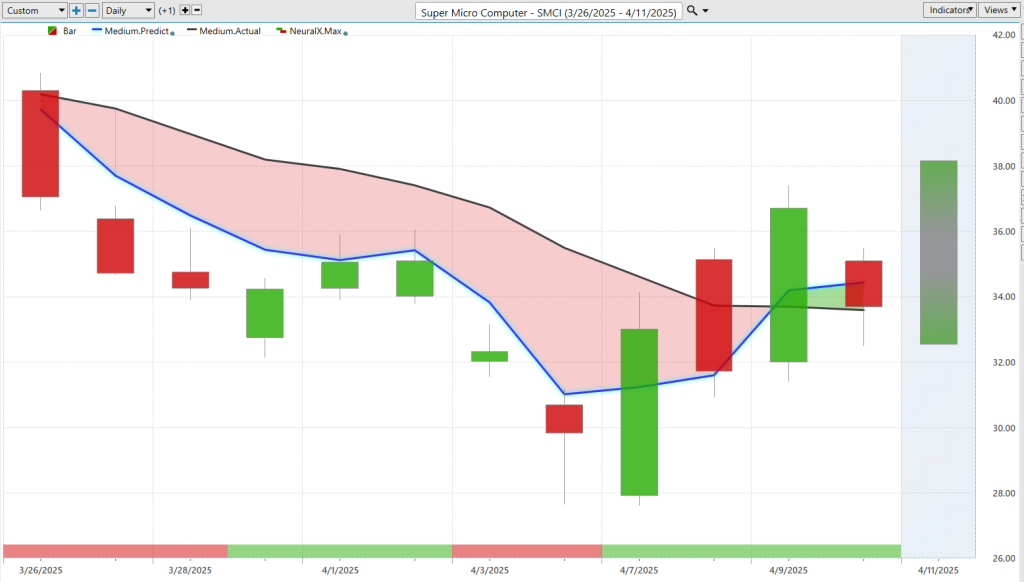
Similarly, **Super Micro Computer ($SMCI)** just had a crossover yesterday. It offered some dip-buying opportunities or areas to cover previous shorts. Still, some stocks remain in strong downtrends, which brings us to **GSK ($GSK)**.
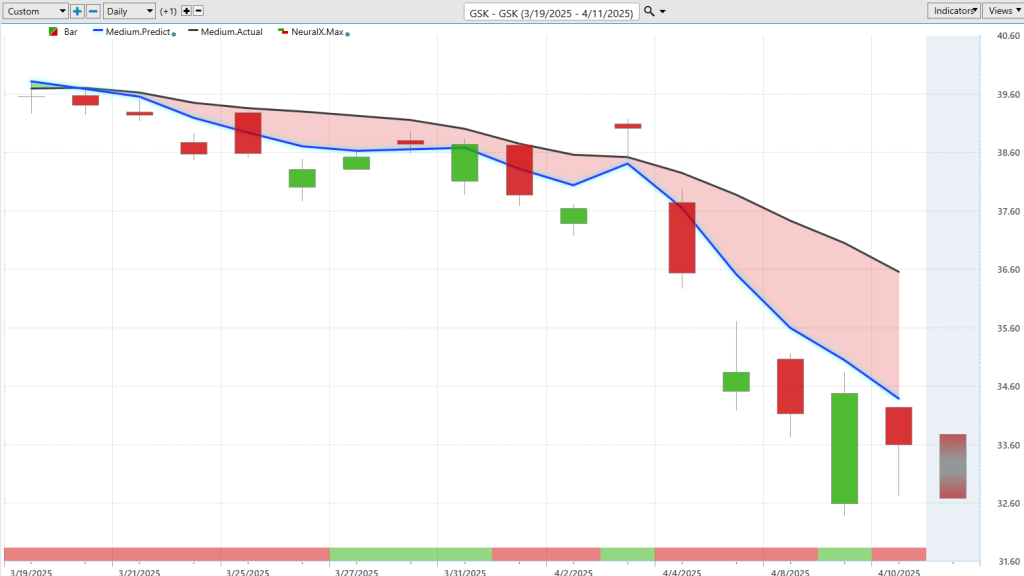
**GSK**, a large pharmaceutical, continues in a strong downtrend despite choppy behavior. You constantly see gap-ups to previous predicted highs followed by sharp drops. This provides profitable shorting opportunities. The trend remains bearish, and the blue line stays below the black line.
So, it’s important to differentiate markets where the predicted averages are still widely separated (bearish) versus those beginning to shift (potentially bullish).
With that, we’ll go ahead and leave it there. Once again, this has been the Hot Stocks Outlook for April 11th, 2025. Thank you all for watching. Best of luck out there, and bye for now.


