Register for a Free Live Training
The Hot Stocks Outlook uses VantagePoint’s market forecasts that are up to 87.4% accurate, demonstrating how traders can improve their timing and direction. In this week’s video, VantagePoint Software reviews forecasts for SPDR SPY($SPY), Abbvie Inc.($ABBV), Ebay ($EBAY), Quest Diagnostics ($DGX), Extra Space Storage ($EXR), Northrop Grumman ($NOC)
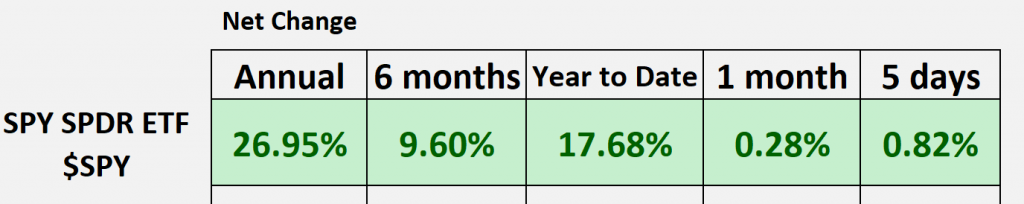
SPDR SPY ETF ($SPY)
Hello again, traders, and welcome back to the Hot Stocks Outlook for August 23rd, 2024. I hope you all have had an excellent week out there in the financial markets. As always, we’re going to take a look at the most recent Vantage Point predictive forecast. If you haven’t already, make sure you go ahead and click on the link in the description below. You can sign up for a live demonstration to learn all the specifics about how these predictive tools, based on artificial intelligence, are helping traders make better trading decisions in the marketplace.
We’ll start by looking at the S&P 500 ETF Trust (SPY) to get a sense of where the broader marketplace has been. We’ve seen a lot of strength recently. We had that big selloff and move lower in prices, but we’re actually moving up, almost about 17.5%, almost back to those all-time highs. When we really take into account where we’ve been over the past 30 days, we’re pretty much sideways. But again, we are starting to see markets perk up and do better. This is where VantagePoint can help traders identify that strength coming in and where AbbVie ($ABBV) can exploit some of that.
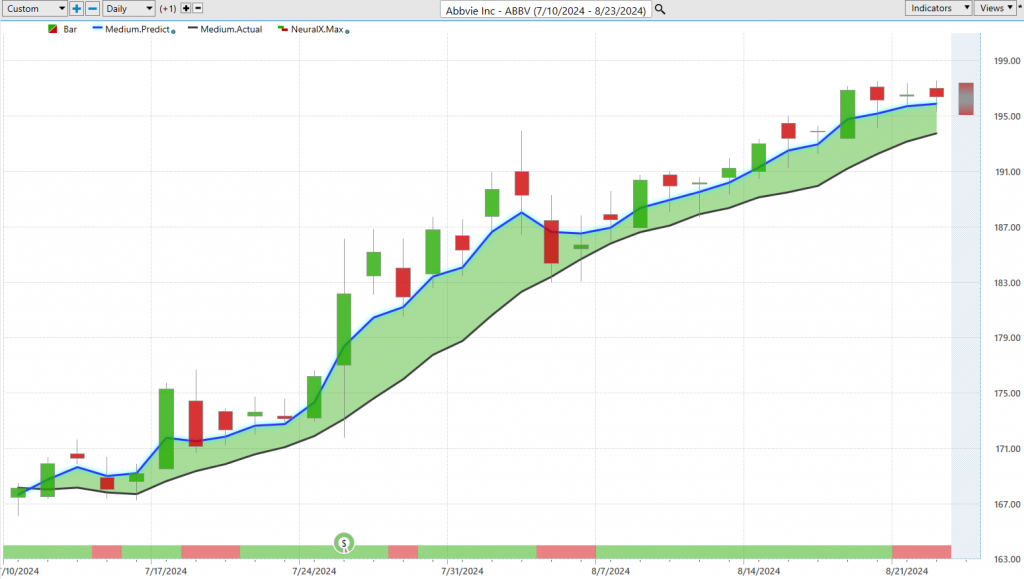
Let’s start with shares of AbbVie ($ABBV). This is a really good opportunity. When we look at all of these trading days, each of these candles on the chart represents a full and complete trading day. The first thing that stands out is there’s a black line and a blue line value. The black line value you see here is a simple moving average, a very common technical analysis indicator. It looks back at the previous 10 close prices, adds them all together, and then divides by 10.
The weakness with traditional technical analysis is that all the data used to generate this comes from the past, so it’s just lagging behind what’s already occurred. It also only has the ability to look at one market at a time. Most technical indicators are just concerned with how AbbVie ($ABBV) is trading, not necessarily factoring in other markets that can drive and influence future prices. Vantage Point can compare that black line to this blue line, which can be thought of as a prediction of prices moving forward.
For this value to get calculated and plotted on the chart, the technology of artificial neural networks is coming into play. They’re performing what we call intermarket analysis. This means we’re able to understand markets that are known to drive and influence the future price of whatever the target market is that you’re trading. In this case, for AbbVie ($ABBV), that could be things like the bigger ETFs like SPY, potentially the Invesco QQQ Trust ($QQQ), or some biotech ETFs. It can also look at subtle relationships between individual stocks. Traders can’t always understand the importance of these relationships, but it even looks further at things like the value of the Dollar Index, interest rates, and global commodities that may affect the target market you’re trading. If you’re trading gold mining stocks or copper mining stocks, these all have a very important effect.
It takes this global approach, looking at all of these intermarket relationships and using that data set to generate highly accurate price predictions for the future. Whenever we see this blue line cross above the black line, it’s suggesting that average prices are going to start moving higher and traders may want to look to take a long position in the market. As long as that blue line remains above the black line, the overall trend is up. We’ve gotten about a 16% rally over the past 31 trading days in shares of AbbVie ($ABBV).
But that’s not the entirety of the forecast. At the bottom of the chart, you’ll see this bar that goes from green to red and back to green. This is called the Vantage Point predicted neural index, updating every trading day and letting traders know about short-term strength or weakness in the market over the next 48 hours, or you could think of that as really a couple of candles. Traders can combine these predictive indicators, all the way down to our predicted trading range, to make better decisions on their expectations for the market.
Again, as long as that blue line remains above the black line, you’ll notice periods where this neural index goes bearish, but overall, you see that you tend to get some weakness over the subsequent couple of trading days. However, this indicator has an accuracy in excess of 80%, so it consistently skews in the direction where momentum is picking up in the market. As that neural index turns green in an uptrend, you often see momentum pick up.
Lastly, you’re provided with a predicted high and a predicted low—an actual trading range for the upcoming trading day. When we go back and look at how accurate these predictions are, you can see just in this past week, if you’ve identified a market in an uptrend that you want to trade, you have all these levels coming through to help guide you as far as where that market is likely to trade. You can use these levels to set limit orders and get involved in a buying situation, but also to know where to take profit as the market moves higher, cooling back once we hit those daily predicted highs.
Really nice opportunity here. We’ve seen a lot of strength in the market. This stock has been in an uptrend throughout that weakness. Even with some volatility in the market, the blue line remains solidly above the black line, and the overall trend resumes for that 16% rally.
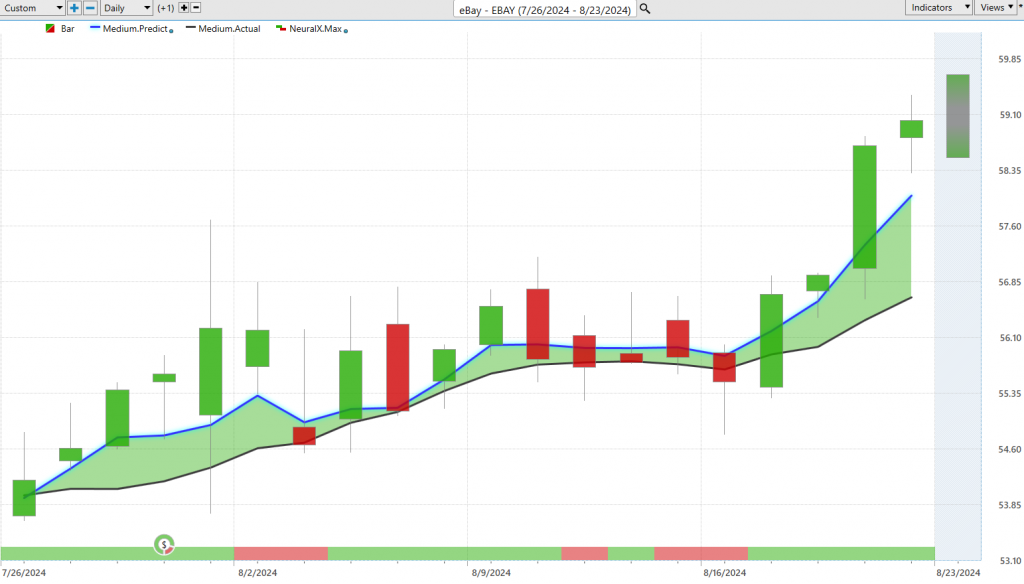
Now, let’s move on to eBay ($EBAY). There’s a bit more volatility in this market, but we see a very similar case here. The blue line has crossed above the black line. The neural index goes from green to red and back to green. Notice that when it goes red, we get these sideways consolidation periods, indicating short-term weakness, but we never actually get that blue line crossing below the black line, which has led to a nice rally this past week.
We can look at all those predicted high and low ranges. You see some noise coming through—these are actually our earnings markers to let us know earnings are coming up. You get all that volatility, which is typical around earnings, but notice how quickly the software gets back on track, saying, “Be prepared for these predicted highs and lows to swing around. If you want to be a buyer, get those entries down at those predicted lows,” and the market starts to trend higher. A nice move here recently in shares of eBay ($EBAY), overall, about an 8% move in the past 19 trading days.
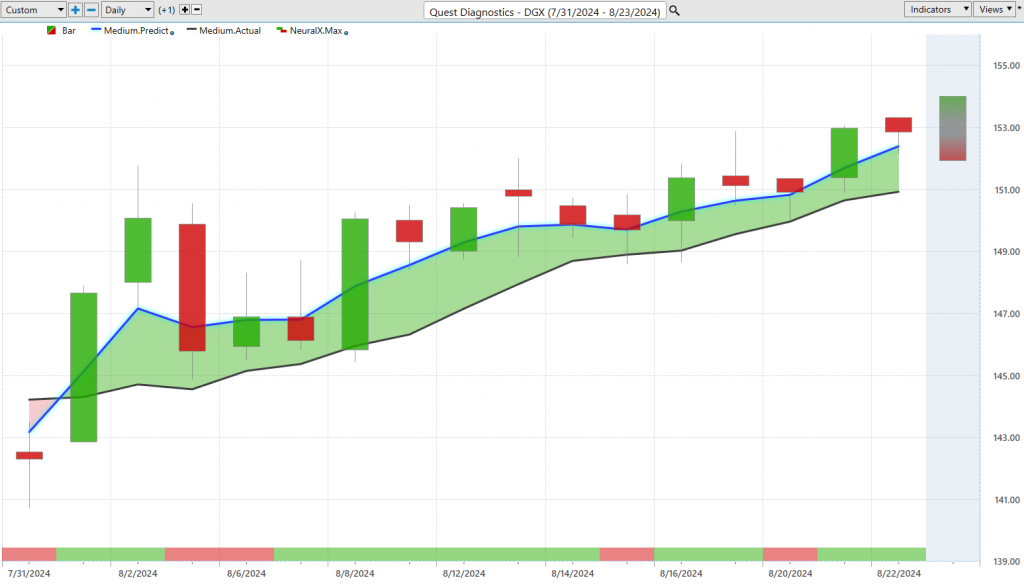
Next, let’s look at Quest Diagnostics ($DGX). A very similar situation: we get the blue line crossing above the black line, neural index bullish going into this move. But notice, when the neural index turns bearish, you get those subsequent 48 hours of weakness, with the market trading down towards the Vantage Point predicted lows. However, that blue line remains solidly above the black line, indicating the overall trend is up. A 5% move in shares of Quest Diagnostics ($DGX).
Again, we can look at these predicted highs and lows, even with a lot of volatility. Look how well these values suggest looking down towards these predicted lows to participate in that bullish side of the marketplace.
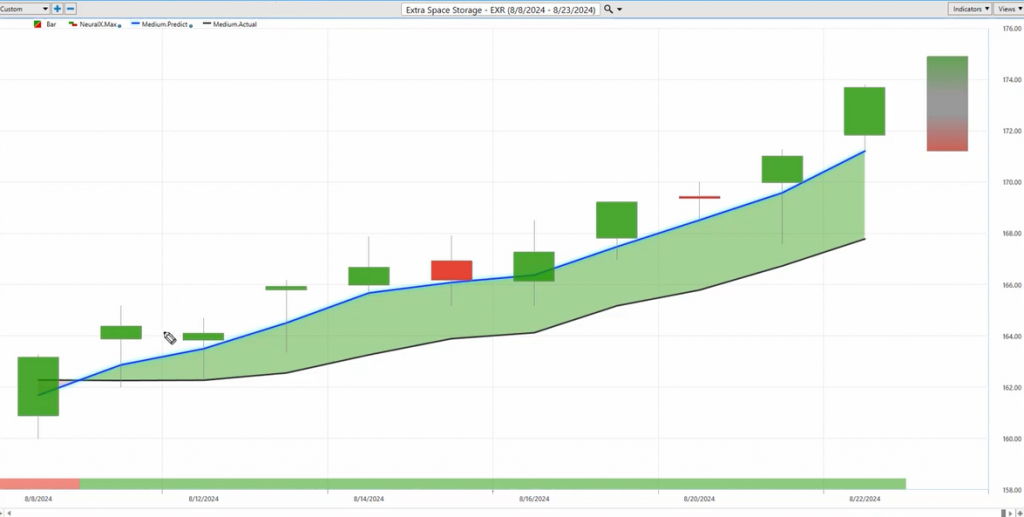
Here’s Extra Space Storage ($EXR). A very straightforward forecast. It highlights what we want to identify here: seeing that trend to the bullish side and seeing that neural index skewing to the bullish side, indicating that we should expect some subsequent strength over the next 48 hours. You notice how the market keeps climbing higher and higher each day. A very bullish forecast. If we want to bring this down to the short term, traders are looking for opportunities to take positions intraday. We see really nice opportunities here as the market starts to move higher.
We can look at these days: here, you have a predicted low value up in the left-hand corner of 162.45, the actual low was 162.35. Here, a little deeper: you see a predicted low of 166.37, you get a low of 165.16, and the market closes near that predicted low. Again, predicted low 165.24, actual 165.17, predicted low 168.23, actual 167.58. Really getting nice entries, especially in a high-priced stock, pretty much within a dollar of figuring out where that low is before the resumption of the move.
In just the last couple of days, with a lot of strength coming into the broader market, there’s about a 3% cushion on a potentially new opportunity going into this week.
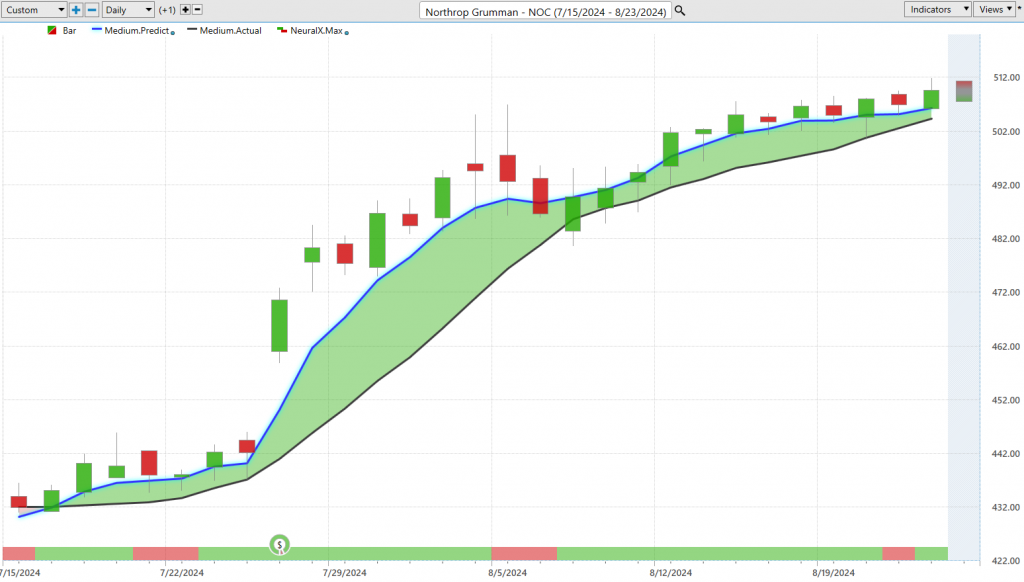
Lastly, let’s look at Northrop Grumman ($NOC). Even through a lot of volatility, this is one of the areas where we’ve identified persistent strength. You may want to hedge your portfolio or take some short positions to balance things out. Here in Northrop Grumman ($NOC), you see persistent strength. The most recent predictive forecast shows a lot of strength in terms of trend and neural index, which lends itself to shorter-term traders looking towards these short-term levels for excellent entry opportunities.
In the past couple of weeks, we’ve seen great examples of this: moving to predicted lows and hitting predicted highs, offering those particular levels to minimize risk in the overall trade but getting exposure to these trending markets. We’ve seen about a 17% rally just in the past 27 trading days in Northrop Grumman ($NOC), offering nice opportunities for traders, whether you’re a long-term swing trader or shorter-term day trader.
We’ll leave it there for today. Once again, this has been our Hot Stocks Outlook for August 23rd, 2024. Thank you all for watching, best of luck, and bye for now!