


Register for a Free Live Training
The Hot Stocks Outlook uses VantagePoint’s market forecasts that are up to 87.4% accurate, demonstrating how traders can improve their timing and direction. In this week’s video, VantagePoint Software reviews forecasts for SPDR SPY($SPY), Apple ($AAPL), Microsoft ($MSFT), HIMAX Technologies ($$HIMX), Ford ($F), D.R. Horton ($DHI), KeyCorp ($KEY)
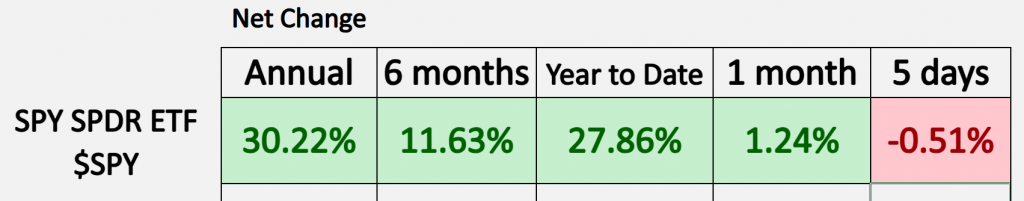
SPDR SPY ETF ($SPY)
VantagePoint A.I. Hot Stocks Outlook for December 13, 2024
Hello again, traders, and welcome back to the Hot Stocks Outlook for December 13, 2024. I hope you all have had an excellent week out there in the financial markets. As always, we’re going to take a look at the most recent VantagePoint A.I. predicted forecast. If you haven’t already, make sure you go ahead and click on that link down in the description below, and you can get yourself signed up for a live demonstration and learn all the specifics about how these predictive technologies and tools are helping traders make much better trading decisions out there in the marketplace.
Now, as we typically start out, we can take a look at the S&P 500. Uh, week to week we really just keep coming back; we’re up about 27% year-to-date, uh, really fluctuating around that number but not really advancing. And so, what we’ve seen recently is actually especially the Dow and Russell turn lower, uh. A lot of those you know, Magnificent Seven stocks are actually leading the way, but there is a little difficulty out there, right? Everything isn’t really going up, uh, as much as the indices would suggest. But let’s go ahead and revisit a couple of those Mag Seven stocks we looked at last week, uh, and explain how these predictive forecasts work.
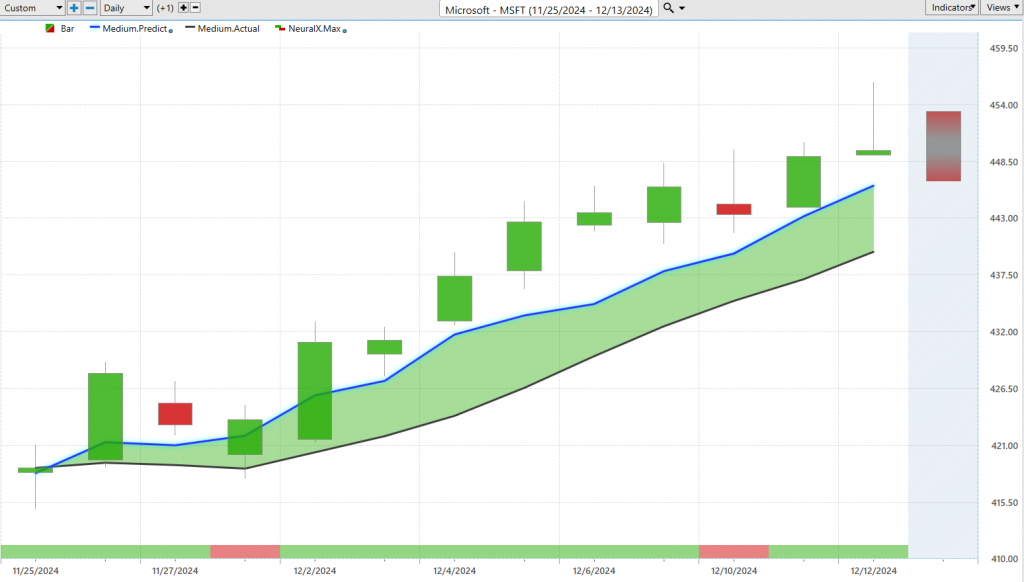
So, uh, what we’re looking at here is shares of Microsoft ($MSFT), obviously a very popular traded company. Here’s some strong correlations with the S&P 500, uh, and what we have here is daily price action. So each one of the candles there, well, that’s going to represent a full and complete trading day, and it’s right up against the price data. The first thing we’re going to take a look at is this black and blue line value. Now, the black line value that you’re seeing there, well, that is a simple moving average, or what we refer to as the actual simple moving average, uh, and in this case, it’s a 10 period. So, it’ll just look at the previous 10 close prices, add those all together, and then divide by 10.
And so, the weakness with traditional technical analysis like this is that all the data comes from the past and it’s only looking at one market in isolation, right? It’s just looking at where has Microsoft already been. And so what VantagePoint traders are able to do is compare what we would call that actual lagging moving average to this proprietary predicted moving average, and for that number, which is essentially a calculation of future prices plotted forward on the chart, well, for that to get calculated, this is where the technology of artificial neural networks are performing what we call intermarket analysis.
And so, what that means is it’s going to look at dozens of other markets that are known to drive and influence the future price of Microsoft. So, we’re no longer looking at Microsoft in a vacuum, and we’re also not just reconfiguring past price; we’re actually generating predictions with a high level of predictive accuracy. And so, this can be things like, of course, the SPY or the NASDAQ, those major indices, but it’s also going to identify some correlations between other just individual stocks or also things like the currency, right? The value of the dollar index, the value of interest rates in the bond market, even down to things like precious metals or energy markets, or even grains commodities. And so, it takes this global approach, analyzes all this information, and then produces a suite of predictive indicators that traders can use to make much better trading decisions.
And so, whenever we see this blue line, this predicted moving average cross above the actual moving average, well, it’s suggesting that these prices are going to start trending higher, and you might want to take a long position. Now, this is a really good example because we know how the SPYs performed; Microsoft is a very large stock, uh, but just over the past five trading days from last week’s Hot Stocks Outlook, we can see how this works every single trading day, and updating things, uh, and as we go ahead and look at those predicted highs and lows that we looked at each week, we’re given a predicted high and predicted low range that again is projected before each and every trading day. And so just revisiting Microsoft here, we can see, well, what happened here is actually on Tuesday we got to dip down towards these, really, the lows of the, uh, uh, five-day period here, uh, before we get that advance and the market moving higher. So for day traders, really nice opportunity to take a position, maybe take some profits, uh, and benefit as the markets climb a little bit higher this week over the last few trading days.
Now, each week we go ahead, and we take a look at all of these predictive indicators, uh, we really just updated the predicted moving average and the predicted highs and lows, and the only other thing to really understand is at the very bottom of the chart here, you see this bar that goes from green to red and back to green. Well, this is the VantagePoint predicted neural index, and so aside from our overall trend that we get with the predicted moving average, this is tuned to solve a different problem, just short-term strength or weakness over the next 48-hour period. And we see that as we look at these subsequent forecasts, this has an extremely high level of accuracy, upwards of 80 plus percent on a very wide number of markets.
So you’ll notice that as this market trends up, well, you get essentially, you know, nine out of ten days where, uh, that neural index is going to be in that bullish configuration here.
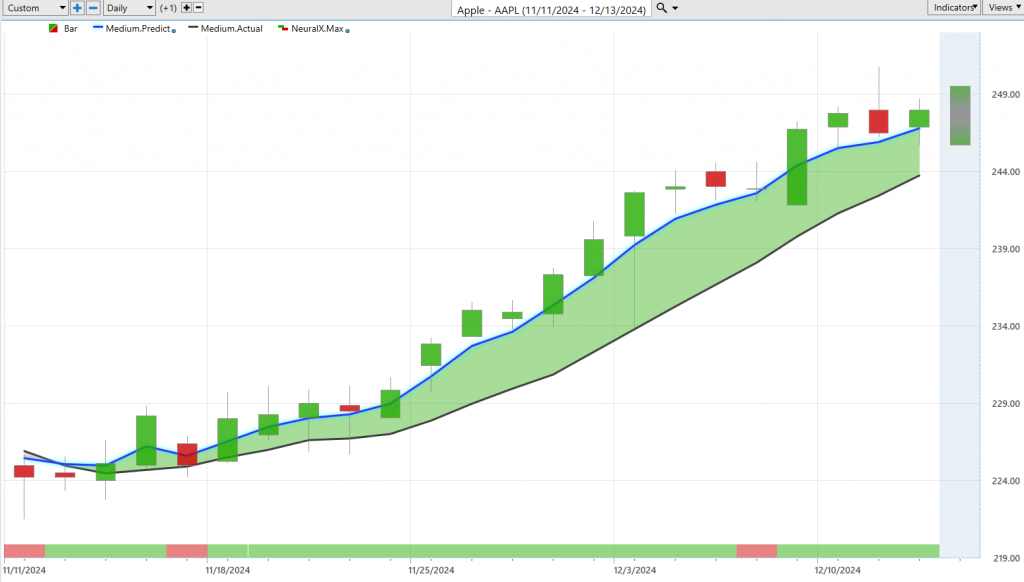
So let’s revisit Apple ($AAPL), another stock that we looked at last week, and I wanted to just update these before we get some of these new opportunities because it highlights how, uh, traders can manage their opportunity, right? So we look at Apple, we see our predicted moving average crosses above the actual moving average, but just over the last five trading days from the last Hot Stocks Outlook, we can see, okay, well, what levels are we being presented with by the VantagePoint predicted highs and lows before the next trading day?
And we can see actually here on Monday that’s about as good as it gets for a trader trading Apple here, right? We moved down towards that predicted low; we can take an exact look at this, a predicted low of 241.83, the actual low of 241.75, uh, you have a limit order, you get filled, and you’re going to benefit as Apple shares advanced this week over the last four trading days, going into Friday, up 2 and a half percent.
Now, what we’ve seen again is a lot of strength out of these Magnificent Seven stocks, the S&P 500, and even the NASDAQ, but you’re actually seeing weakness out of the Dow and the Russell. And so, this creates a very mixed nature to you know, the wide, uh, uh, assortment of stocks that we have available, of how different stocks are performing, uh.
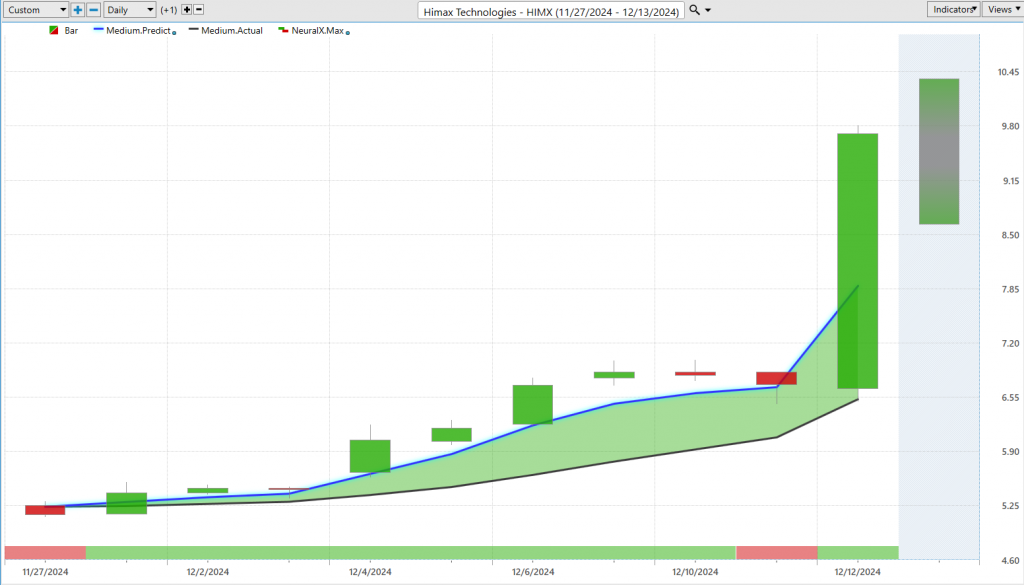
Another tech stock here that’s performed extremely well, Himax Technologies ($HIMX), this is Himax technology, uh, and again, we see, we get this predictive forecast of this blue line crossing above the black line, uh, neural index very bullish back here on, uh, November 29th, and you see over the course of this move, you get continued strength out of that neural index and even a separation between that predicted moving average and the actual moving average, signaling that the difference between those values of where the market’s likely to go and where it’s been are spreading apart, uh. And so, again, we can look at these predicted highs and lows; there are a couple of really great levels here, very early, uh, down here at about $5.30 and again here, uh, down a little bit above 6.50 before we get this huge advance. This about a 40% rally, uh, in a single trading day, but over the course of this whole move, it’s, you know, even more than that, coming from these predicted lows just over the past eight trading days, you’re up about 80%. So there’s been some really exciting opportunities and really great opportunities to get that entry and then trail your stops and be around, uh, for that explosion of the move.
But now let’s go ahead and transition to where there’s actually been some weakness and where the VantagePoint forecast has actually been skewing to the bearish side.
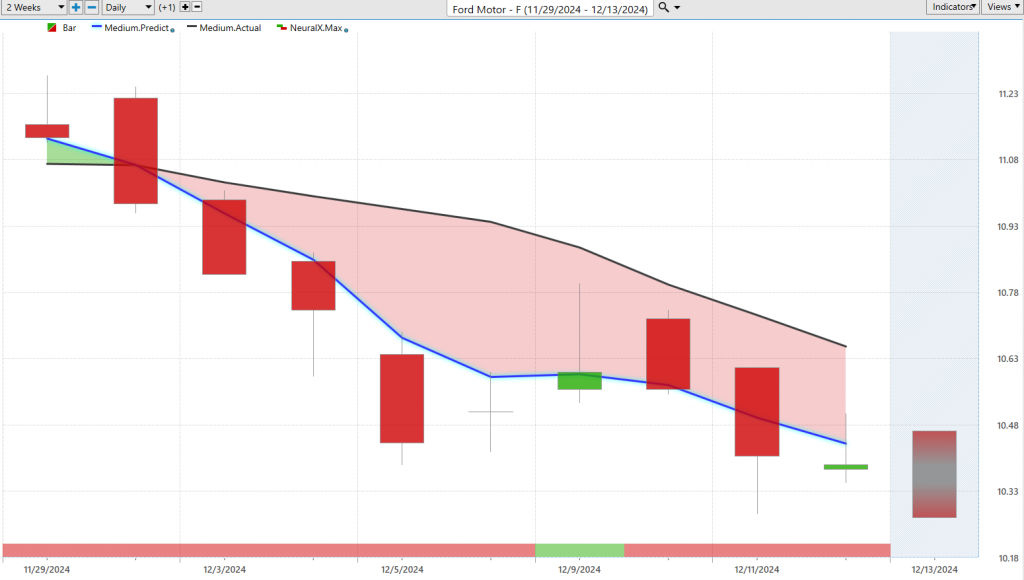
Ford Motor ($F), so whether you want to hedge the portfolio or just identify markets where you want to avoid that aren’t good markets to trade, uh, here shares of Ford Motor Company, and you see here again, blue line crossing below the black line, a lot of weakness from the neural index, and look at this separation between that prediction of the actual moving average, the prediction of the predicted moving average, and the actual moving average, signifying that this is a strong trend. And so, so what I get a little worried about is if we saw some of that weakness in some of the other indices coming through and everything starts to want to go lower, uh, some stocks may be really poised to, uh, take it on the chin here.
So again, we can look at these predicted highs and lows, uh, and see that since this trend has gotten started, these movements up towards these predicted highs have actually been an opportunity to short, take profits on short positions, uh, or potentially hedge, maybe buy some put options to add to the portfolio.
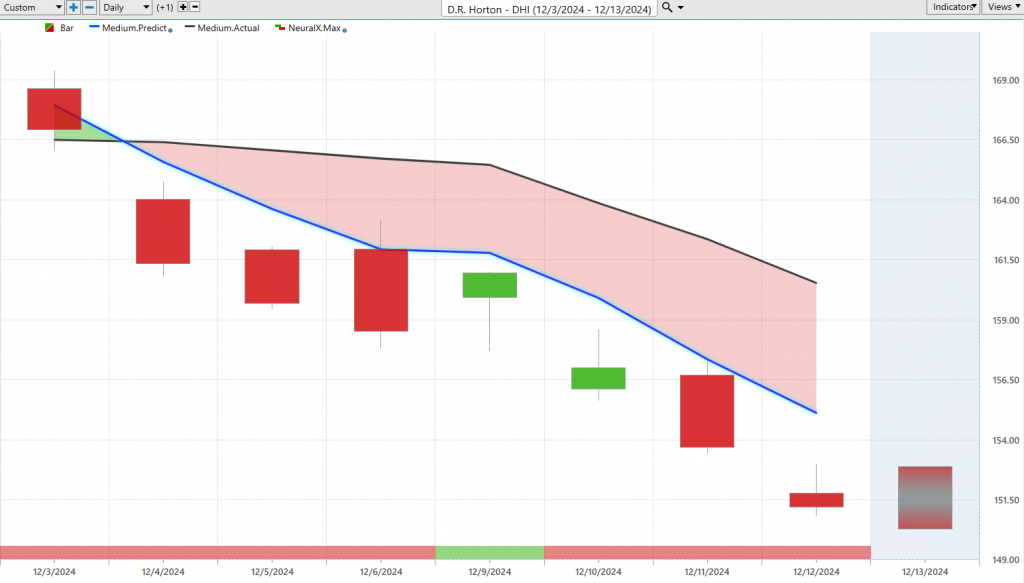
In the home building space, here’s D.R. Horton ($DHI), so an area that’s had some really great rallies throughout 2024, well, here we see this blue line crossing below the black line, neural index very bearish again, the degree of separation that we’re seeing in some of these markets suggests that there is a strong trend to the downside afoot, uh. And again, we can look at these predicted highs and lows, and you see what happens here is if you have a limit order ready to short on these trading days, you’re getting filled at very good levels, essentially kind of like Apple but in reverse, getting filled at the open and then having that market almost immediately, uh, start moving to the bearish side and in the desired direction here. So, overall, a nice move so far to the downside, maybe not a nice move if you’re on the bullish side of any of these stocks, uh, but it’s something that I think, going into this week especially, we want to be aware of, is that not everything is moving straight up like Microsoft and Apple and Meta; uh, some things are actually primed to move lower, uh, especially here in the financial space.
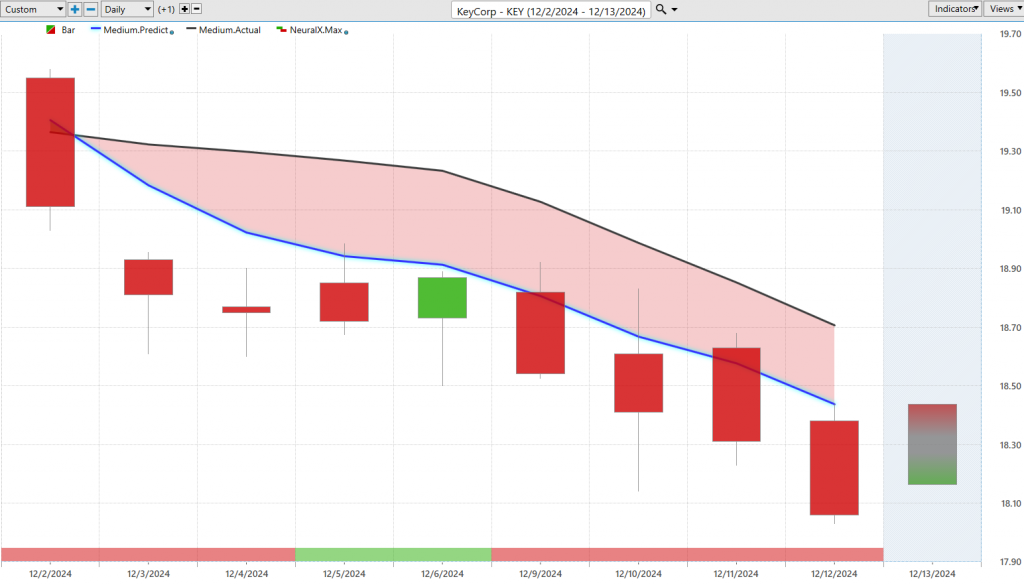
KeyCorp ($KEY), so here’s KeyCorp, again very strong crossover to the bearish side, a lot of weakness from the neural index, and you’ll see that you get these periods where that neural index boosts up to a bullish configuration, and you actually do see that over the next couple of trading days, I mean, you’re, you’re trading higher, right? You’re not going aggressively lower; things tend to sort of just run sideways here for a little bit when we get that signal, but as soon as that momentum kicks back in with that bearish neural index reading, we start seeing that weakness really take hold again.
So again, we can look at all these predicted high and low levels and again understand that up here at these levels, this is not where you want to be accumulating a position on the bullish side or expecting it an advance in price, uh, and sure enough, we’re seeing pretty quick reductions, uh, as markets go lower, and again, some of those indices, uh, start to curl and go lower as well. So again, a nice move here, off about 5%, just in the past eight trading days, but very early on, some of the weakness but again, seeing it sort of creep into more and more areas of the marketplace, you certainly want to be careful out there. So, uh, we’ll go ahead and leave it there for today. Once again, this has been our Hot Stocks Outlook for December 13, 2024. Thank you all for watching, best of luck, and bye for now.


