


Register for a Free Live Training
The Hot Stocks Outlook uses VantagePoint’s market forecasts that are up to 87.4% accurate, demonstrating how traders can improve their timing and direction. In this week’s video, VantagePoint Software reviews forecasts for SPDR SPY($SPY), Apple ($AAPL), Microsoft ($MSFT), Walmart ($WMT), United Continental Holding ($UAL), Exxon Mobil ($XOM).
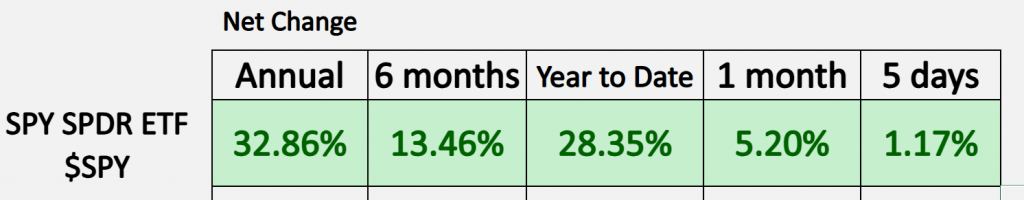
SPDR SPY ETF ($SPY)
VantagePoint A.I. Hot Stocks Outlook for December 6, 2024
Hello again, traders, and welcome back to the Hot Stocks Outlook for December 6, 2024. I hope you all have had a nice week out there in the financial markets. As always, we’re going to take a look at the most recent Vantage Point A.I. predicted forecast. So, if you haven’t already, make sure you go ahead and click on that link down in the description below and get yourself signed up for a live demonstration so you can learn all the specifics about how these technologies are helping traders make much better trading decisions out in the marketplace.
Now, as we typically start out, we like to take a look at the S&P 500 just to get that broad sense of where stocks are. We can see year-to-date now 28% on the S&P 500, and we’ve had a pretty good week actually seeing a lot of the magnificent 7 stocks actually do really well.
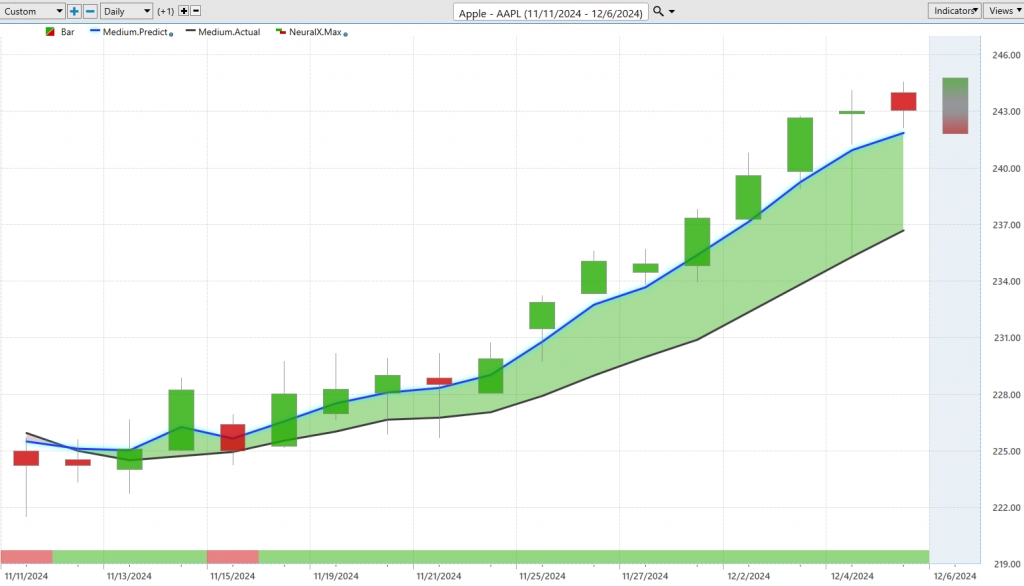
So what we can Apple ($AAPL) do here is start out with shares of Apple and really work through this and explain how all of these charts work really the same way, whether you’re trading Apple or gold futures or even Walmart or whatever it might be.
What we have here is daily price action. So, each one of the candles that you’re seeing there on the chart is going to represent a full and complete trading day, and it’s right up against that price data that we’re first going to take a look at this indicator within Vantage Point. Now, the black line that you see there, well, that’s actually a simple moving average. So, this is a very common technical analysis tool. In this case, it’s a 10-period, so it looks back at the previous 10 closes, adds those all together, and then divides by that number. One of the weaknesses with traditional technical analysis like this is that all the data comes from the past, so it’s really just summarizing what’s already occurred in the market. So, what we want to use that for is our baseline, right, letting us know where market prices have already been. And so, what we’re able to do is compare that baseline value to the Vantage Point proprietary predicted moving average. And for this number, which you could think of as a future of average prices moving forward, for that price prediction to get calculated and plotted on the chart every evening, well, this is where the technology of artificial neural networks come into play. And they’re performing what we would call intermarket analysis. And so, what that means is that rather than just looking at the past, we can understand how other markets are driving and influencing the future price of Apple. And so, this can be important markets like the SPY or the Q’s and NASDAQ, but it can also be things like the value of the dollar index or global interest rates, as well as ETF groups or even individual commodities like gold or silver, or, you know, potentially even Bitcoin or something like that. And so, it’s able to understand specifically what are the markets that share these important market relationships with the target market that you’re trading and then using that information and data to produce very robust forecasts as far as where things are headed next.
And so, whenever that blue line crosses above the black line, well, it’s saying, look, average prices are going to start moving higher; you, therefore, may want to take a long position. And whether you’re a day trader or a swing trader, maybe trading options, you can utilize this information to help that decision-making process. And you see we’re up about 8% in just the past 16 trading days, but that’s not the entire of these predictive indicators in the forecast. If you come back every really week here, we take a look at this bar at the bottom of the chart, and you see that this can go from green to red and back to green, and it’s updated at the right-hand side of the chart every single day. And what this does is it’s forecasting short-term strength or weakness, really over the next 48 hours, or you could think of that as a couple of candles, a couple of trading days. And this works in combination with that predicted moving average as far as helping traders anticipate those short-term fluctuations in the marketplace. And so, what you’ll notice here is that with Apple, we’ve really had that neural index remaining bullish pretty much every day. And this is actually helpful to think about this because we could argue that here it goes red, and there it is wrong. But this is where the accuracy comes from. We have 1, 2, 3, 4, 5, 6, 7, 8, 9, 10, 11, 12, 13, 14, 15, 16, 17 days, so it got one wrong day out of 17, a very, very high level of accuracy typically across all markets at something like 80 plus%. And so after that, we can even go and say, okay, well, let’s look now intraday. What are the neural networks saying intraday as far as where we might want to look to take a position? And this is where these predictive indicators do a great job and let you know what’s the overall trend, short-term strength or weakness, and where do you really want to be looking to accumulate a position. You see down here, really is where this screams at you with the overall trend being up, that neural index decidedly bullish, and you see that’s where we see that advance happen, and pretty you know, almost perfect entry here in price here, really contributing that 8% rally over 11 trading days. So, really nice move there, and really the point of this is just to highlight how all of these tools work together to help the trader make those trading decisions again, whether it be shorter-term, longer-term, whatever matches your approach here.
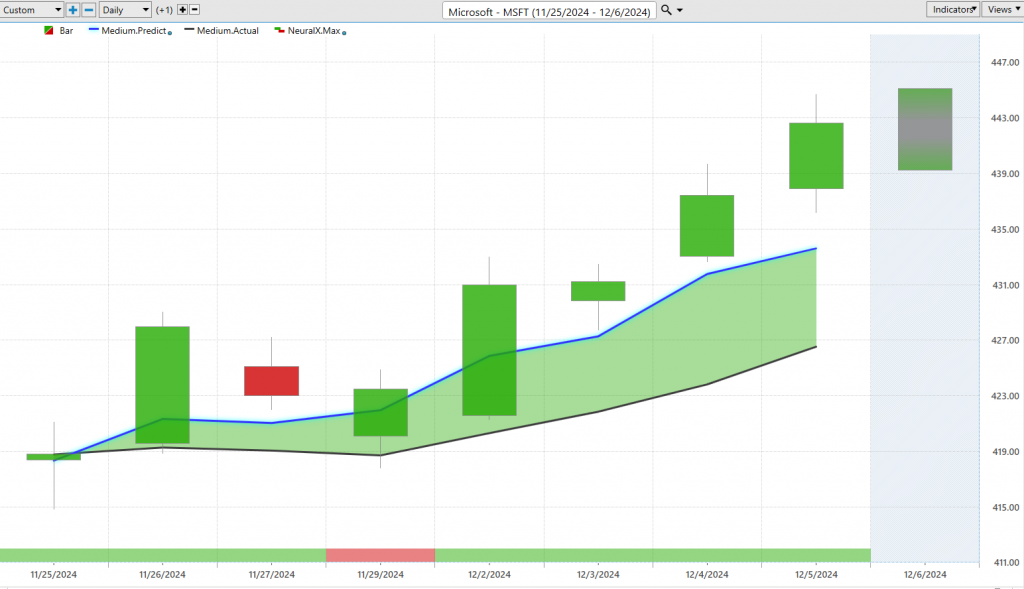
Shares of Microsoft ($MSFT) Microsoft and again getting to this point of seeing a lot of strength in these large markets this past couple of weeks here, you see that blue line crossing above the black line and again setting you up even going into this trading day to say, okay, well neural index is bullish, let’s look to go ahead and buy down at those predicted lows. And you see how this works as far as saying, okay, well, expect that trading range to go lower, look for the market to move down towards those predicted lows, and the next trading day, you say, okay, well, we may go a little bit further lower, but the overall trend is up. And you actually see that once this trading day was concluded, it actually has the predicted low right, that’s forward-looking slide up. So just like here, we have that predicted low much higher than price. This is how these tools again are helping traders make these better trading decisions and really minimize the risk for a potential trading opportunity you might want to get involved in. So, there you see about a 5.9% move at shares of Microsoft just in the past five trading days, and obviously, that is a strong correlation with the S&P 500 as well.
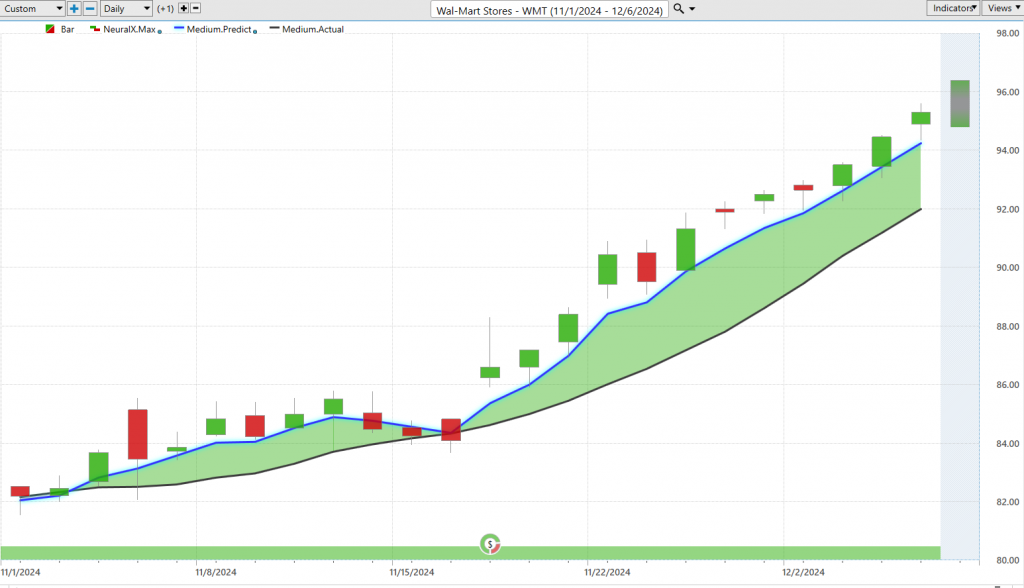
Now here’s WalMart Stores ($WMT) Walmart, and this is just something else here, right? So here’s Walmart, we see we have earnings right in the middle of this, leading to a lot of volatility, but take a look at how bullish this forecast is. We see this blue line crossing above the black line, neural index bullish every single day, and this has been really one of the strongest markets here. We have Walmart going from 82 up to 95, uh, in pretty short order here. We can see just over the course of about 22 trading days, you got a 15% move. And of course, we can take a look at those predicted highs and lows, and you see how this works. We down towards this predicted low, it’s telling you, be prepared for that volatility here, you come into earnings, and we just start, you know, sort of, you know, lulling around going into that earnings, but notice how you get through that volatility and look how good these levels are at saying, okay, look to buy down at these predicted lows, the overall trend is up. And you see about six entries after earnings, uh, really contributing to most of this move here. So really nice opportunity there in shares of Walmart. And of course, you know, what we want to understand is that we’re always adapting, right? So we have these tools that can guide us moving forward, but you know, if we start seeing weakness, if we get crossovers to the bearish side, we want to make those accommodations and adjustments.
United Continental Holding ($UAL)
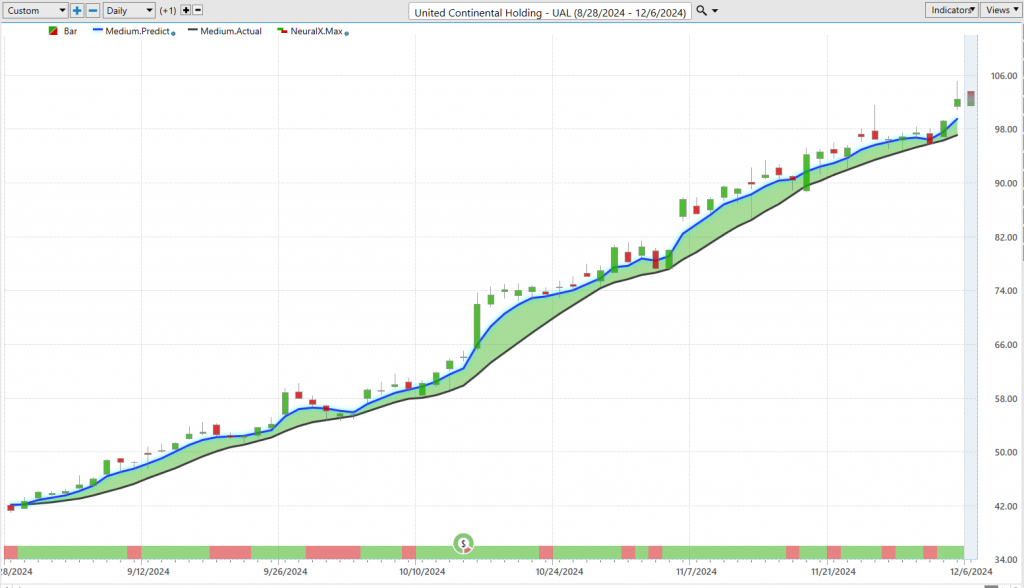
Here’s United Continental Holdings ($UAL) United Continental Holding, so this is pretty phenomenal as well. I wanted to bring this through just to highlight how some of these trends really persist. And when you have a tool like Vantage Point that could, you know, forecast with a high level of accuracy, we can really rely on a lot of those tools not only to get involved in the trend but potentially manage that trend over time. So this has been a phenomenal opportunity, uh, obviously really going back to September, and we saw a lot of the airline stocks this past week really pop and do well. 135% rally over 68 trading days. But what I wanted to highlight here is how many opportunities within this trend to buy down at these predicted lows. And you see pretty much have within two days of any sort of buy down at those predicted lows the market is continuing its uptrend, uh, and moving higher here. So I think I counted there was something like 22, 23 opportunities within that uptrend where the overall forecast remains very very bullish here.
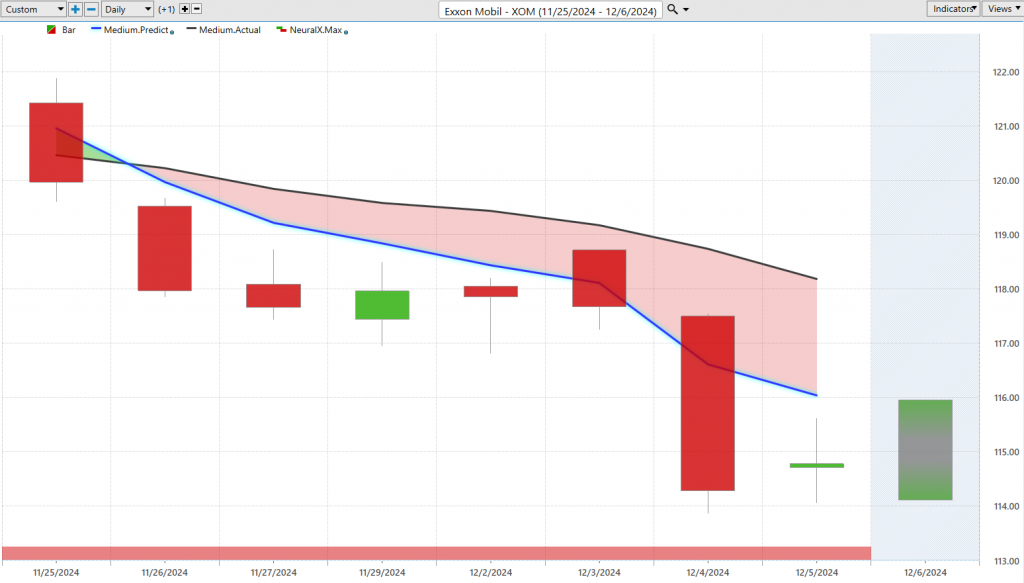
Lastly here, Exxon Mobil ($XOM) let’s take a look at Exxon. So I just wanted to highlight that, you know, everything doesn’t go straight up; sometimes you have these areas of weakness, uh, and here in energy, we’ve certainly seen a lot of weakness, uh, and it’s a great example again of how all this works together, whether you’re long, short, trading stocks or commodities, or cryptocurrencies, uh, but when you get this blue line crossing below the black line, that neural index bearish, it’s letting you know to anticipate some weakness. And so we’ve had so many markets do extremely well, but look at Exxon Mobil here, obviously in a downtrend, neural index bearish for the past seven or eight trading days, consistently. And again, we can look at those predicted highs and lows, and you see how well this works if you have a limit order waiting, you know, up at that predicted high, you’re going to get filled pretty much at the top of the market there, uh, and then you see pretty much a collapse almost immediately coming through here because the market is in a strong downtrend. See about just a three and a half, 3.75% move just over the past couple of trading days, uh, here in Exxon. So really exciting opportunities, uh, really all throughout the market, but of course, you need those tools to really manage those opportunities and make sure you’re extracting value out of those trading opportunities. So we’ll go ahead and leave it there for today. Once again, this has been the Hot Stocks Outlook for December 6, 2024. Thank you all for watching. Best of luck out there, and bye for now.


