


Register for a Free Live Training
The Hot Stocks Outlook uses VantagePoint’s market forecasts that are up to 87.4% accurate, demonstrating how traders can improve their timing and direction. In this week’s video, VantagePoint Software reviews forecasts for SPDR SPY($SPY), Yum! Brands ($YUM), HIMS ($HIMS), Quest Diagnostics ($DGX), Abbvie ($ABBV), Chipotle ($CMG)
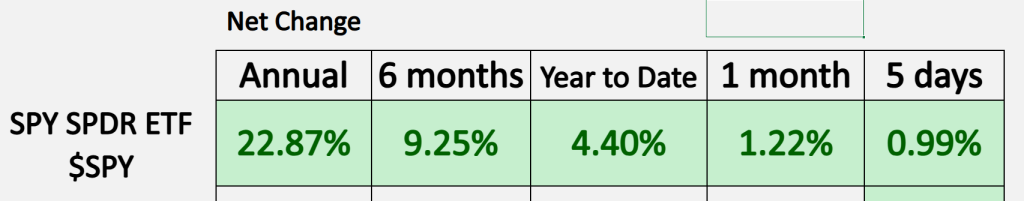
SPDR SPY ETF ($SPY)
Hello again, traders, and welcome back to the Hot Stocks Outlook for February 21, 2025! Hope you all had a nice week out there in the financial markets.
As always, we’re going to take a look at the most recent VantagePoint AI predictive forecast. So if you haven’t already, make sure you go ahead and click on the link down in the description below and get signed up for a live demonstration. That way, you can learn all the specifics about how these predictive indicators and technologies are helping traders make better trading decisions in the marketplace.
Now, as we typically start out, we can take a look at the SPY ETF just to get a sense of where the broader equity indices are. Year to date, we’re still up about 4.4%, not really changing much from last week. Again, over the past 30 days, we’ve been creeping up about 1.2%. So there have been a lot of great opportunities out there, but also a really mixed nature to the market—you want to be involved in the right opportunities.
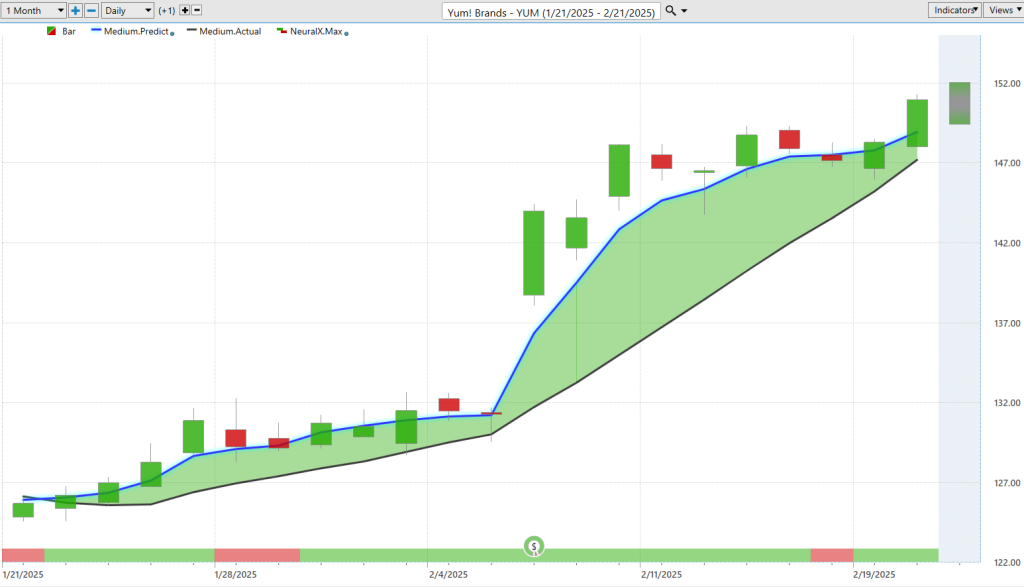
To highlight how all of these predictive indicators work together, let’s take a look at this chart for Yum! Brands ($YUM) and really see how all these predictive tools complement each other.
What we have here is daily price action—each one of these candles on the screen represents a full trading day. Right up against all that daily price action, the first thing that should jump out is that there is a black line and also a blue line.
Now, the black line you’re seeing is actually a simple moving average, a very common technical analysis indicator. In this case, it’s a 10-period simple moving average, meaning it looks back at the previous 10 closes, adds them together, and divides by that number. VantagePoint traders use this as a baseline to understand where market prices have already been.
What we’re able to do is compare that lagging moving average to this proprietary predicted moving average—think of it as future prices plotted on the chart moving forward. To get that number, this is where the technology of artificial neural networks comes into play, performing what we call intermarket analysis.
What we understand is that there are markets known to drive and influence the future price of Yum! Brands ($YUM). This can include ETF groups, other individual stocks, as well as factors like the Dollar Index, interest rates, or global commodity markets. For example, last week, when we looked at gold mining stocks, we saw gold having a strong push, which affected the forecasts for gold miners in VantagePoint.
So, whenever that blue line crosses above the black line, it suggests prices are going to start moving higher, and traders may want to consider taking a long position in accordance with their strategies. In this case, we’ve seen about a 19% rally just over the past 21 trading days.
But that’s not the entirety of how these predictive tools work. If you look at the very bottom of the chart, you’ll see a bar that can go from green to red and back to green. This is the VantagePoint predicted neural index. It also utilizes artificial neural networks, looking at market relationships, but it’s tuned to solve a different problem—short-term strength over the next 48 hours (or a couple of candles on the chart).
When that indicator turns bearish, we sometimes get a couple of days of sideways price action, but as long as that blue line remains above the black line, the overall trend stays bullish.
Now, let’s take a look at the predicted high and low ranges. On the right-hand side of the chart, you’ll see a shadow box, which is a prediction for the next day’s high and low before the trading day occurs. From week to week, we can go back and see how accurate these predictions are against the actual market data.
In this case, you can see how accurate these predictions have been—once the bullish forecast came through, the market consistently moved down towards these predicted lows, providing multiple entry opportunities around earnings. Even after the volatility of earnings, the software quickly adapted and provided accurate forecasts, allowing traders to navigate the movement effectively.
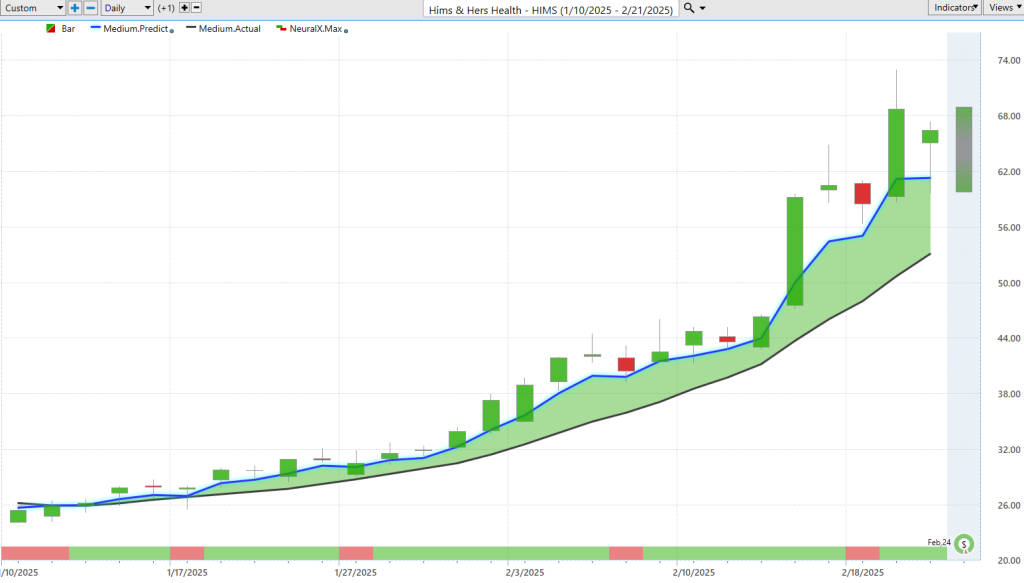
Now, here’s Hims & Hers Health ($HIMS), which has been on a huge rally. If we look back at the forecast, we saw the blue line crossing above the black line in mid-January, and ever since, we’ve had a very strong bullish trend. Even though the neural index turned bearish at times, the blue line remained well above the black line, keeping the overall forecast bullish.
Looking at the predicted highs and lows, you can see how effective these levels are once you identify the trend. The predicted lows offer great intraday price levels for potential limit orders, while the predicted highs serve as bullish price targets. Over the past few weeks, shares of Hims & Hers Health ($HIMS) are up about 147% in just 26 trading days—a really nice opportunity.
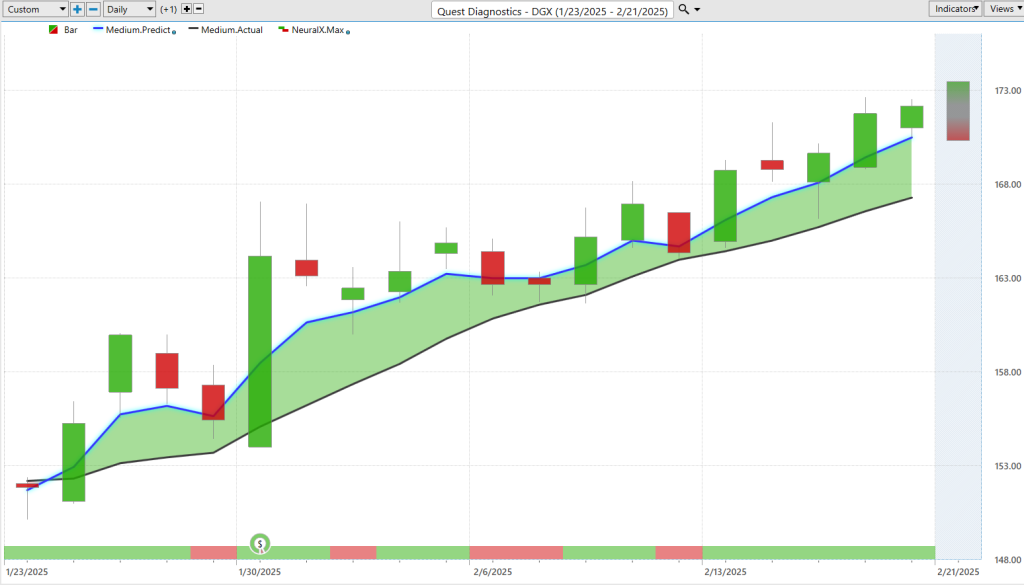
Next, let’s look at Quest Diagnostics ($DGX). This is another great example of how all of these predictive tools work together. The blue line crossed above the black line, the neural index remained mostly bullish, and despite some short-term fluctuations around earnings, the overall trend remained to the upside. Over the past 19 trading days, shares are up 12%, and again, the predicted highs and lows have provided excellent guidance for entry and profit-taking.
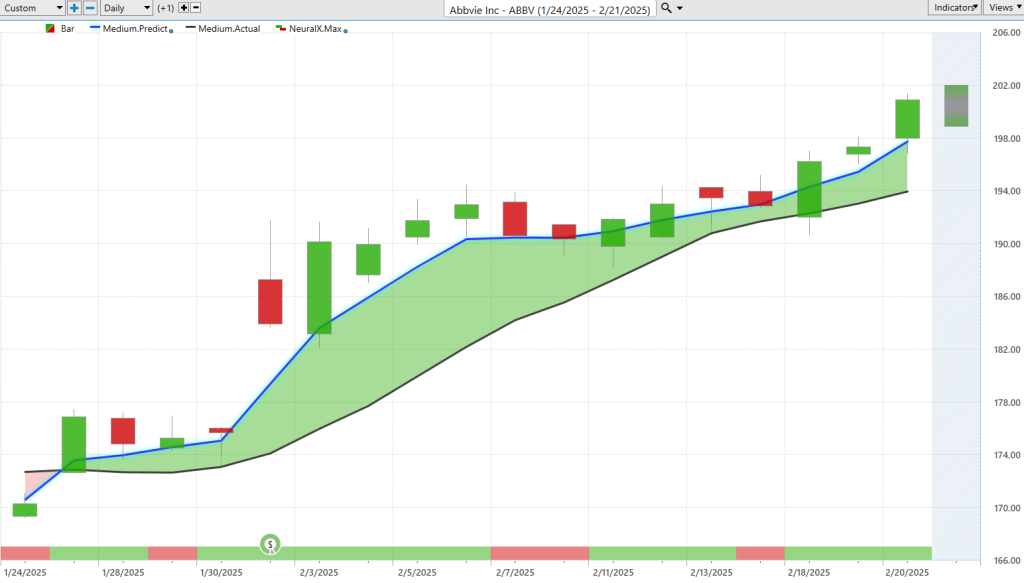
Now, moving on to AbbVie Inc. ($ABBV)—another strong trend where the predicted moving average crossed above the actual moving average. Even though the neural index occasionally flipped bearish, we saw only short-term sideways price action before the uptrend resumed. After earnings, AbbVie ($ABBV) has rallied about 15%, and the predictive indicators have remained very accurate in forecasting key price levels.
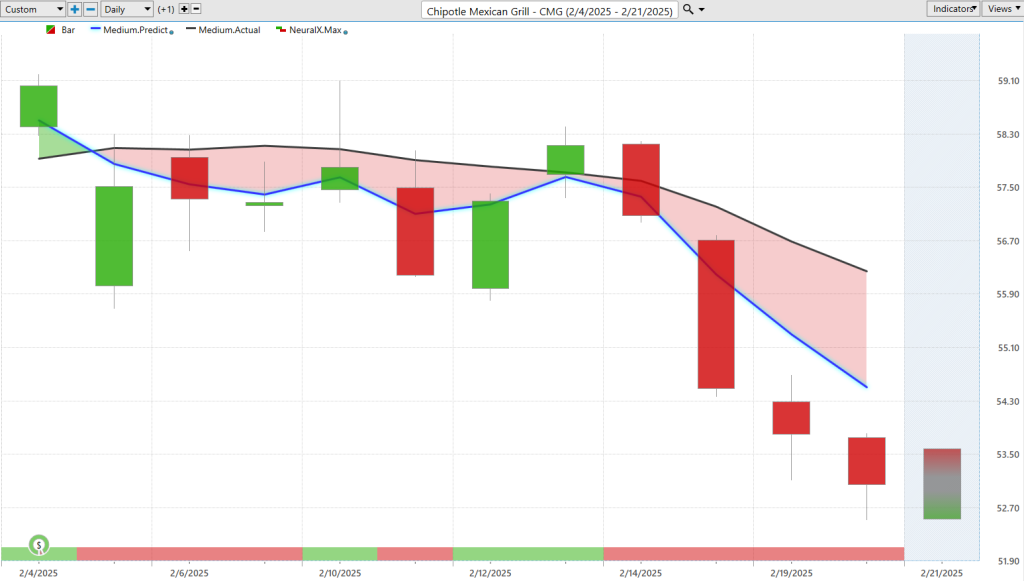
Lastly, let’s look at Chipotle Mexican Grill ($CMG). I wanted to mix things up because while we’ve had some incredibly strong stocks, not everything is moving higher. Chipotle ($CMG) is a good example of a stock in a downtrend. Around earnings, we saw the blue line cross below the black line, indicating a bearish move. Over the past two weeks, in a market that has been relatively strong, Chipotle ($CMG) has declined 8% in the past 10 trading days.
So, while stocks like Hims & Hers ($HIMS) and Yum! Brands ($YUM) have been in strong uptrends, Chipotle ($CMG) has been under pressure. When the market presents these mixed opportunities, it’s essential to focus on strong trends while being cautious with weaker names.
We’ll go ahead and leave it there for today. Once again, this has been our Hot Stocks Outlook for February 21, 2025.
Thank you all for watching—best of luck out there, and bye for now!


