


Register for a Free Live Training
The Hot Stocks Outlook uses VantagePoint’s market forecasts that are up to 87.4% accurate, demonstrating how traders can improve their timing and direction. In this week’s video, VantagePoint Software reviews forecasts for SPDR SPY($SPY), SPOTIFY ($SPOT), STARBUX ($SBUX), Snowflake ($SNOW), Franco-Nevada ($FNV), Chewy ($CHWY)
SPDR SPY ETF ($SPY)
Hello again, traders, and welcome back to the Hot Stocks Outlook for January 31st, 2025. Hope you had a nice week out there in the financial markets. As always, we’re going to take a look at the most recent VantagePoint AI predictive forecasts. If you haven’t already, make sure you go ahead and click on the link down in the description below. You can get signed up for a live demonstration and learn all the specifics about how these predictive technologies are helping traders make better trading decisions out in the marketplace.
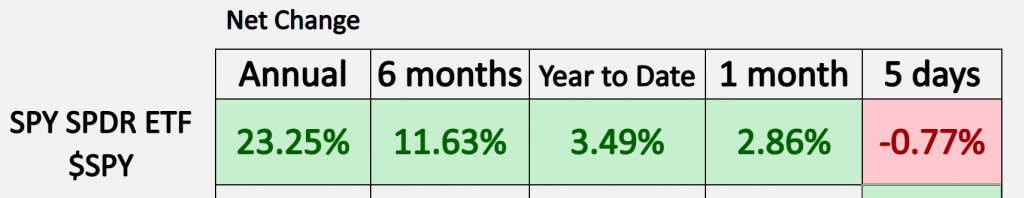
Now, as we typically start out, we can take a look at the SPY, the S&P 500 ETF, and we can see that year-to-date we’re about 3 and a half percent, very similar for the last 30 days, and releasing a lot of choppiness and volatility around a lot of earnings announcements. So, it’s especially important to really identify the strongest markets and opportunities when doing some trading.
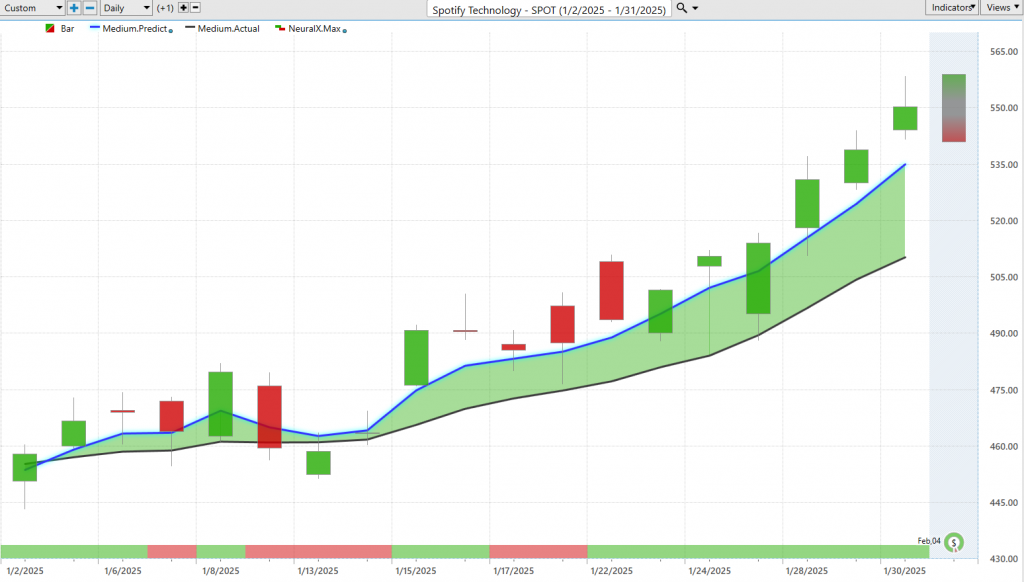
Let’s go ahead and look at some of the most recent VantagePoint forecasts, and we can start here with shares of Spotify ($SPOT). Spotify Technology really acts as a good example of how all of these predictive tools work together. So what you’re seeing here is daily price action. Each one of those candles is going to represent a full and complete trading day, and right up against that price data, you’re going to notice there is a black line and a blue line value.
Now, the black line that you’re seeing, that is actually a simple moving average, or what we refer to as the actual simple moving average, and in this case, it’s a 10-period. So, it looks at the previous 10 close prices, adds them all together, and divides by that number. One of the weaknesses with traditional technical analysis like this is that all the data comes from the past and it only looks at one market in isolation. So, in many ways, it’s really just summarizing what’s already occurred.
And so what VantagePoint traders are able to do is use that as a baseline and look very closely at this proprietary predicted moving average. And for this number, which we can think of as a price, to get plotted on the chart every evening, well, this is where the technology of artificial neural networks come into play. They’re performing what we would call intermarket analysis. So rather than just looking at past prices of Spotify, it’s going to look at other markets that are known to drive and influence future prices. So this can be things like those big ETF groups that gobble up a large chunk of a certain sector or grouping of shares. It’ll also look at other individual stocks, and though this can be positive correlations, inverse correlations, correlations that you may not even identify or seem very relevant but are proving helpful in producing a robust forecast. And it’s also able to look at things like commodity markets, so whether that be agricultural commodities, gold, silver, even things like interest rates and global currencies like the Dollar Index, which has a huge impact on how stocks generally will perform.
And so it takes all of that information and generates these predictive indicators. And so, whenever we see that blue line, which is our from our predicted moving average, move above the black line, what it’s signaling is that prices are expected to go higher. You see, since that signal came through on the Spotify chart, at least this last signal, shares are up about 19 and a half percent just over the past 18 trading days. And so that’s a really nice move, and obviously, you’d want to be aware that okay, well, Spotify is in an uptrend, but this is where some Advantage Point’s other indicators can really round out this forecast and assist you with the type of trading that you might want to do.
So if you look at the bottom of the chart, you see this bar that currently is green, but it can flip to green, back to red, back to green, um, and what that’s doing is it’s solving for a different problem for traders, right? And this being very short-term strength or weakness just over the next 48 hours. So our predicted moving average lets us know the overall trend direction, but the neural index is just looking ahead 48 hours at a time for short-term strength or weakness in the market. And what traders are able to do is pair that with the VantagePoint predicted high and low. So now we’re down to intraday prices, where the market’s expected to trade for the day. That can help set limit orders or potentially profit targets. And so when we look back at all of these predictions against the actual market data, we can see early on these levels serving as great levels to say, okay, well maybe if you want to buy down at those predicted lows, having a limit order there would make you available to go ahead and scoop up shares while the market’s in a downtrend. But you’ll notice you get these periods where the neural index is bearish, and sometimes the market will run a little bit sideways over those time periods, but as long as that blue line remains above the black line, well, the overall trend is up.
So again, really nice move here from Spotify shares, up again about 19% just in the past really few trading weeks.
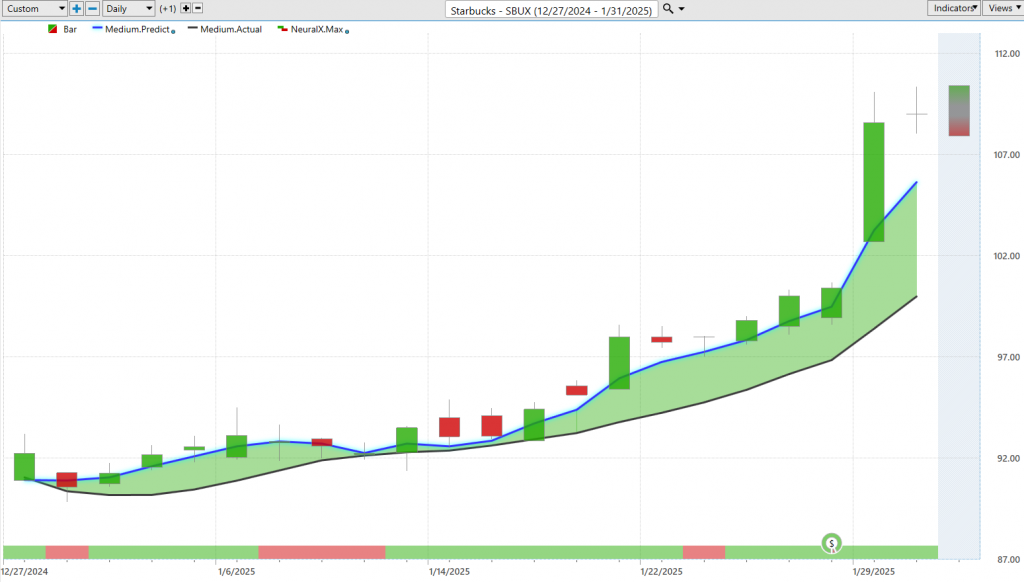
Here Starbucks ($SBUX), shares of Starbucks, and very similarly, we see this blue line crossing above the black line, and actually starting out here, the neural index is bearish. They actually do have a pretty meandering day the next day, not really moving, but once that neural index gets bullish, we see the momentum come in. It gets bearish once again, and you get some sideways price action, but that blue line remains above the black line, and the trend remains intact, really going into earnings, and you actually see the really separation between that predicted moving average and the actual moving average really creating more and more separation, which can be thought of as a stronger forecast, as that prediction of the moving average gets further and further away from the lagging actual moving average. And so, really nice move here through earnings, um, but definitely some nice entries early on before this 19% rally, very similarly to shares of Spotify. We can look at those predicted highs and lows, and it really helps traders accumulate a position at really nice prices. So whether you’re a short-term day trader or trying to establish that longer-term positioning, you see about one, two, three, four, five, six, seven entries involved in this uptrend over the past few weeks here, so nice move out of Starbucks.
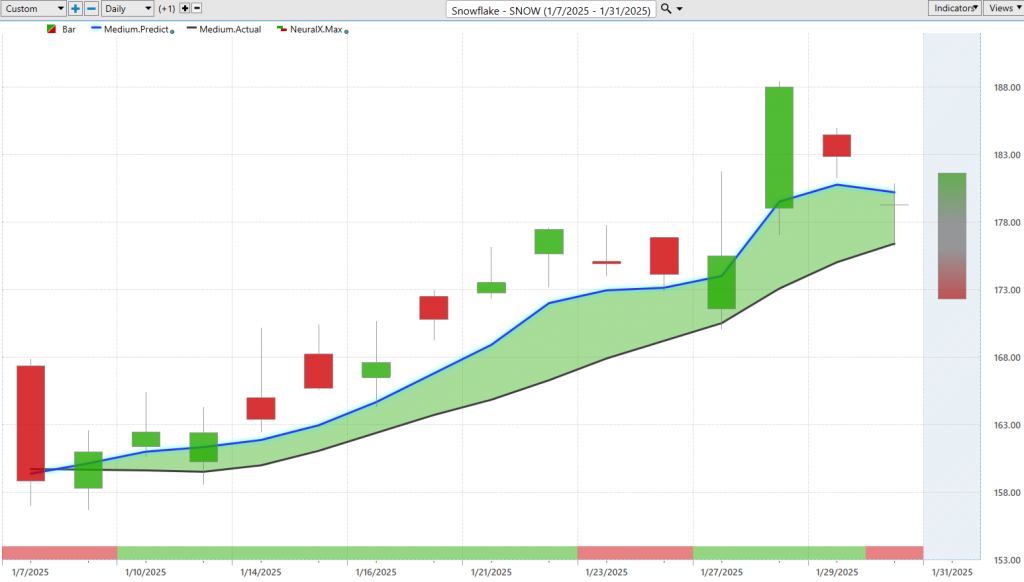
Here shares of Snowflake ($SNOW), and again, we see this blue line crossing above the black line. See the neural index was bearish going into this, but we actually do have some gap downs, and the market is really trading lower 48 hours later. Once the neural index gets bullish, we see the subsequent price action over those 48-hour windows, very bullish, and momentum kicking in. Again, you see here the neural index getting bearish, you get some gap downs in price, but the overall trend very much bullish, right? That blue line well established above the black line, signifying that the trend is still to the upside. So again, we can take a look at this overall move, shares up about 12% in the past 15 trading days, and again, with the help of those predicted highs and lows, really help traders identify where’s a good opportunity as far as intraday price action to get involved, and you know, these days are always interesting because if you’re ready to buy on that day, well, you’re going to get filled right at the open on a gap down, uh, before the resumption of the moves you see here on this day and also here. Market moving down and settling towards these levels before it resumes the uptrend.
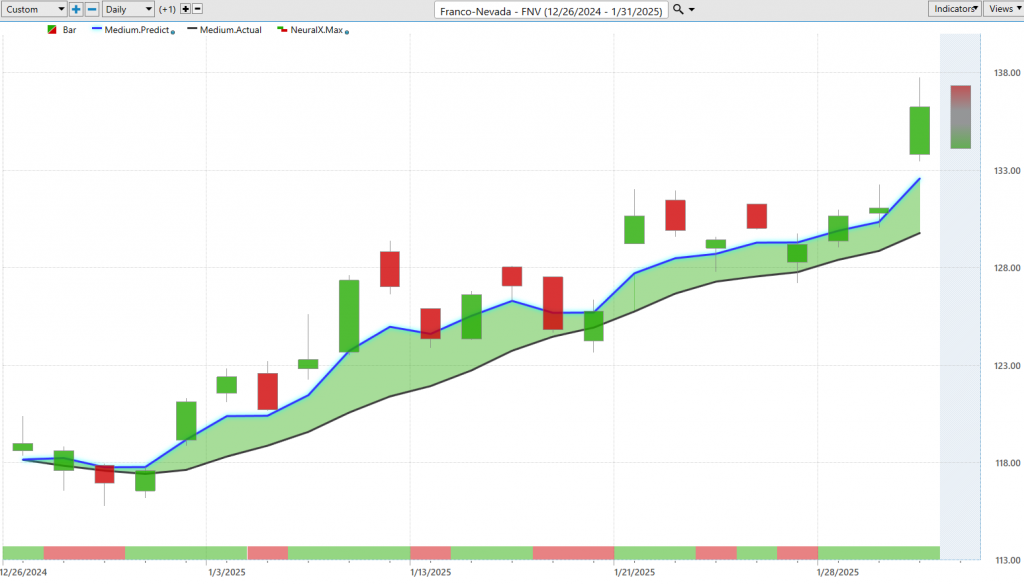
Shares of Franco-Nevada ($FNV), we’ve seen actually shares of platinum and gold do really well here. Here’s Franco-Nevada, you see this blue line crossing above the black line, again some short-term weakness, but that moving average staying on the bullish side here, and saying, look, the overall trend is up, here you only want to go long and take profits on long positions. Overall, this move from the start of that signal is a 15.5% rally over the past 22 trading days, but of course, we can look at those intraday levels provided by the predicted highs and lows, and you see how this works even in a choppy market where things are gapping around, does a good job of identifying levels for traders to get involved and exploit that uptrend, and the same thing on the bearish side here, right? Where you get to these predicted highs, we often see the market trading lower, and offering some new opportunities to get involved at lower prices for a shorter-term trade or trade management.
So again, nice opportunity there in Franco-Nevada, shares up about 15%.
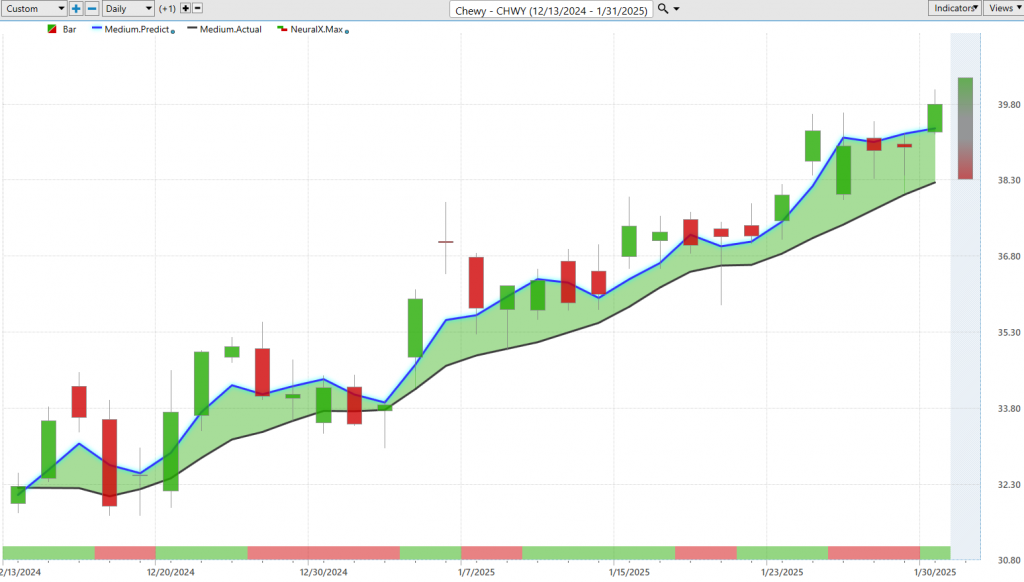
Lastly, here Chewy ($CHWY), so again, these really choppy markets where things look pretty chaotic, but when we have the help of the VantagePoint predicted highs and lows, this can really help us navigate some of these windows. So you see about a 22 and a half percent rally over the past 30 trading days, but multiple opportunities were moving down towards those predicted lows, so we get a lot of movement in the price here, things shaking around, but this is one of the great things about these artificial neural networks, is they’re able to take in the new data and make those changes and adjustments, right? So really adapt to what’s occurring, and you see how you even get these predictions, you know, slinging lower before the trading day, so all of these forecasts for the predicted high and low are given to you the day ahead of time, and you see that it often warns you of some short-term weakness coming into the market, you know, before you even get that weakness coming in. Right, so really nice opportunities here, multiple entries as this uptrend continues, and again, a really nice move out of shares of Chewy to really start out the year here in January. So about a 22% rally in just the last 30 trading days.
So we’ll go ahead and leave it there for today. Once again, this has been the Hot Stocks Outlook for January 31st, 2025. Thank you all for watching, best of luck, and bye for now.


