


Register for a Free Live Training
The Hot Stocks Outlook uses VantagePoint’s market forecasts that are up to 87.4% accurate, demonstrating how traders can improve their timing and direction. In this week’s video, VantagePoint Software reviews forecasts for SPDR SPY($SPY), Microsoft ($MSFT), Henry Schein ($HSIC), D.R. Horton ($DHI), CrowdStrike Holdings($CRWD), Tesla Motors ($TSLA)
SPDR SPY ETF ($SPY)
Hello again, traders, and welcome back to the Hot Stocks Outlook for July 19th, 2024. I hope you all are having an excellent week out there in the financial markets. As always, today we’re going to take a look at the most recent Vantage Point predictive forecast. If you haven’t already, make sure you go ahead and click on the link in the description below and get yourself signed up for a live demonstration so you can learn all the specifics about how these predictive tools are helping traders make better trading decisions day in and day out in the marketplace.
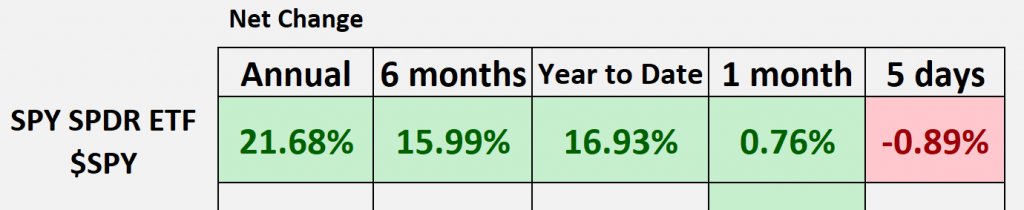
Now, a really exciting week here, building off of last week where we identified that we’re seeing some weakness in those bigger cap stocks. That’s actually why we looked at IWM rather than the SPY, and the homebuilder doing quite well. So, we’ve got some themes that have opened up very recently. Each week, we take a look at the SPY and some of these given periods of time, and we can see this playing out here where, over the year-to-date, we have a really nice move—177%—just in the first seven months or so. A really nice move out of the broader marketplace.
What I highlighted last week is we’re really starting to see those big mega-cap stocks run sideways, which certainly plays into the overall index, something like the SPY that we have here. We want to understand where those better places to focus our attention are based on the Vantage Point predictive forecast. Here’s some really great examples of how all of this works.
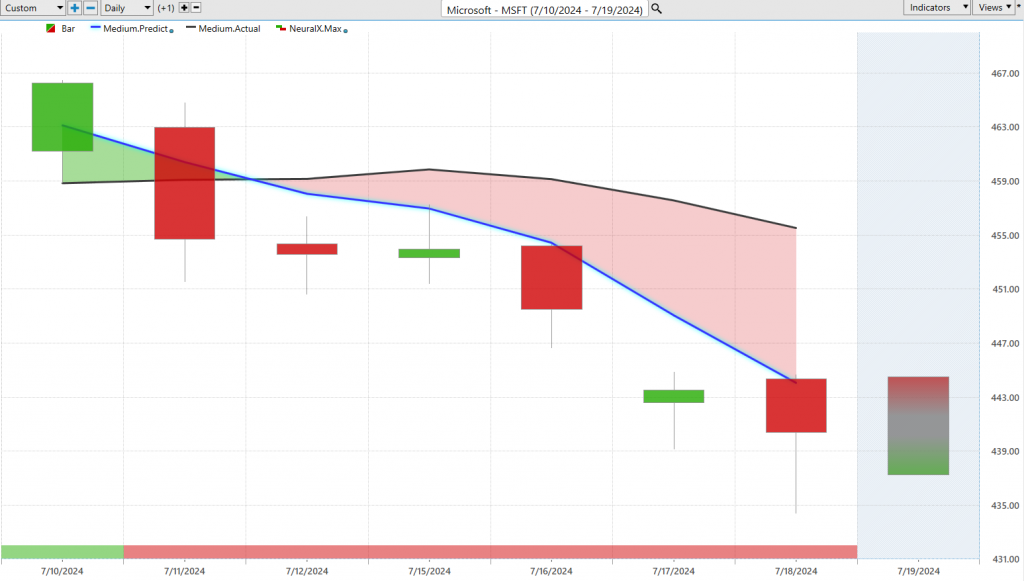
Here in shares of Microsoft (MSFT), what we have here is daily price action. Each one of the candles you see represents a full and complete trading day. Right up against that price data, the first thing that jumps out is there’s a black line and also a blue line value. The black line value is a simple moving average, or what we refer to as the actual simple moving average. In this case, it’s a 10-period, so it just takes the last 10 close prices, adds those all together, and then divides by 10. Indicators like that do a good job of acting as a baseline for us, letting us know where prices have been. But traders want to be ahead of that next move in the marketplace.
What we’re able to do is compare that value to this blue line, which is a proprietary predicted moving average generated via the technology within Vantage Point. This is important to understand because rather than looking at just past prices, which most technical analysis does, Vantage Point’s technology is understanding the relationships that affect and drive the future price of the target market in question. In this case, Microsoft. It’s able to look at other markets that are known to drive and influence and offer important price clues as to where things are likely to go next. This includes things like the SPY, maybe some of those other larger cap stocks that share important market relationships, but also things like currency futures or commodity futures. This global approach understands how dozens of markets are affecting and influencing the trades you’re trading in, essentially the markets you’re participating in, and uses that to generate highly accurate forecasts so traders can be ahead of these moves in the marketplace.
What we actually see here is Friday—before Friday starts going into the trading day. But you see that once the close came on Friday for Microsoft, we actually have that blue line crossing below the black line, indicating that the overall trend is down. We can see that from this point, we’ve gotten about a 1.5% move in Microsoft, and that’s going to affect the SPY and the Qs. So, it’s not terribly surprising to see the sort of price action we got this week. The beauty of this is that it’s not just those predicted moving averages. You also have this bar at the bottom of the chart, this red line, which in subsequent forecasts you’ll see it goes from green to red and back to green. But what it’s doing is always looking ahead just 48 hours, utilizing the technology of artificial neural networks and artificial intelligence tuned to solve a different problem: short-term strength or weakness in the market.
To round out our forecast each week, we look at these predicted high and low ranges, which provide traders with intraday levels to make those trading decisions. Here in Microsoft, where we see that crossover moving to the downside going into the week, you understand that Microsoft is in a downtrend. If anything, you’d want to short, take profits on shorts, and look towards these Vantage Point predicted levels to get involved. You see a perfect entry for the week before we get this aggressive decline in Microsoft, and then we’re seeing more news come out today that’s driving down some of these tech shares like CrowdStrike, which we’ll take a look at shortly.
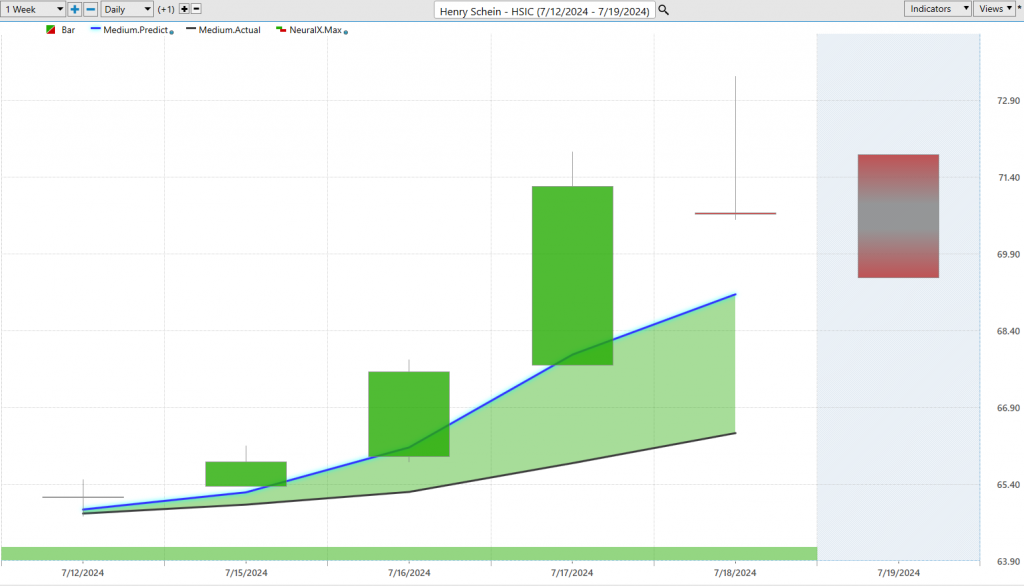
We also see the opposite play out. You always want to say, okay, if I’m using these forecasts to make these trading decisions, we can let them guide us to where the forecasts are actually bullish. This is the whole point in increasing these probabilities to get the sort of move we’re looking for. Here you see exactly the opposite: blue line crossing above the black line in Henry Schein (HSIC), just being a healthcare device manufacturer. Similarly, the neural index is bullish throughout the duration here, and highlighting a place going into this week that’s a much better place to exploit the marketplace and get involved in some of this trade. Towards the end of last week, this would have been Friday, moving down towards those predicted lows and seeing this market start to accelerate. Overall, from those predicted lows, we already have about a 9-10% rally here in just five trading days. Extremely aggressive move, and we can see how accurate all these levels are. Look at this predicted low of 64.78 against the actual low of 64.78. It doesn’t get much better than that when trying to get those entries and identify new trading opportunities.
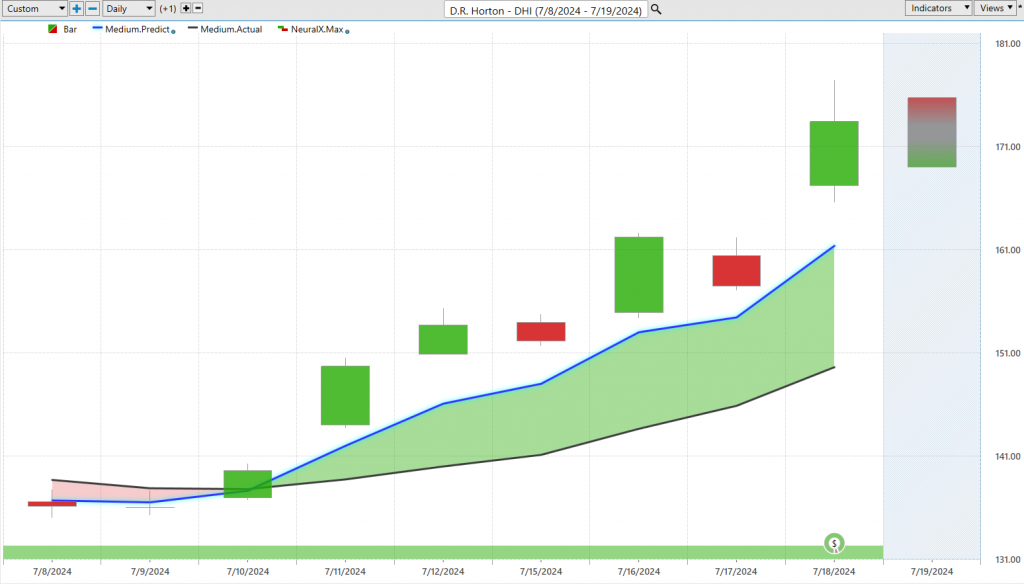
Last week, we also looked at one of the homebuilder ETFs, and we even looked at D.R. Horton (DHI), seeing those predictive indicators start to skew bullish and indicate that there’s some opportunity here. We have earnings coming through here and some volatility, but understanding that we’ve got a bullish trend here. If we look back, this being Friday, Monday, Tuesday, Wednesday, Thursday, now going into the current trading day, we can see how accurate all of these predicted levels are. This is pretty beautiful in D.R. Horton because you see how the market closes right at that predicted low, meaning you really need to hold overnight to benefit from these explosions in price. This happens again, moving down to the predicted low, but the overall trend is very bullish here. Just an area where the Vantage Point predictive indicators have really gravitated towards that, seeing the homebuilder ETFs and the other homebuilding stocks start to get these crossovers to the bullish side, seeing the building material companies. Here you have about a 20% rally in the past six trading days. This is where Vantage Point’s IntelliScan can be helpful to alert traders to these moves as they’re occurring before we start getting that acceleration in prices so that traders can position themselves accordingly.
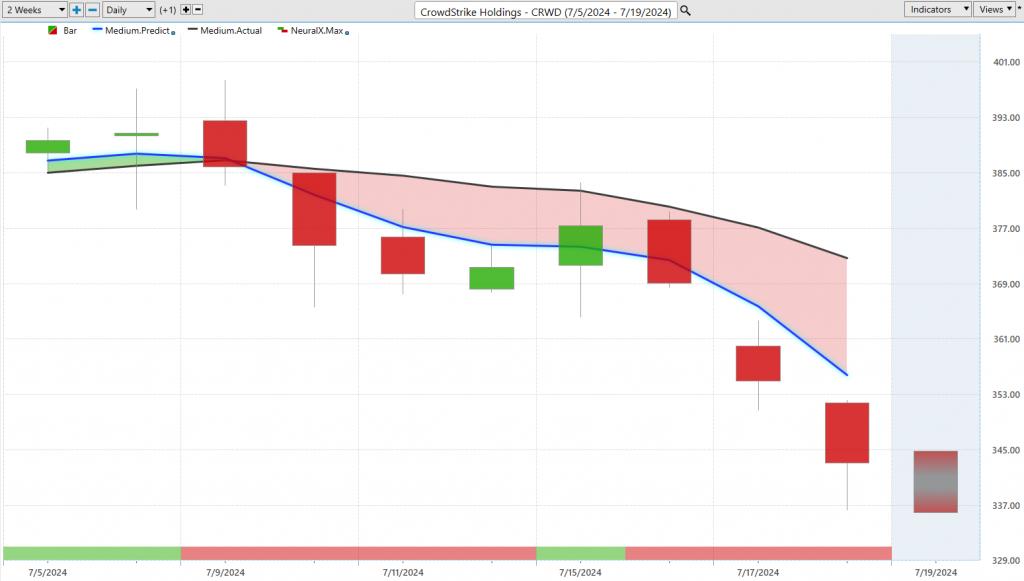
Lastly, I find it interesting that we’re getting a lot of news about CrowdStrike (CRWD) and these global outages of airlines from Australia through the Americas, causing a lot of disruption. It looks like this was a stock that you didn’t want to be holding over a week and a half ago. As we see the tech space start to go lower, the Qs go lower, and a lot of those mega-cap stocks go lower, you should expect that many stocks will follow. Here in CrowdStrike, we see the blue line crossing below the black line, neural index bearish. You get one blip where the neural index pops up to a one or green configuration but then immediately bearish again. For the duration here, pretty much every day says the overall trend is down, exploit those opportunities to the bearish side if anything. The predicted highs and lows offer these levels that say, okay, if you want to get short, this seems like a good area to go ahead and get those positions on. Now we’re seeing things start to move to the downside with even that catalyst of the news driving things lower. We’ve gotten about a 9-10% move, and I’m pretty sure this thing’s going to gap down and continue with that move.
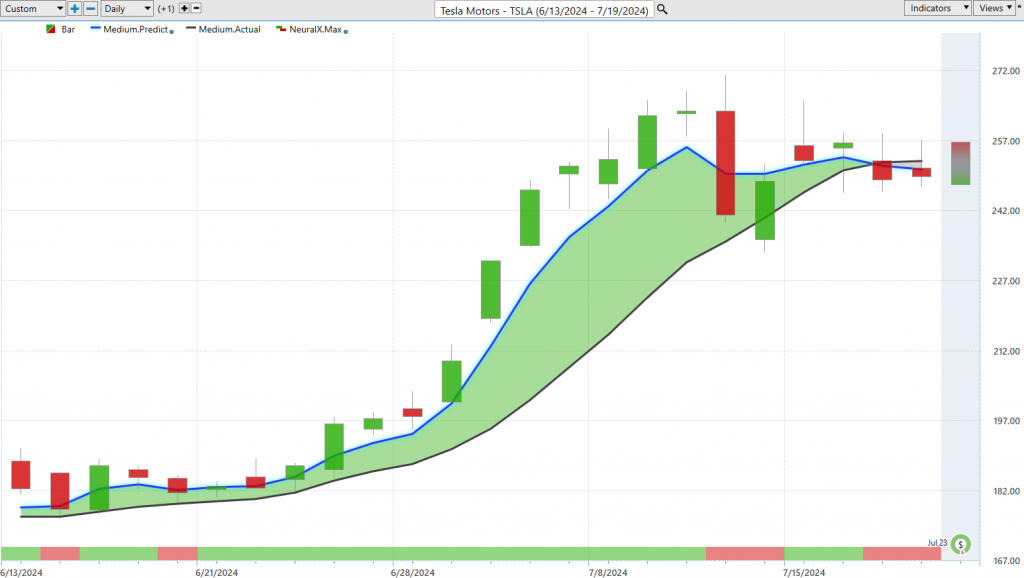
Lastly, we can revisit Tesla (TSLA). This was a market that if you want to go back and watch those previous Hot Stocks Outlooks, we brought it very early on in this trend before we got this huge acceleration. You could see all this strength coming through. Tesla had a rough start to the year, but as these predictive indicators show, we see the blue line crossing above the black line, neural index getting bullish, highlighting an opportunity where you may want to go long, take profits on long positions. We see here this market going up about 40%, 41% in the past 22 trading days. More recently, we see that broad market weakness come in, some crossovers on some stocks that have done well. What you want to identify is back here where this opportunity begins. Vantage Point’s predicted highs and lows can guide the trader whether you want to take some short-term profits along the way or use that to accumulate a position at better prices. You see all these entries down here allowing traders to get a nice entry below 190, and now the market pushing up against 250. Really exciting moves throughout the marketplace, but things shift and change. In the same way that we see these big cap stocks and a lot of the tech stocks starting to weaken, you want to take note of that using features that can help you identify where these predictive indicators start to move in a bullish or bearish direction.
Once again, this has been our Hot Stocks Outlook for July 19th, 2024. Thank you all for watching.
Best of luck and bye for now!


