


Register for a Free Live Training
The Hot Stocks Outlook uses VantagePoint’s market forecasts that are up to 87.4% accurate, demonstrating how traders can improve their timing and direction. In this week’s video, VantagePoint Software reviews forecasts for SPDR SPY($SPY), Terex ($TEX), Power Shares QQQ ($QQQ), Meta Platforms ($META), CrowdStrike Holdings($CRWD), SPDR S&P Aerospace and Defense ($XAR), Raytheon Technologies ($RTX), Northrop Grumman ($NOC)
SPDR SPY ETF ($SPY)

Hello again, traders, and welcome back to the Hot Stocks Outlook for July 26, 2024. Hope you are having an excellent week out there in the financial markets. As always, we’re going to take a look at the most recent Vantage Point predictive forecast. So, if you haven’t already, make sure you go ahead and click on the link in the description below, and you can sign yourself up for a live demonstration to learn all the specifics about how these predictive tools and technologies can help you make much better trading decisions in the marketplace.
Now, as we typically start out, we like to look at the SPY or the S&P 500, and something we’ve been just kind of talking about is that we’ve seen a lot of volatility coming in, especially around the tech space. Last week, we looked at Microsoft and CrowdStrike, a lot of those bigger tech stocks. But that doesn’t mean that there are not good opportunities spread out throughout the market. We’ve actually pushed back down to about 13-14% year-to-date on the S&P, but again, it looks like a lot of stocks are starting to rotate around, and this is where Vantage Point’s predictive tools can be of some benefit here.
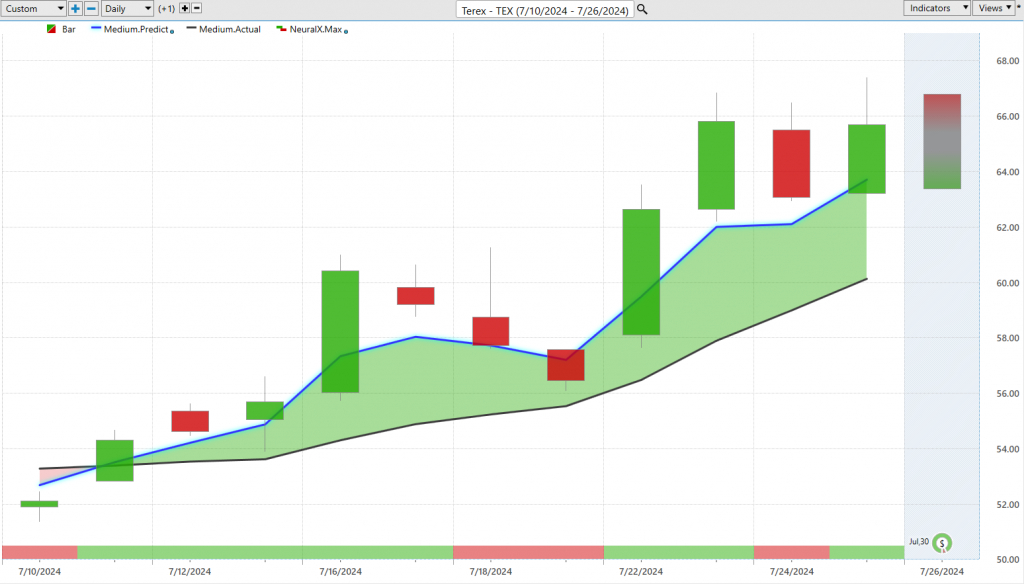
Now, we can start out here with shares of $TEX, and this is a good example because we’ve already looked at a lot of the building material companies, and so this again is in that space. What you’re seeing here is daily price action. Right, so each one of the candles that you see is going to represent a full and complete trading day, and it’s right up against that price data that the first thing you’ll notice is there is a black line and a blue line value. Now, the black line value that you’re seeing there, that is actually a simple moving average, so a very common technical analysis indicator. In this case, it’s a 10-period. And so, what this indicator does is really just look back at the last 10 closed prices, it’ll add those all together, and then divide by 10, and that’s a great indicator and really acts as a baseline for us to let us know where market prices have been, but that’s really a weakness, right? Because all of those prices are really just coming from the past, and they’re really just coming from one market, in this case, TEREX, and going to get dragged around by that most recent price data.
And so, what Vantage Point traders are able to do is compare that to this proprietary predicted moving average, and for that number to get calculated and plotted, essentially a prediction of future average prices, well, that’s where Vantage Point’s technology of artificial neural networks come into play, and they’re performing what we would call intermarket analysis. And so, as we looked last week at a lot of the homebuilders and some of the homebuilder ETFs, well, you start to see a lot of those markets turn up, and this offers some very valuable price clues as to where individual assets are headed next.
So, in the case of TEX, of course, it’ll be able to look at some of those large indices that group up a lot of the larger stocks, but it’s also going to take a look at individual equities that are known to drive and influence future prices, and it may even look at things like commodity prices or the value of the dollar index as well as global interest rates. So, it takes this global approach, looking at all the markets again that are known to drive and influence the target market that you’re trading, and then it generates predictions of where prices are headed in the future.
So, whenever we see this blue line cross above the black line, it’s suggesting average prices are going to start moving higher, and when we start to see that around important sectors of the marketplace, well, we can position ourselves accordingly here. So, you see, you’ve got about a 20% rally over the last 10 days as those blue lines crossed above the black lines, really the past couple of weeks here.
Now, to really round out these forecasts, we have other indicators really tuned to solve different problems. So, if you’ll notice, you see this neural index at the very bottom of the chart, you see this bar that’s going from green to red back to green. Well, this is another indicator that’s utilizing that predictive neural network data, but it’s tuned to solve a different problem here, and this being very short-term strength over the next 48 hours, or you can think of it as a couple of candles. And so, you see here as the overall trend, or goes higher, you see this crossover, neural index bullish, you’ll get these periods where you get subsequent weakness in the price action. Now, as long as that blue line remains above the black line, the overall trend is up. You actually see a lot of separation between these values as well. And to really round this out, you’re even provided a predicted high and predicted low intraday level, so this is really a predicted range where we’ll get the actual market trading that’s going to fill in here, but all of those predictions remain where they were originally set, and so we can look back and actually see, well, how accurate are all of these levels on a daily basis?
And you see, as this trend gets started, telling you to look down towards these predicted lows, we move lower, and you even see when we start to get this consolidation, even before we get this neural index moving to the red position, you’re seeing the predicted range slanted lower, right, letting you know, expect prices to move lower down towards these predicted lows before that, we get that, you know, acceleration in prices.
So, really nice move again, identifying that broader theme throughout the tech or the home builders and construction space, that there are some opportunities spread out here.
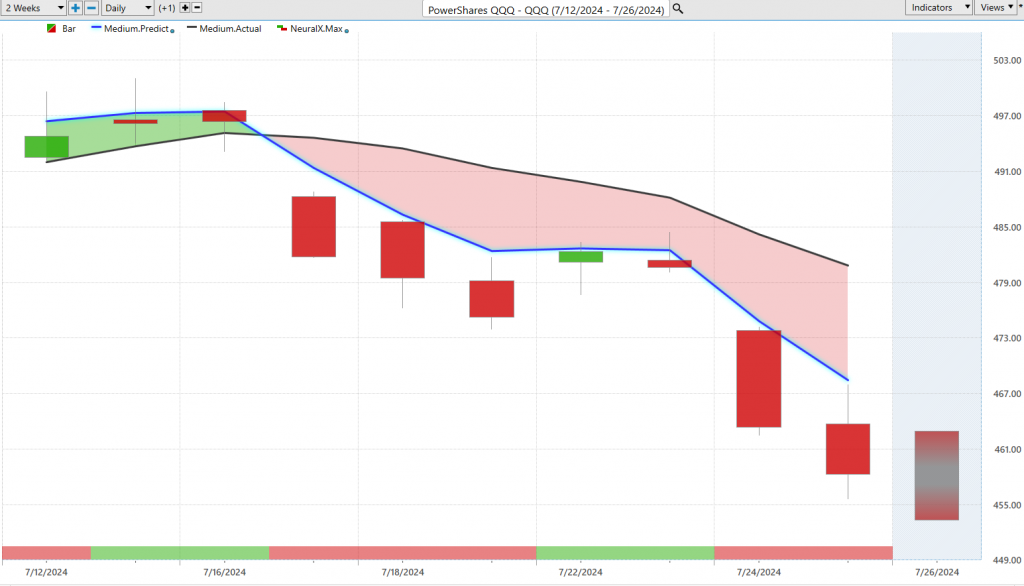
Now, when we move over to some of the tech space, here’s actually the Q’s, so you know, grouping up a large number of tech stocks. Well, we see really just the opposite here, right? Blue line below the black line, neural index bearish. We get a little blip here where we get a little bit of sideways price action, but this has really been warning traders that, look, the overall trend, especially in these large cap names, is very bearish, and if you want to make some good trading decisions, this is really a place that’s probably going to give you some trouble if you’re not on the short side of things. You see, got a 6% decline just over the past seven trading days.
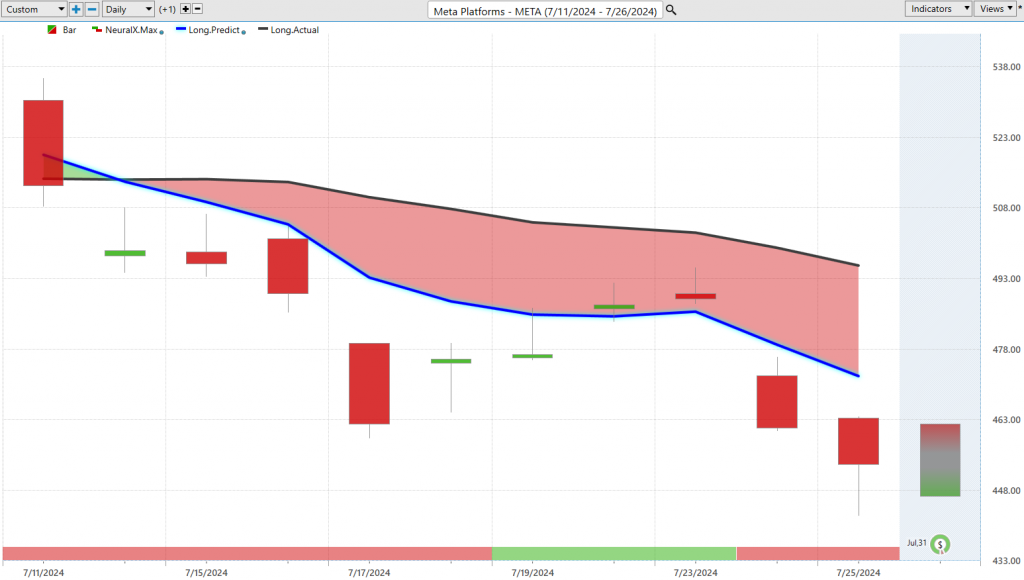
And of course, this plays into assets like Meta and Microsoft and Micron and Nvidia, and all these exciting stocks that have done really well this year. Well, here we see in Meta, getting that blue line crossing below the black line, you notice the neural index does an excellent job here of warning that hey, there’s likely to be some subsequent strength in the price action relative to where we’re coming from, but the overall trend here is very bearish, and the last thing you want to do is get on the wrong side of a lot of these stocks when they start to, you know, start moving the other direction, right? It’s about a 9% decline just in the past 10 trading days of Meta, so it’s certainly an area that we want to avoid until we start seeing those predictive forecasts turn higher.
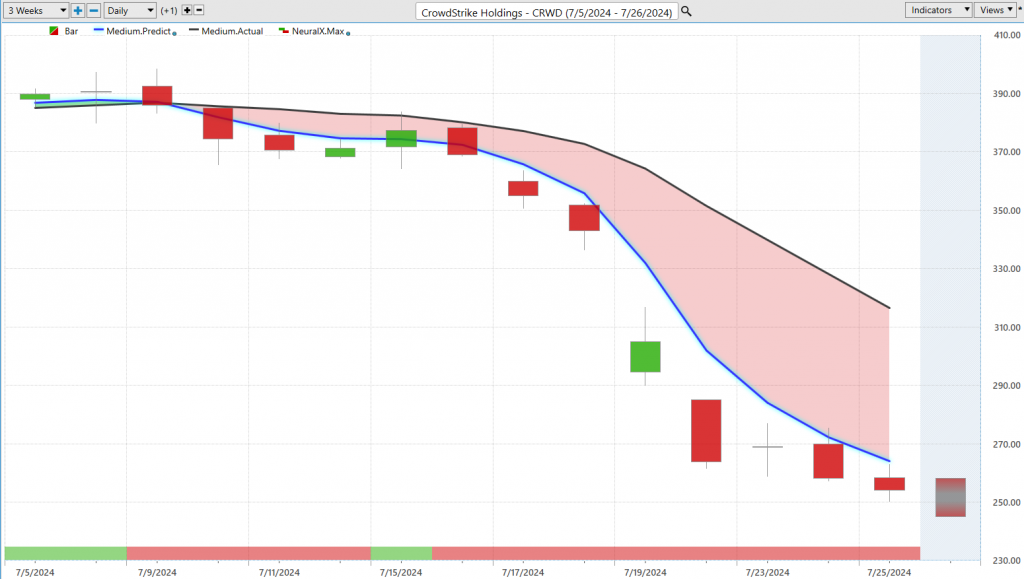
Another tech space here is CrowdStrike Holdings, right? So, really a lot of news driven but despite all that news and really volatility coming into the market, we see that this actually crossed to the downside very early, so getting that indication that you really don’t want to be long here going all the way back to really the early part of July, and again, as long as that blue line remains below the black line in this case, well, the trend is remaining lower.
Now, we can again look at those predicted highs and lows, and you see as the market before we really get this decline, we get some levels where we get that neural index or predicted highs being hit before we get that subsequent price weakness, and just really, what I want to highlight here quickly is that even as you get all that noise and volatility coming in, the neural networks are going to keep updating, and you’ll notice that as we get things bouncing around, really get right back on track, neural index doing a good job at identifying levels where traders can short, take profits on those short positions. So, really huge move here in CrowdStrike, we see the entirety of the move here down 33% now in just 11 trading days.
SPDR S&P Aerospace and Defense ($XAR)
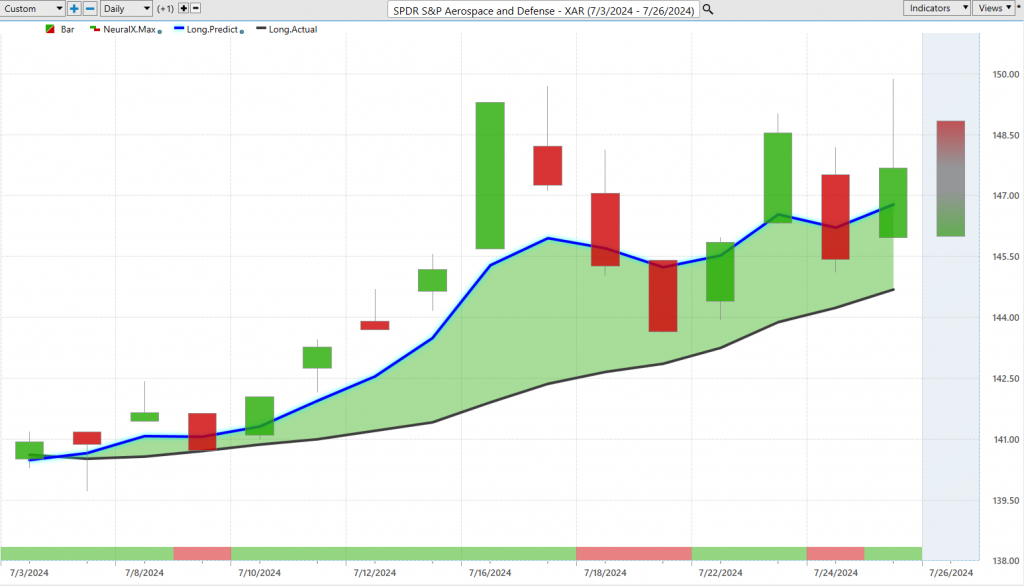
And so, in that same sort of theme there of identifying some weakness via the ETFs and some of the broader markets that can help us with our analysis, well, here we actually see aerospace and defense, another area that’s actually looking quite strong here, with the exact same forecast here. So, we see our blue line crossing above the black line, neural index bullish going into this trend, and we’ve gotten a really nice move just via this ETF.
And what’s really nice about this, again, is these shorter-term predictive tools, so whether that be our neural index or our predicted highs and lows when we go up and bring up those predicted trading ranges, you can see how effective this is, right? So, you know you want to be on the bullish side, a couple of early entries here to get on the bullish side of things, but again, notice as this market consolidates, it’s really warning you that look, expect these predicted high and low ranges to move lower, and again, you have all this information beforehand, right? So, even as the market day closes here, it’s letting you know, expect this range to actually slant lower, warning you of that weakness coming into the market.
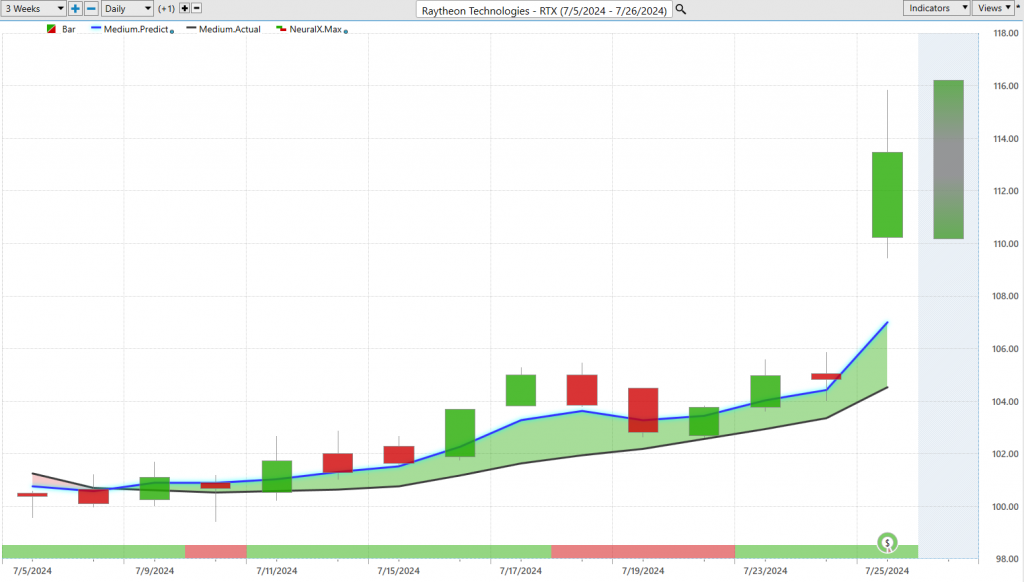
And so, let’s go ahead and move forward here on Raytheon, right, to some of those individual stocks within the space, and again, we can take this same approach, as long as that blue line remains above the black line, neural index bullish, and then you can use those predicted high and low ranges to manage the trading opportunity, understanding that, okay, well, we want to be buyers in this market, looking for price to move a little bit lower in tray, and you see that as we get this earnings push, a lot of strength just generally throughout the sector here.
So, when we take a look at the overall move, we’re probably going to see things continue here, as we see this market go up about 12% just in the last 13 trading days.
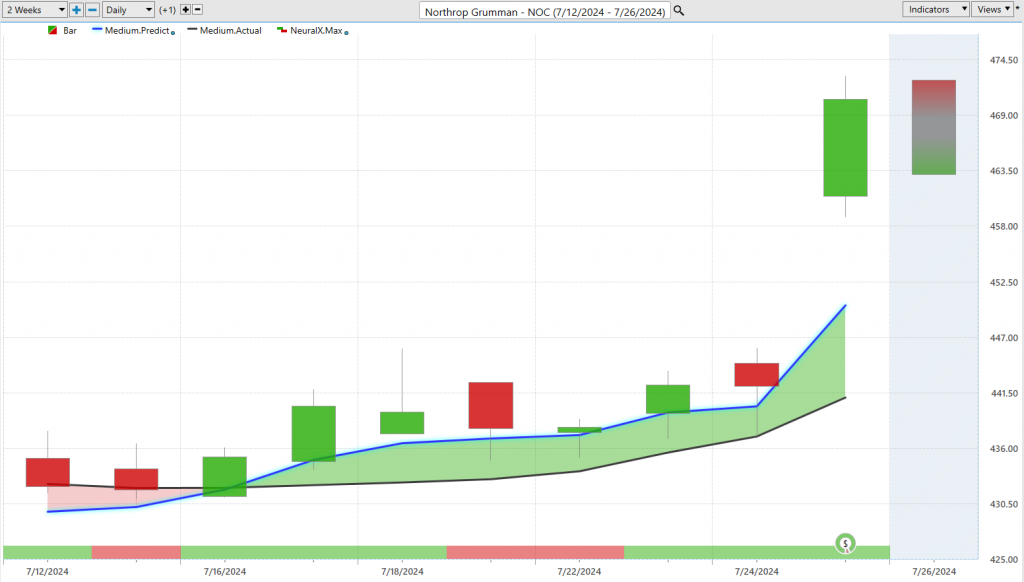
Here’s Northrop Grumman. So, what’s really helpful about all of these predictive tools is that we can actually scan for where these predictive indicators are getting bullish via Vantage Point’s IntelliScan. So, over the past couple of weeks, we’ve taken a quick little peek at this, but it’s extremely helpful in identifying these important shifts in the marketplace.
So, here in Northrop Grumman, you again see that blue line crossing above the black line more recently, notice your neural index, it gets bearish here, and you get again those two days of subsequent sideways price action, a little bit of selling, but the overall trend here is very bullish, and as you see that index get bullish, the momentum return, and identifying some really nice places of value to get involved in the market. So, again, you see all of these predicted low levels coming in really at exceptional prices during the week before we get this acceleration around earnings, and the markets going higher here.
So, whether this be again these two stocks, there are again other defensive stocks, and they’re really all doing quite well, but you want to be able to identify that via again some of these ETF sectors and really identify where you can get those nice entries down at Vantage Point predicted lows. So, you see about an 8% rally here just in the past seven trading days on Northrop Grumman.
And so, we’ll go ahead and leave it there. Really exciting opportunities opening up throughout the space, but also a lot of volatility, so you want to be careful, identify those areas where probability is really on your side, to get a movement higher in prices or, you know, go lower if you want to be on the shorter side of things.
Once again, this has been our Hot Stocks Outlook for July 26, 2024. Thank you all for watching, best of luck, and bye for now.


