


Register for a Free Live Training
The Hot Stocks Outlook uses VantagePoint’s market forecasts that are up to 87.4% accurate, demonstrating how traders can improve their timing and direction. In this week’s video, VantagePoint Software reviews forecasts for SPDR SPY($SPY), American Express ($AXP), Tesla Motors ($TSLA), Adobe ($ADBE), Microsoft ($MSFT), Palo Alto Networks ($PANW)
SPDR SPY ETF ($SPY)
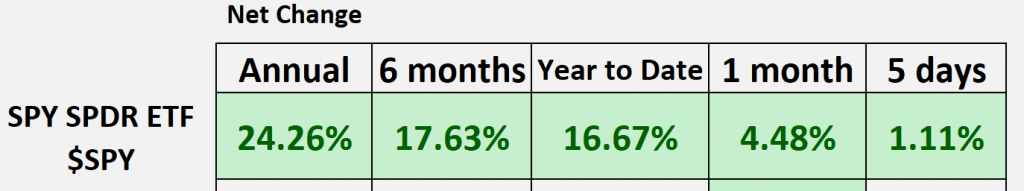
Hello again traders, and welcome back to the Hot Stocks Outlook for July 5th, 2024. I hope you are having an excellent week out there in the financial markets, and had a nice holiday getting through the July 4th week. Like we typically do each week in the Hot Stocks Outlook, we like to start out by taking a look at the broader S&P 500. So what we can see here is that year-to-date, we’re up over 16.5%; over the last 30 days, we’re up about 4.2%. We’ve seen a lot of markets do extremely well—some of those we’ve been talking about and covering in our Hot Stocks Outlooks each week. So, let’s go ahead and jump on into this.
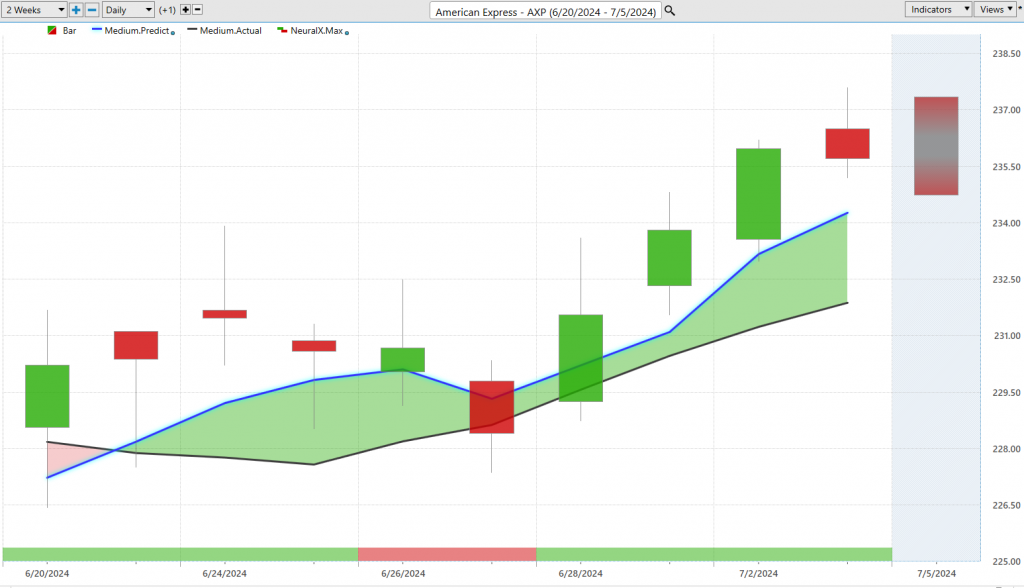
I actually wanted to start out with American Express ($AXP). This is a good example that really just highlights how all of these predictive tools and indicators work together. Regardless of if you’re a day trader, swing trader, or if you’re trading a particular set of markets, this is all going to work exactly the same. What we have here with American Express is daily price action; each one of these candles that you see there represents a full and complete trading day. It’s right up against all that price data. The first thing that’s going to jump out here is that there is a black line and a blue line value right up against those daily bars and candles.
The first thing to understand is that that black line value is actually a simple moving average—this is a very common technical analysis tool. In this case, it’s a 10-period, so it looks back at the previous 10 closes, adds them all together, and then divides by 10. What we really use that as is our baseline; it really lets us know where market prices have been. It’s going to just re-acclimate to that most recent close and really get dragged around by the data. This lets us know, gives us that baseline of where prices have been, but traders need to be ahead of that next move in the marketplace.
What VantagePoint traders are able to do is compare that black line to this blue line, and for this number, which is essentially a prediction of future prices, to get calculated and plotted on the chart every evening. Well, this is where the technology of artificial neural networks come into play, and what we would say is that they’re performing what we would call intermarket analysis. So what that means is that there’s very important price clues, whether they be in things like XLF, like the financial ETF, other individual stocks within the financial space, other individual stocks that may not seem to share any apparent correlation, but the neural networks have picked up on this information and are incorporating it into the forecast.
But it goes all the way down the line—it’ll go down to things like the value of the dollar index, those major indices like the S&P 500, but it’s also going to be able to look at global commodities like gold, oil, whatever is again applicable to that target market that you’re doing analysis on. So, it really summarizes all of these interacting and intersecting relationships and then generates highly accurate predictions of where prices are headed next. And so, if you’re using tools that don’t have the ability to pick up on those price clues that are happening in other markets, you’re constantly going to be at a disadvantage.
And so whenever we see this blue line cross above the black line, suggesting average prices are going to start moving higher, you may want to look at American Express or even maybe more financial stocks as we start to see the market recover here. As long as that blue line remains above the black line, the overall trend is up, and you would therefore want to get long. Now, this isn’t a huge move here, but it has been a good indication of how all of these tools work together.
Right, so, uh, again, once that blue line crosses above the black line, well, you would be in an uptrend. We can see that this market has crept up just a few percent here. But what I wanted to highlight here are some of these other predictive indicators. Right, so, if you look at the bottom of this chart, it’ll go from green to red, back to green. This is also a tool that’s utilizing that exact same approach, looking at those in-market relationships and generating highly accurate predictive forecasts. But it’s tuned to solve a different problem than our predicted moving average in that it’s looking for short-term strength over the next 48 hours. You can think of it also as two candles, right—short-term strength or weakness in the marketplace.
You’ll notice over the course of this trade, as long as the blue line remains above the black line and the neural index is bullish, well, you’d expect some momentum. But notice that the neural index gets bearish here, and certainly, the next couple of trading days, the market moves lower. We get a little bit of a gap up here before the continuation, but as that momentum comes back into the market, the neural index picks up, and you see this market starting to accelerate to the bullish side.
So, regardless of what markets you’re trading, this all works the same way—identifying the overall trend, where there might be that short-term strength or weakness in the market, but understanding that as long as that blue line remains above the black line and the neural index is bullish, it’s likely where we’re going to see some momentum in the market.
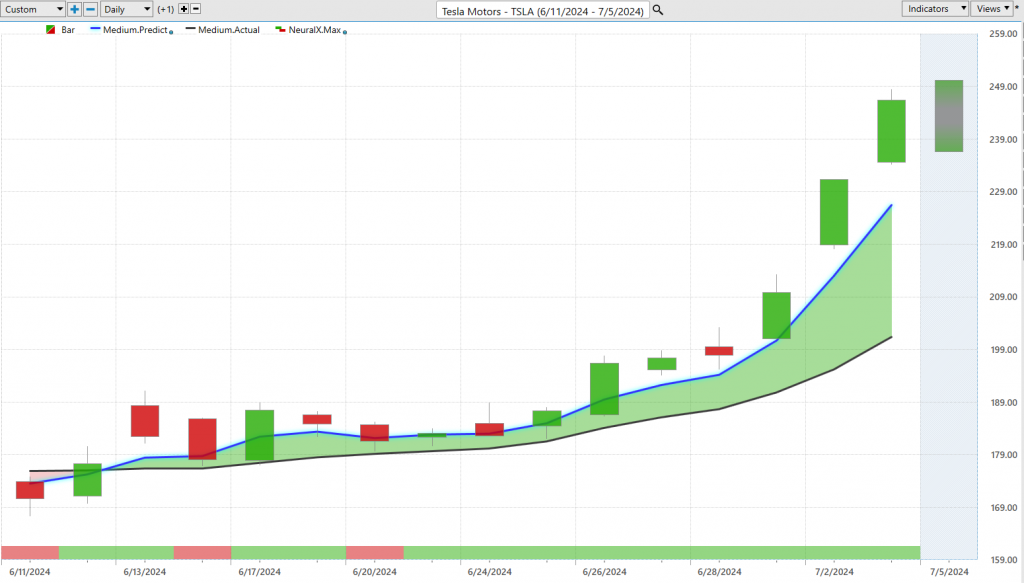
One of the most obvious places this last week where this has occurred is Tesla Motors ($TSLA). We actually looked at this last week before we got this big run-up in the shares, and that’s because we can see, just like American Express, this blue line crossing above the black line indicating okay, we’re in an uptrend. We have the neural index going bearish, indicating okay, sideways and down over those subsequent 48-hour periods, but notice as that neural index gets bullish and remains bullish, that momentum really comes into play, and we get a really exciting move in the marketplace. Probably the most exciting move in all of the marketplace, as we’ve seen the S&P just sort of trickle sideways here. A 35% rally in the last 14 trading days—I mean, really, just the past few trading days there’s been 20% pretty easily here. So really nice opportunity here in shares of Tesla. And again, we actually get the benefit of predicted high and low levels.
So, every week what we do is we look at not only the overall predicted moving average, that neural index letting you know of the short-term strength or weakness in the market, but we’re also provided a predicted high and low range. And so, just like with American Express, you want to be able to identify that shift early on in the market and start accumulating a position. And this is where those predicted high and low ranges are really exceptional to say okay, well if you want to get long Tesla, try to look down here at these predicted lows would really be more ideal so that you can accumulate a good position at the bottom part of the range before we get this resumption of trend and a nice acceleration in prices.
Once again, a really nice opportunity there in Tesla. We’re seeing again the broader tech space do really well, and when you start to see again these forecasts get bullish across the board, well then it gets pretty easy to identify where you want to go ahead and stake out some positioning. A really nice 35% rally pretty easily there just in the past 14 trading days here.
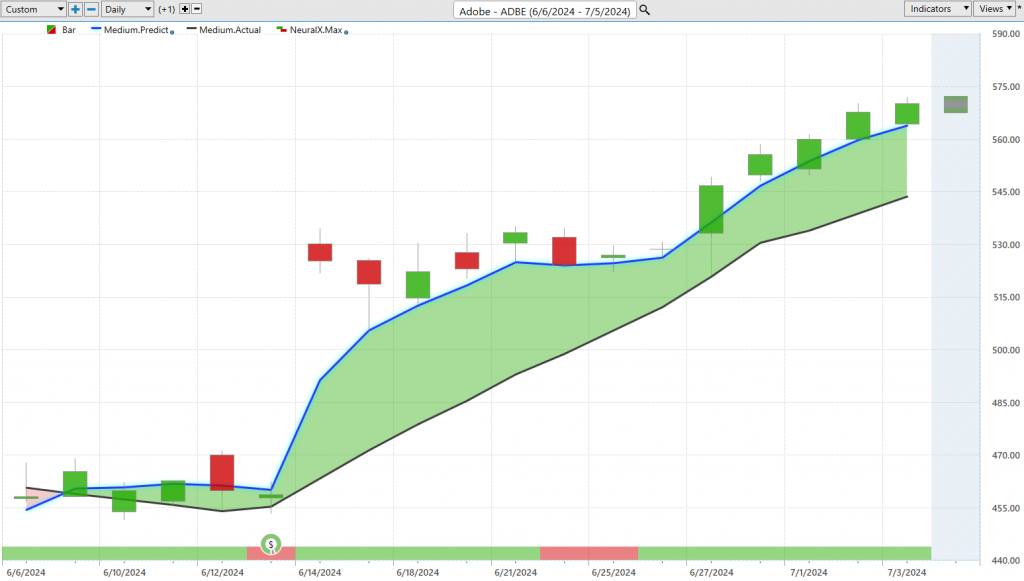
Shares of Adobe ($ADBE), and we got this move right around earnings, but we see this quite a bit—blue line over black line, neural index bullish. Here’s your earnings, but let’s take a look at after all of that volatility how did the daily predictive forecast work, right day-to-day, hey, should I add to the position, take some profits away. What we see here, if we go ahead and bring up those predicted high and low ranges, of course, we’re going to get that move in the direction of the predicted moving average around earnings. So a lot of volatility, but notice here that even after this huge push how quickly the predicted highs and lows get back on track and are helping traders really navigate their purchasing or short-term trading that they might be doing in the market here.
So, a really nice opportunity here in Adobe, whether you’re getting in before the earnings, after the earnings, there’s been some nice trading. And again, that blue line still above the black line since this 22.7% rally over 17 trading days.
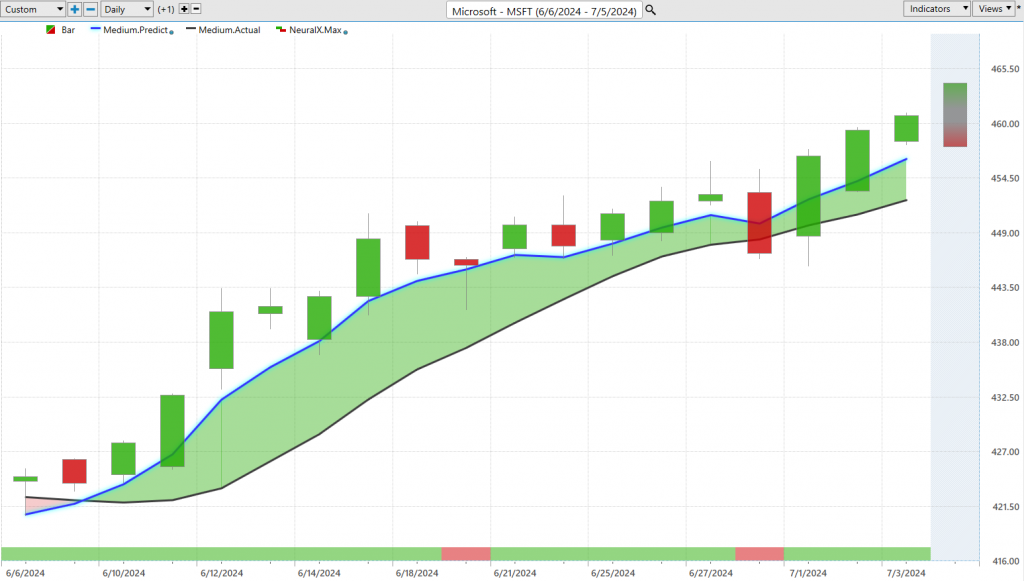
Here, here’s Microsoft ($MSFT)—so this, really more closely aligned with things like the S&P 500, really strong correlations there. But here you see this blue line over black line, neural index bullish, a couple of blips here where the neural index goes bearish, but you see overall, day-to-day, you’re getting a lot of momentum here from these tools, and a lot of distance, as far as the predicted moving average, above that actual moving average. We’re just seeing again a lot of strength in tech, the overall indices holding up quite well, and certainly Microsoft we see, since that last bullish forecast as the blue line crosses above the black line, about an 8% move. Right, so you’re not going to get as big a move as things like Tesla and some of these tech stocks, but you see just grinding higher, a really healthy move there, about 8.5% just over 17 trading days.
Lastly, again another tech name here, so you really get this theme really coming out and that really helps to identify that via things like the VantagePoint and TesScan. So there’s some features here that allow us to actually scan for hey, where are there fresh predicted moving average crossovers, right? Is it the first day that that blue line crossed above the black line, or maybe you want to find strong trends like things like Tesla and say okay, well where have we been in an uptrend for a couple of weeks now? And we have that strength from that short-term forecast to help with some short-term trade management. But you see here again taking these forecasts, here’s where the trade starts. We have that neural index getting bearish and you see we go into a little bit of a consolidation and sideways phase. But once that neural index peaks up again, that’s where we really start to see that momentum pick up in the marketplace.
And once again, we always look at those predicted highs and lows. So what we need to understand here is that every single day you’re provided this predicted range and then the actual market trading day and data will fill in that space. And what we’re doing is looking back and seeing how accurate is every single one of those predictions on whatever particular day we were looking at it. Right, so you see that this is where this trade starts, as far as the overall trend from the forecast, and look at these predicted lows. Every single day, saying you want to look down towards these predicted ranges, even on this down day, notice how the range slants lower, letting you know, hey, look we still have bearishness from the neural index, look for lower prices here. But sure enough, let you know again, still be careful, we may want to scoop a little bit lower, but neural index gets bullish, that momentum comes in, and really off to the races there.
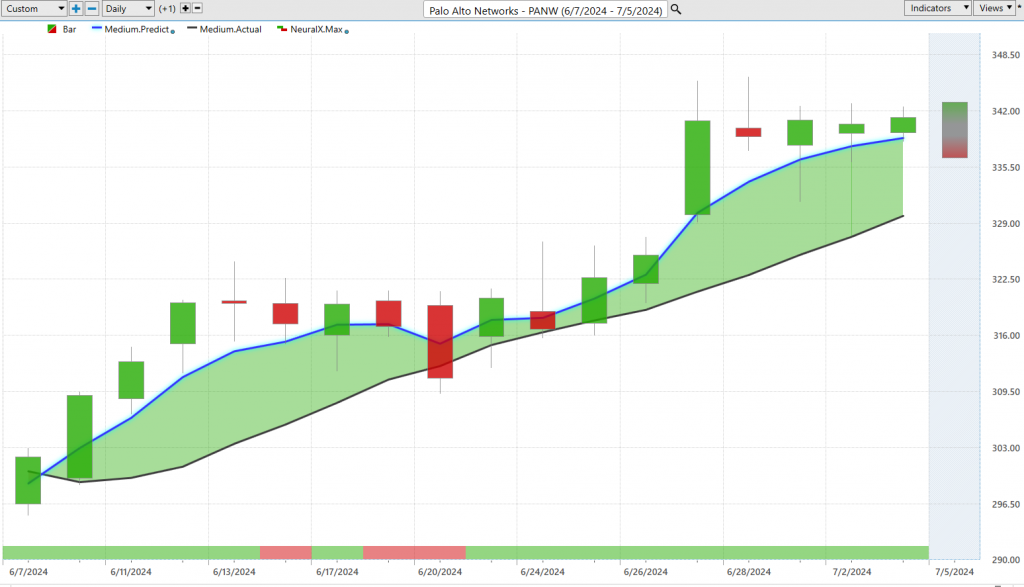
So, really nice opportunity here in shares of Palo Alto Networks ($PANW). Again, just the broader tech space doing quite well. So you know, when we start to see things like Tesla pick up, the indices doing well, Microsoft trending well, it gets pretty simple to figure out okay, well where’s that strength in the market, where’s the attention. And you see here about a 12% rally just in 17 trading days. So, we’ll go ahead and leave it there for today. But once again, this has been our Hot Stocks Outlook for July 5th, 2024. Thank you all for watching out there. Best of luck, and bye for now.


