


Register for a Free Live Training
The Hot Stocks Outlook uses VantagePoint’s market forecasts that are up to 87.4% accurate, demonstrating how traders can improve their timing and direction. In this week’s video, VantagePoint Software reviews forecasts for SPDR SPY($SPY), Cardinal Health ($CAH), Home Depot ($HD), Palantir Technologies ($PLTR), Shake Shak ($SHAK), Albemarle ($ALB)
SPDR SPY ETF ($SPY)
Hello again, traders, and welcome back to the Hot Stocks Outlook for June 21, 2024. Hope you are having an excellent week out there in the financial markets. As always, we’re going to take a look at the most recent Vantage Point predictive forecast, so if you haven’t already, make sure you go ahead and click on the link in the description below. You can sign up, get a live demo, and really learn the specifics about how these tools and technologies can help you make better trading decisions out there in the marketplace.
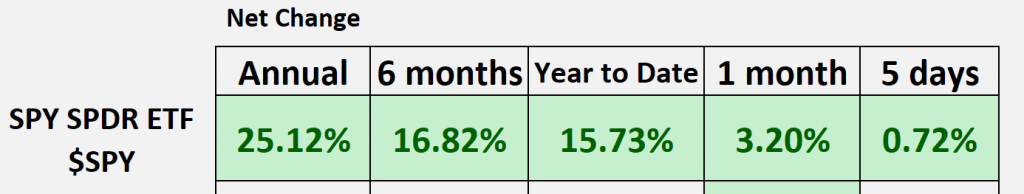
So, what we typically do here, right, is take a look at the S&P 500. This week, we’re up almost 16% year to date, which is obviously a really nice move. Over the last five days, it’s about a half a percent increase, and we’ve had a really nice start to the month. But I think we want to be a little careful. A lot of those stocks that have done really well are starting to see volatility pick up. This is where trade management is very important and really identifying solid trading opportunities with the help of the software here.
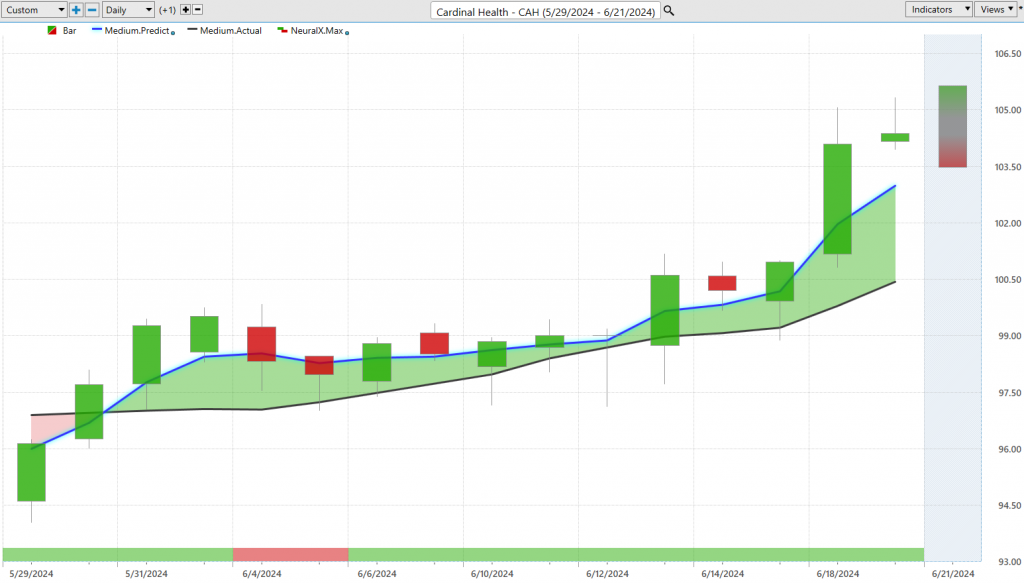
What I want to do is highlight how this all works, and Cardinal Health ($CAH) is actually a really nice example of how all of these predictive indicators work together. So, if we look right against the price action, what we have here is daily price action. Each one of the candles that you’re seeing there is going to represent a full and completed trading day. What you’ll first notice is right up against all of that price data, there’s a black line and also a blue line value. You see those values changing day to day.
Now, what that black line value is, is actually a simple moving average. This is a very common technical analysis indicator. In this case, it’s a 10-period moving average, which looks back at the last 10 closes, adds them all together, and then divides by 10. I tend to look at this as our baseline, which lets us know where market prices have been over a given period of time. But obviously, a trader needs to be ahead of that next move in the marketplace. So, what we’re able to do here is compare this lagging moving average to this proprietary predicted moving average. This number, which is essentially a prediction of future prices, is calculated and plotted on the chart every evening. This is where the technology comes into play, performing what we would call intermarket analysis.
Now, if you actually go look at something like the healthcare ETFs, we had a huge spike towards the end of May and beginning of June. That has an effect on things like Cardinal Health and Humana. A lot of these healthcare provider stocks are influenced by such movements. The software is able to analyze that, looking at other individual stocks like those big healthcare providers and potentially stocks with inverse correlations that seemingly have nothing to do with Cardinal Health or healthcare but have proven there’s a very tight relationship that can offer insight into accurate future predictions. It will even go down the line looking at things like the value of the dollar index, global interest rates, and recent moves in gold. You know, all those gold mining stocks and the gold market share important price clues. That’s what the software is really doing—analyzing that information and using it to generate highly accurate price predictions. These predictions of future prices are used to construct these proprietary predictive tools.
Whenever we see this blue line cross above the black line, we’d expect average prices to start going higher, and a trader may want to go ahead and take a long position in the marketplace. Cardinal Health is a big ship that moves pretty slowly, but you had a 6% rally, which is a really good example of how all of these predictive tools work together. If we come down to the very bottom of the chart, you’ll notice this bar that goes from green to red and back to green. This is also an indicator utilizing that intermarket analysis data and using those neural networks to forecast future prices. They’re solving a different problem—it’s not looking at the overall trend direction but rather a very short-term 48-hour strength or weakness in the market. Whenever that most recent forecast comes through, it’s essentially a prediction for the next 48 hours. This is how traders can identify momentum coming into the market, also potentially knowing when to buy on a dip scenario.
You’ll notice that the overall trend is up here. We get one day where that neural index is bearish, and the market runs sideways for the next few days. But as that neural index gets bullish, this momentum comes back in, and the overall trend takes off. If you had those two tools, it would be exceptionally helpful to navigate the markets and get involved in some of these opportunities. It even goes a little further than that, where intraday, every single day, you’re provided a predicted high and a predicted low. These levels offer nice guidance on where to add to positions, where to take some profit, and of course, get updated every single day.
We have this habit each week of taking a look at the overall trend and then looking at those accurate daily predictions to see how accurate all these trading days were. We’ll have a candle that’s going to be completed here and fill in, but the predictions won’t change. As we look back, you have this help that says there’s a trend here, look to buy down at these predicted lows. Those are the ideal intraday levels to accept the position. This is a great example of how, even as the market runs sideways, you get eight entries at the lower part of that range before accelerating higher and seeing the trend pick up. Regardless of what type of trading you’re doing—maybe you’re a trend trader and you want to identify those important shifts—you’ll notice that a lot of these shifts come at the end and beginning of a new month. In Cardinal Health, you see a really nice opportunity at the beginning of June.
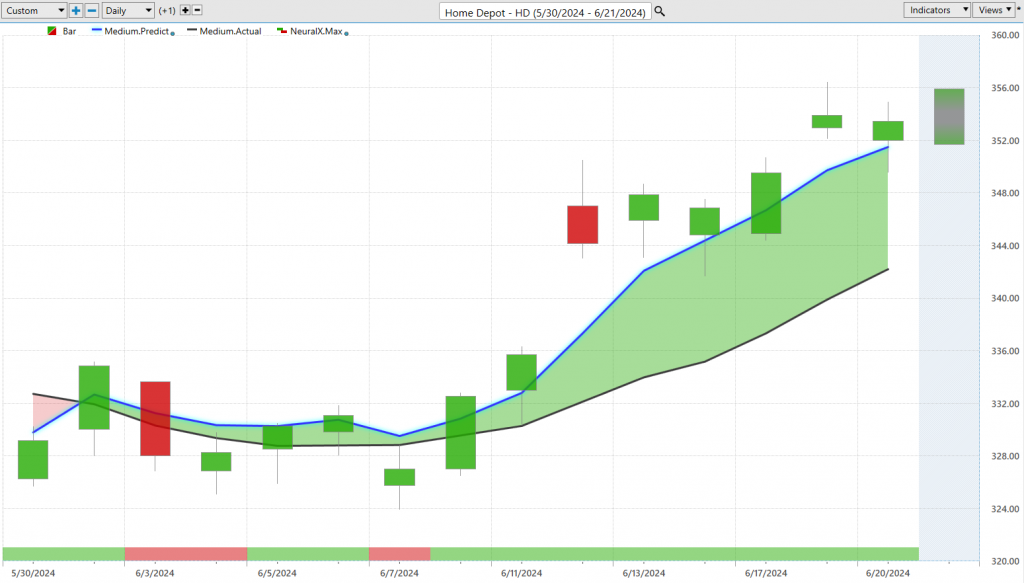
Another opportunity is Home Depot ($HD). Right at the end of June, we start seeing this blue line cross above the black line. Traders can use features like Vantage Point and Telescan, which create a grid that allows you to search via these predictive indicators. Whenever you’re looking for a new opportunity and having a daily process that helps you identify where those fresh shifts in the market are, you can pick up clues like Home Depot, which looks like a good opportunity. Again, look how many days you’re just running completely sideways. You get that neural index bearish, some weakness over these subsequent trading days, but the blue line still remains above the black line. This is where those intermarket relationships help skew that level to make sure it remains bullish and stays in that uptrend configuration. We’ve seen a little pop in shares of Home Depot.
I want to highlight some opportunities outside of the big Nvidia and Him and Hers, which we looked at earlier. There are colossal moves driving up the S&P, but there are a lot of other things starting to perk up and open up new opportunities. If you’re looking for things to stick in the portfolio, trail your stops, and potentially turn into longer-term investments, you have about a 6% rally over the past 14 trading days, which are really nice entries into this market that’s trending higher.
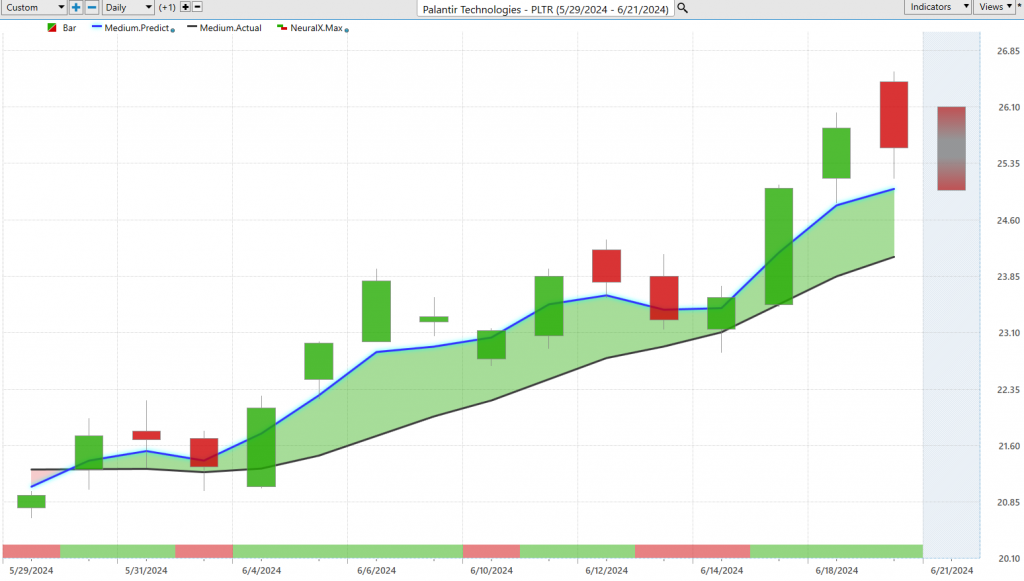
Here’s Palantir Technologies ($PLTR), another opportunity that stands a little outside of the things driving the S&P. Again, right there at the crossover towards the end of the year. Let’s look at those predicted highs and lows. Regardless of the trading style, whether you’re looking for rare crossovers and opportunities or taking it day by day for levels to accumulate a position and take some profits within a day or two, Vantage Point is helpful. With an accurate neural index, tying in the overall trend and getting in at a good price level, you’ve got the odds on your side that we’ll move up and hit a shorter-term price target. You see these nice entries at the early start of the trade. The neural index goes bullish, there’s a gap down, but the overall trend is up, and you’d want to be accumulating a position. Yesterday, look how it fills that range almost perfectly—predicted high, predicted low, fill in the range, and closing in the middle.
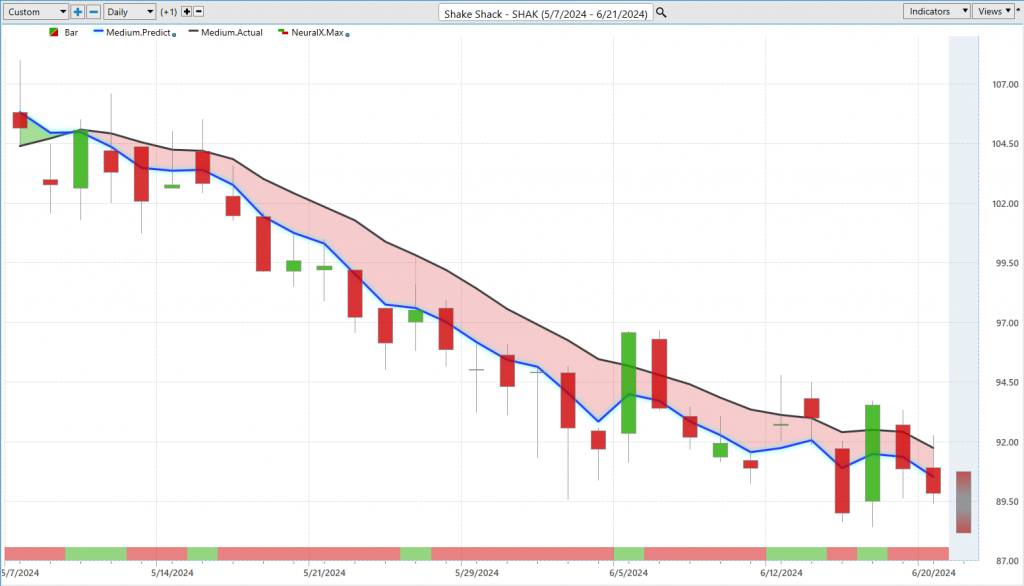
Here’s Shake Shack ($SHAK). Highlighting some of the more bearish opportunities in the market, the S&P is driven higher by a small number of stocks excited around AI, but there’s a lot of broader market stocks that aren’t performing well. Shares of Shake Shack are a good example. You see the blue line crossing below the black line, and the neural index is bullish. You get these higher highs over subsequent trading days, but notice how the blue line gets further away from the black line, indicating the overall trend is bearish. You’ll get spikes and volatility as the market goes lower, but the trend remains bearish. With these huge spikes, the market still deteriorates, not even close to a crossover into an uptrend. It’s been a substantial move to the bearish side.
Here’s your predicted highs and lows, with excellent entries at the beginning of the move and potential to add before the market trends lower.
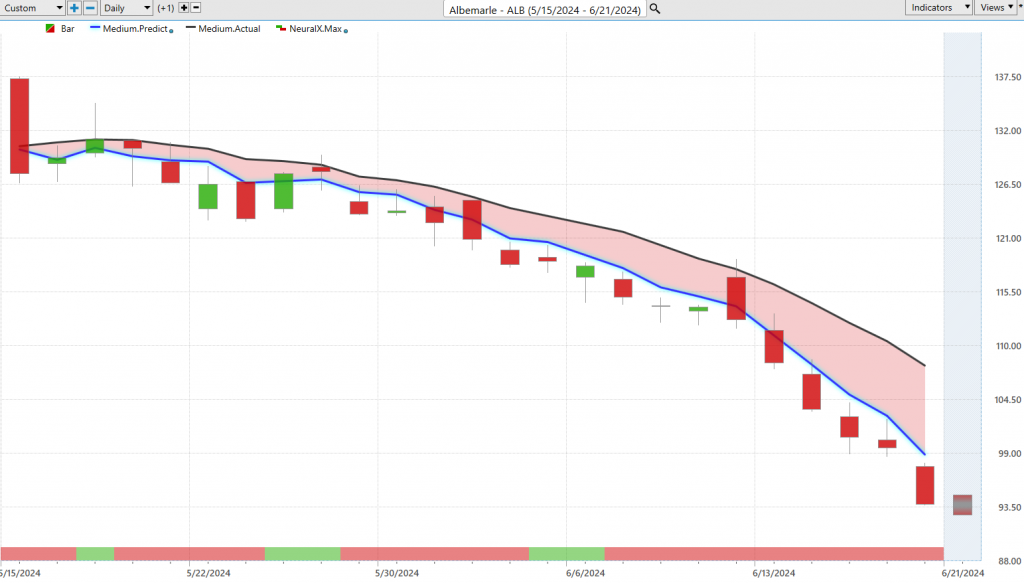
Albemarle ($ALB) is another example. Here, you see the blue line crossing below the black line, a bit of sideways price action with the neural index, but this isn’t an area to be bullish. Bullishness is short-lived, and the blue line remains distant from the black line, accelerating with bearish momentum.
Last week, we had a couple of opportunities with weakness coming in, and volatility in the S&P is kicking up. You want to be careful, have good solid positioning in the portfolio, and have nice entries. Home Depot is a nice opportunity with a cushion to deal with volatility, which we may see on the index side as bigger stocks start to rattle around.
We’ll leave it there. This has been our Hot Stocks Outlook for June 21, 2024.


