


Register for a Free Live Training
The Hot Stocks Outlook uses VantagePoint’s market forecasts that are up to 87.4% accurate, demonstrating how traders can improve their timing and direction. In this week’s video, VantagePoint Software reviews forecasts for SPDR SPY($SPY), Eli Lilly ($LLY), Intuitive Surgical ($ISRG), Tesla Motors ($TSLA), Amazon ($AMZN), O’Reilly Automotive ($ORLY)
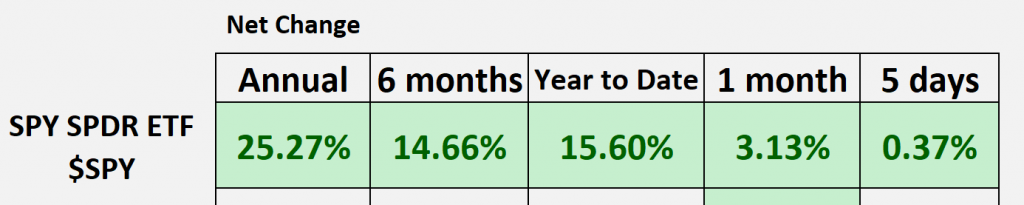
SPDR SPY ETF ($SPY)
Hello again, Traders, and welcome back to the Hot Stocks Outlook for June 28th, 2024! I hope you all are having an excellent week out there in the financial markets, and as always, we’re going to take a look at the most recent Vantage Point predictive forecast. So if you haven’t already, make sure you go ahead and click on that link in the description below, and you can sign yourself up for a live demonstration and learn all the specifics about how this predictive technology can help you make much better trading decisions in the marketplace.
Now, as we typically do, we like to take a look at the S&P 500 via the SPY ETF. One of the things we always take a look at is the year-to-date numbers. We can see we’re up about 15.5%, had a really nice year, and a lot of nice opportunities within the last 6 months. But what we’ve seen recently is things like Nvidia leading the way, running a little bit sideways, which leads to a little bit of sideways movement in the S&P 500. But there’s still a lot of great opportunities out there; the markets are holding up quite well. So, this is where you want to go ahead and look at Vantage Point and identify where the strong markets are, where we can find some nice trading opportunities.
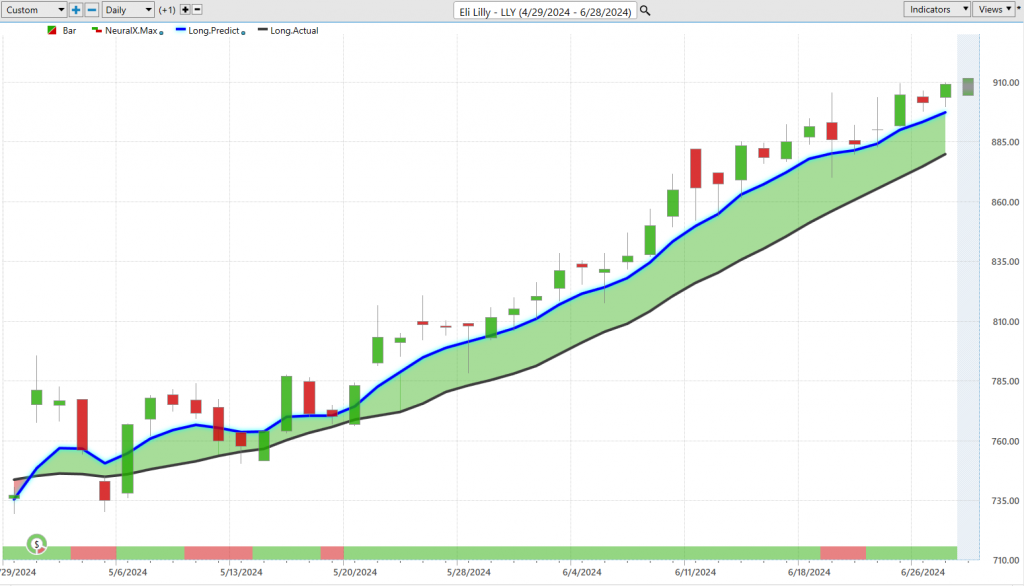
We’re going to start out here with shares of Eli Lilly ($LLY). This is a really good example of how all of these predictive indicators work together. What we’re seeing here is daily price action, right? Each one of these candles that you see represents a full and complete trading day. It’s right up against all that price data. What you’re going to notice is there’s a black line and a blue line value. The black line that you’re seeing there is a simple moving average. This is a very common technical analysis tool. In this case, it’s a 10-period simple moving average. So it looks back at the previous 10 close prices, adds them all together, and then divides by that number. One of the reasons that we use this is it acts as a good baseline, letting us know where market prices have been over a given period of time. But really, the weakness with tools like this is that all of the information comes from the past, summarizing what’s already occurred. Additionally, it’s only looking at one market in isolation. So in this case, one pharmaceutical stock, and really just plotting that price moving forward based on the most recent close.
What Vantage Point traders are able to do is really use that as a baseline and compare that to this proprietary predicted moving average. For this price to get calculated and plotted every evening, this is where the technology of Vantage Point comes in and performs what we would call intermarket analysis. Rather than just looking at past close prices and then plotting on the chart and getting dragged along, Vantage Point’s artificial intelligence, a set of neural networks, are looking at the relationships between Eli Lilly and dozens of other markets that are known to drive and influence future prices. This can be obvious things like pharmaceutical ETFs, other healthcare stocks, other individual pharmaceutical stocks. But what we need to think about is there may be positive correlations, inverse correlations, leading and lagging relationships. This goes all the way through the stock market but also includes things like currencies, interest rates, and certainly commodities when you’re looking at gold mining stocks or oil companies.
This is very important when you’re looking at what specifically allows us to have some price clues on Eli Lilly here and generate these highly accurate predictive indicators. So in this case, whenever this predicted moving average moves above the actual moving average, it’s suggesting average prices are going to start moving higher. You want to start executing those bullish trading strategies. We see here that this market is up about 18% just in the past 30 trading days, about a month’s time. But that’s not it; it’s not just that predictive moving average. Also, if you look at the very bottom of the chart, you see this bar that goes from green to red back to green. This is updated every single evening, so this would be the most recent forecast at the bottom right-hand corner of the screen. This is also utilizing that predictive technology of artificial neural networks, but they’re tuned to solve a different problem, in this case, short-term strength or weakness over the next 48 hours. What we have here is the overall trend direction. We say, okay, we know that this trend is up in Eli Lilly, and then the neural index can help you with that momentum over the next 48-hour period. What you’ll see here is that you get a little blip here, another blip here. We get some lower lows over that subsequent 48 hours, but when that neural index is bullish, that’s where we see a lot of momentum kick up into the marketplace.
This is where traders can use even intraday tools like the Vantage Point predicted high and low range. In addition to the overall trend direction and short-term strength or weakness, you’re also provided a predicted high and a predicted low. This is what we take a look at each week here and say, okay, when you have these tools available every single day, you have this information before the market even occurs. You can have limit orders just waiting down at these levels to scoop up some shares and participate. This allows traders to add to their position and take profit along the way. Here you see about 14 entries here, and you even see just a couple in the last trading week here, moving down to that predicted range and seeing a nice move really last Friday, moving into the most recent price action here, about 3.5% here.
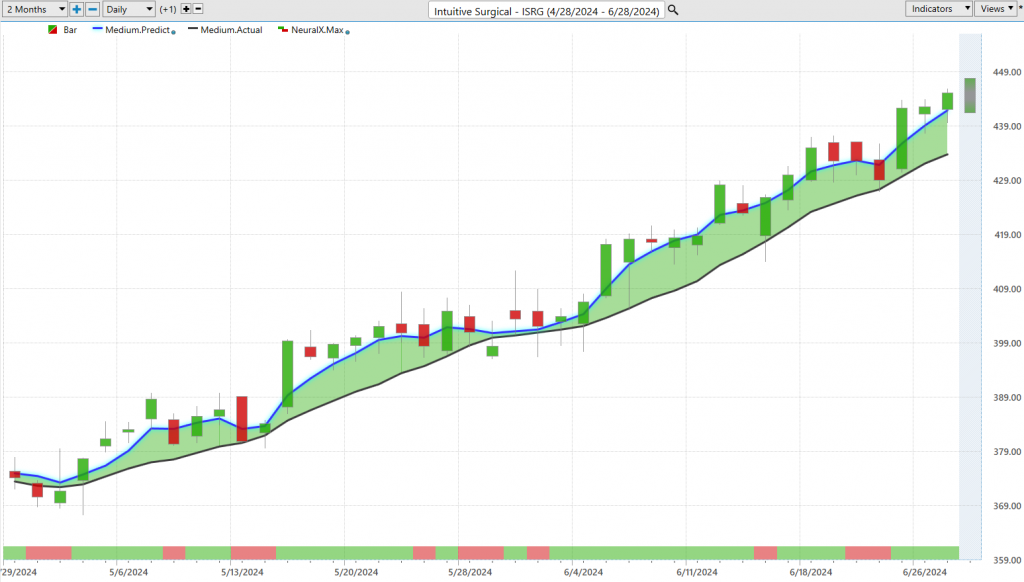
Let’s take that same understanding and apply it to Intuitive Surgical ($ISRG). We take the same approach regardless of the market, and again we see a strong crossover, blue line crossing above the black line. But you’ll notice here that look how long this market runs sideways before that trend picks up. You’ll notice that the neural index is skewing bearish, letting you know there’s short-term weakness here, but the trend has shifted, and you want to look to take bullish opportunities. Again, you see a little bit of sideways and pullback in this environment, but overall the trend is very bullish. When traders have this information combined with things like the Vantage Point predicted highs and lows, you have all the tools you need to say, okay, where should I be accumulating a position? Down at these predicted lows would make more sense. Again, you see over the past couple of weeks, really nice entries here as this market continues on its bullish trend.
Traders can use these tools to identify the strongest trends and where those fresh shifts are happening in the market. Vantage Point’s features like the Intelliscan really allow traders to fine-tune exactly what they’re looking for. If you want to see that predictive crossover as soon as it occurs or identify markets that are already in trend for potential day trading opportunities, Vantage Point is exceptional and ideal and can help you fine-tune your overall trading approaches and strategies.
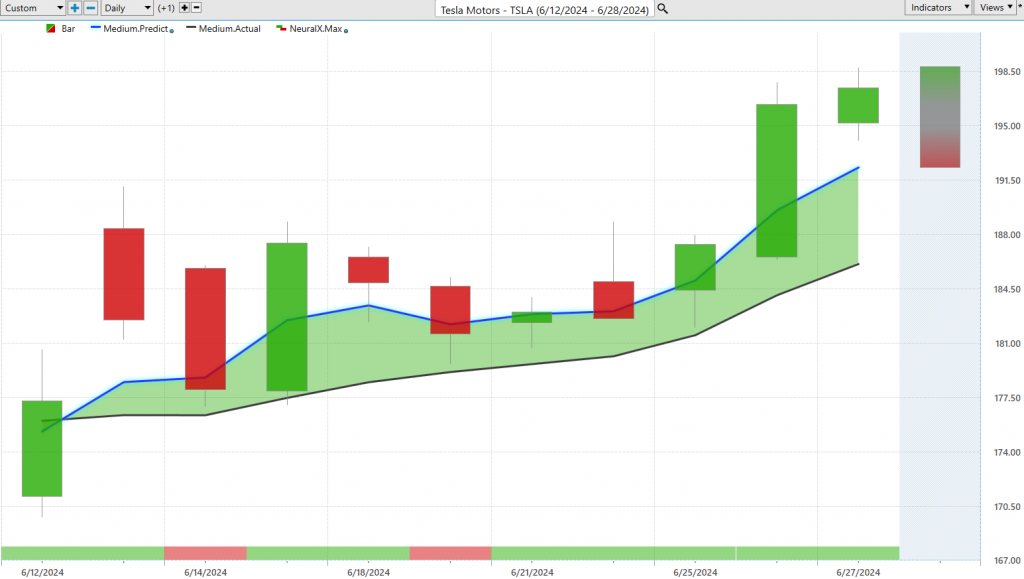
Moving forward, here we have shares of Tesla Motors ($TSLA), a very popular stock. Again, we see this blue line crossing above the black line in the last couple of weeks, indicating the overall trend is up. We have a couple of days where the neural index gets bullish, resulting in more sideways price action, but look at this most recent forecast. You got five straight days of the neural index being bullish, blue line over black line, and of course, we can look at those Vantage Point predicted highs and lows day-to-day. Just this week, here’s Monday, Tuesday, Wednesday, and now Thursday. We’ve moved much higher through the week. Just this past week, we’ve seen a nice uplift in prices, and the overall trend is moving higher, offering a nice opportunity, about a 7.7% rally.
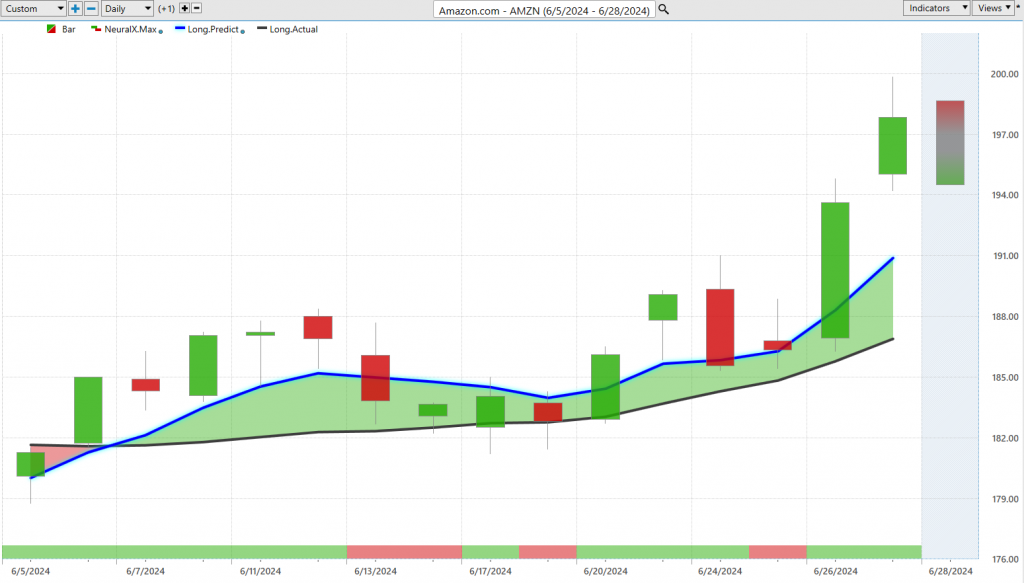
Next, shares of Amazon ($AMZN). We get this crossover last week, blue line over black line. Again this week, where are those predicted highs and lows coming in at? Just where we need them to be. Buying here on Monday, a little bit on Tuesday, and then that trend continuing higher.
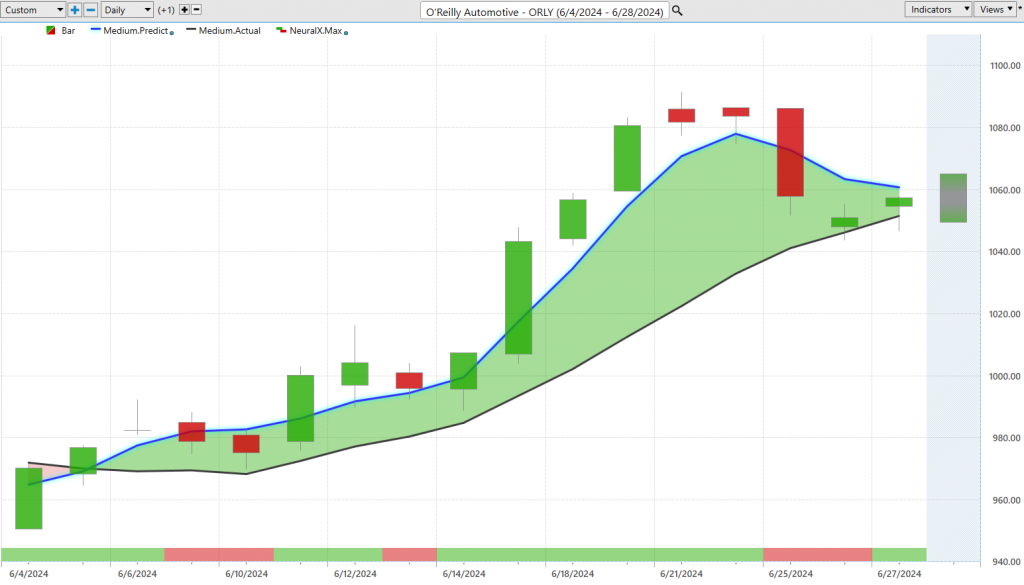
Lastly, we’ll end on O’Reilly Automotive ($ORLY). Again, a very similar example of why we want to identify these shifts early in the market. This is where the Intelliscan feature is really helpful. You can set things up so that every night you can see where the fresh shifts are occurring in the markets you’re trading. Identify them and then have those updates every single day so you can manage the opportunity. When you identify that there’s been a trend shift, you want to see where the predicted range may move. You may get these predicted low ranges, expect the range to move lower, and help manage that opportunity. After this big move, you get a little bit of volatility, but again neural index gets bullish, predicted highs and lows help with trading and identifying that the trend is up. Short-term factors are taken into account, and then those fine-tuning predicted highs and lows help fine-tune the entry. Again, a really nice move and shift higher in O’Reilly Automotive. Of course, we want to identify these things early to get that nice cushion and keep adding nice opportunities into the portfolio, about a 7.8% rally just over the past 15 trading days.
Once again, this has been our Hot Stocks Outlook for June 28th, 2024. Thank you all for watching. Best of luck out there, and bye for now!


