


Register for a Free Live Training
The Hot Stocks Outlook uses VantagePoint’s market forecasts that are up to 87.4% accurate, demonstrating how traders can improve their timing and direction. In this week’s video, VantagePoint Software reviews forecasts for SPDR SPY($SPY), Robin Hood Markets ($HOOD), Kroger ($KR), Abercrombie and Fitch ($ANF), Hims and Hers Health ($HIMS), Palantir Technologies ($PLTR)
SPDR SPY ETF ($SPY)
Hello again, Traders, and welcome back to the Hot Stocks Outlook for June 7th, 2024. I hope you are having an excellent week out there in the financial markets. As always, we’ve got plenty to cover here in our VantagePoint Hot Stocks Outlook. If you haven’t already, make sure you go ahead and click on that link down in the description below, and you can sign up for a live demo to learn all the specifics about how these Predictive Technologies can help you make much better trading decisions in the marketplace.
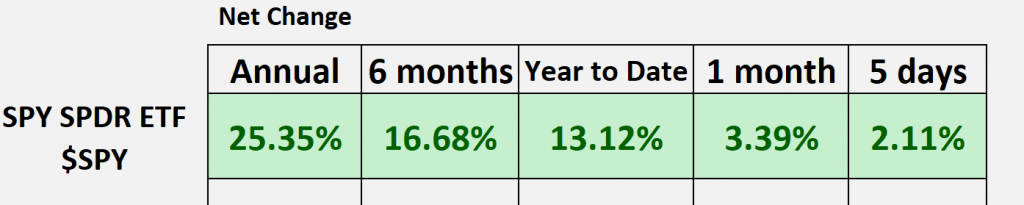
As we typically do, we like to get a broader view of the market via the SPY ETF. This ETF models the S&P 500, and we can see here that year-to-date, we are up about 133%. We had some really nice moves for the first half of the year. The past month and the last few days have done really well. What we want to do is, of course, identify where the strength in the marketplace is. This is what we do each week—identifying where those VantagePoint predictive indicators are getting decidedly bullish.
We’ll start out with Robin Hood Markets ($HOOD). Shares of Robin Hood and Him and Hers were looked at last week, so we’ll update that chart. We also have Kroger, Abercrombie, and Palantir.
Starting off with Robin Hood, this is a great example of how all of these predictive indicators work together to round out the entirety of that predictive forecast.
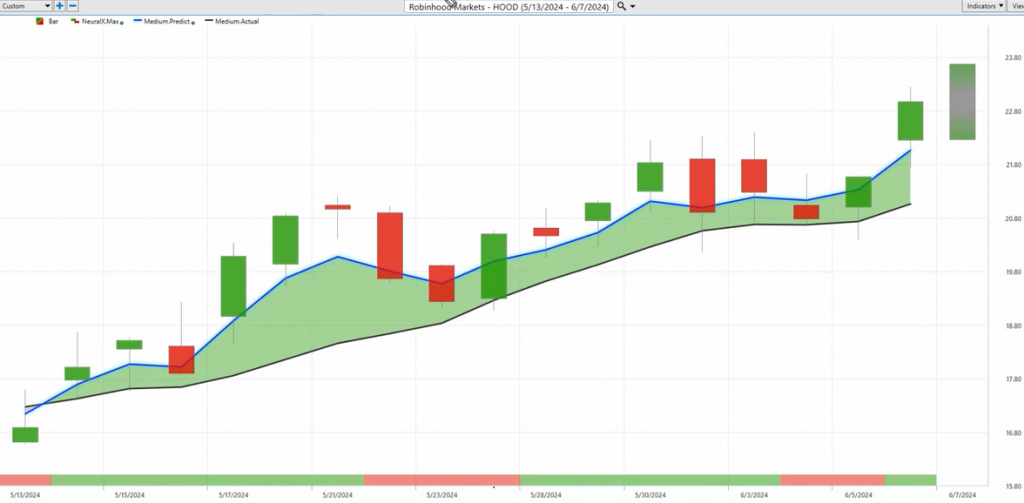
What you’re seeing on the chart here is daily price action. Each one of those candles represents a full and complete trading day, which is the actual market data. Against that market data, there is a black line value and a blue line value. The black line value is a regular simple moving average, or what we would refer to as the actual simple moving average. In this case, it’s a 10-period simple moving average. It adds the last 10 closes together and then divides by 10, smoothing out the existing price action and letting us know where the market has been. But a trader needs to be ahead of the next move in the marketplace.
So, we use that as a baseline and compare it to this blue line, which is essentially a prediction of price calculated and plotted on the chart. This is where the technology of artificial neural networks comes into play, performing what we call intermarket analysis. This is very important because Robin Hood has markets known to drive future prices. The neural networks can decipher some of these market relationships, finding dozens of relationships that affect the future price of Robin Hood. These can be things like financial ETFs, individual stocks, the value of the Dollar Index (which has a big effect on the broader stock market), global interest rates, and global commodities like gold, oil, and even agricultural commodities. It looks at all the markets relevant to the market you’re analyzing or trading and says how these intermarket relationships affect Robin Hood.
Whenever we see the blue line crossing above the black line, it indicates that prices are going to start moving up and higher, suggesting a long position. As long as that blue line is above the black line, we expect the overall trend to be to the upside. We do this every week, looking at all these indicators in the same way. We get that blue line over the black line, indicating the trend is up. We then look at how other predictive indicators work, such as the VantagePoint predicted range on the right-hand side of the chart, and the bar at the bottom that changes from green to red and back to green, which is a 48-hour indicator.
Now, once the overall trend direction is to the upside, we see about a 29% rally. The market isn’t going to go straight up; we will have periods of weakness, which in an uptrend may signify a good opportunity to buy on the dip or add to a position. You notice as the neural index goes bearish here, it forecasts short-term weakness (always looking ahead 48 hours at a time). As this neural index goes bearish, you get a couple of days of weakness, but this may indicate when to look towards your VantagePoint predicted highs and lows to get a good intraday price.
We can bring up those predictions against the actual market data to see how this works. As we get this weakness in the market, VantagePoint adapts, and you see how this predicted high and low range (forecast ahead of time for the next trading day) indicates looking down towards these predicted lows to get an entry on the bullish side, assuming the overall trend is still up (which is indicated by the blue line over the black line). You see the overall trend moves higher again, with another neural index bearish, showing some lower lows over that subsequent 48-hour price action, but offering excellent levels to add to the position.
So you see here, you got one, two, three—in this case, it’d be four, five, six, seven, eight entries. Even just this past week, you see from these entries down at this range, you’re getting a nice move. Over the past few trading days, there’s been about a 10% rally in shares of Robinhood just in the past three trading days. So, a lot of volatility here, but we want to understand where that trend started, if it’s likely to continue, and where the best places to participate on a short-term basis are.
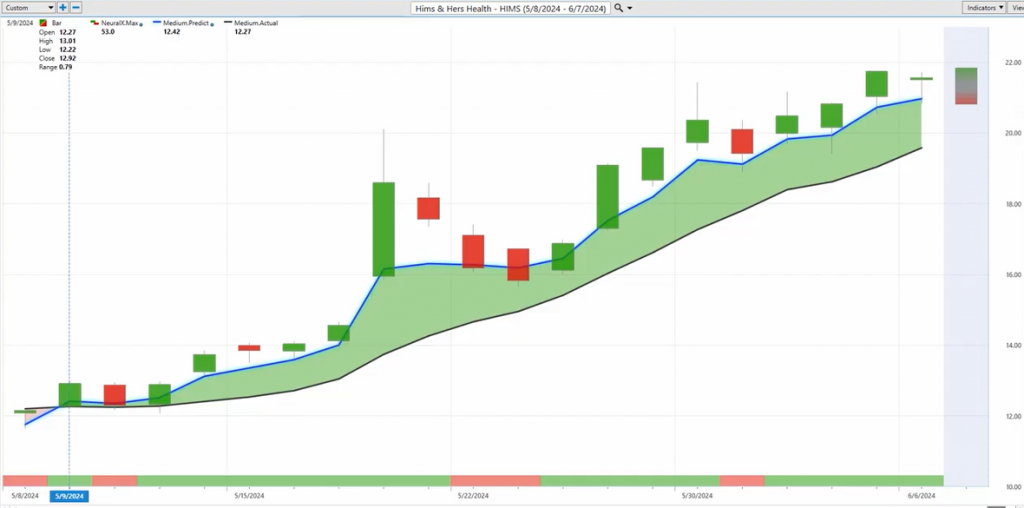
Hims & Hers Health ($HIMS) is a stock we looked at last week with Nvidia. It’s a great example of the blue line crossing above the black line, indicating that the overall trend is up. The neural index is bullish here, with a little blip going back to bullish, and you see that momentum really taking off. What I wanted to highlight here, because we already covered the previous month, is just the past few trading days. A trader who understands that this is an uptrend, with a neural index bearish, may want to look down towards predicted lows over the next 48 hours. You see it quickly gets bullish again, and those predicted levels show how a VantagePoint trader could have used these levels just this past week.
You see a potential winning trade here, a new entry here, and over the week, there’s about a 7% move from those predicted lows, particularly from Tuesday. We’re looking at Monday, Tuesday, Wednesday, Thursday. Just highlighting some of these opportunities, even yesterday, moving down to that predicted low and bouncing about 3% towards the close of the day. A lot of movement, high percentage moves, but with the right adaptive tools, you can make the most out of these trading opportunities. Shares of Hims & Hers Health are up about 72% in the past 19 trading days.
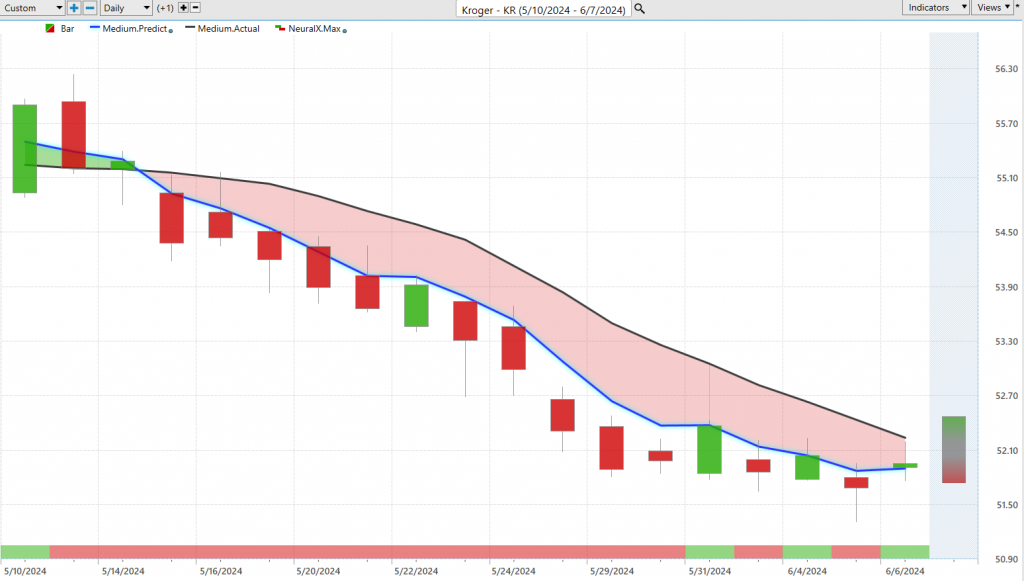
Now, let’s look at Kroger ($KR). We don’t want to get wrapped up only in bullish opportunities; we need to understand where there’s weakness and potential future opportunities. When we start to see the blue line cross above the black line, that might be a new opportunity in shares of Kroger. Currently, there’s a lot of weakness here. For the past month and a half, this isn’t an area where you want to be on the bullish side. However, if you want to hedge the portfolio and get short, you see that blue line crossing below the black line, offering better opportunities to short and take profits. This has led to a pretty nice decline, making it easy on both an individual stock and sector basis to identify where the strength in the market is. For Kroger and grocery store stocks, there’s been a 5% decline, so you might want to look at other areas of the marketplace.
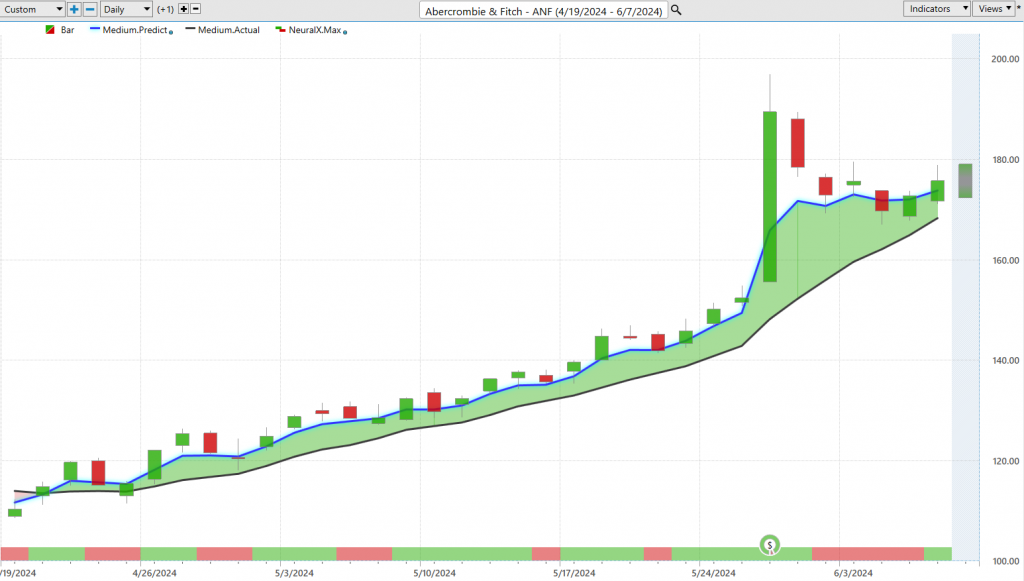
Abercrombie & Fitch ($ANF) has done extremely well. Shares of Abercrombie & Fitch show that blue line crossing above the black line, with some weaker subsequent price action, but the overall trend is very much bullish. Within that trend, looking at VantagePoint predicted highs and lows helps identify grouping of stocks to trade. Every day, you get a new level to adapt to how things have shifted and how your trading should shift. If you missed picking up on one day, you can adapt the next trading day.
For example, you see predicted lows hit, and the market moves into profit within a day or two. Depending on your trading style and time frame, you may lean on certain indicators more than others. Getting nice entries and riding the trend, locking in your stops, and understanding the overall trend is up has led to a 50% rally in the past 32 trading days. Hims & Hers and Abercrombie both saw over 50% gains in a short period.
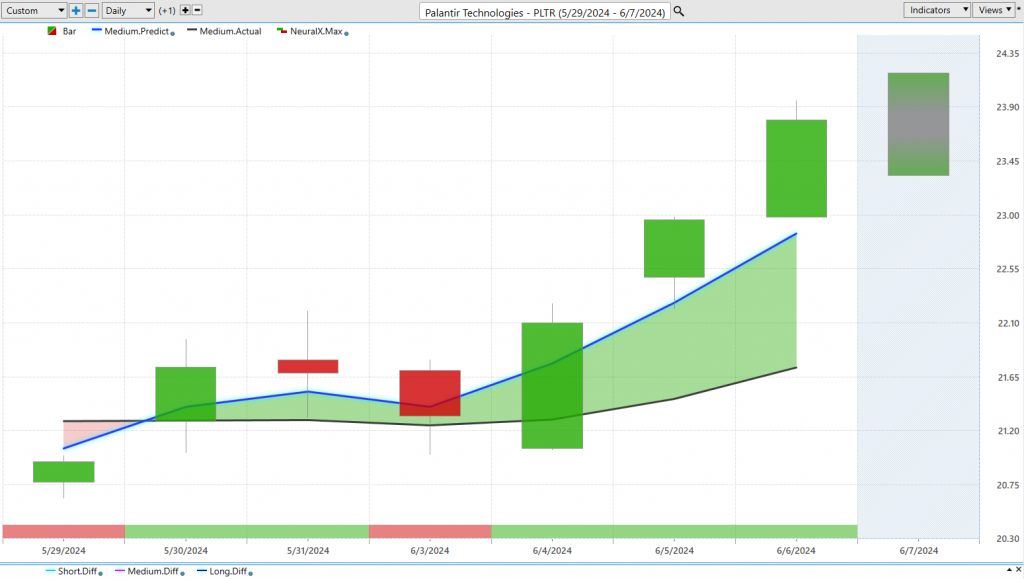
Lastly, let’s look at Palantir Technologies ($PLTR). This highlights how VantagePoint tools, like the VantagePoint Intelliscan, help identify shifts early in the marketplace. Traders can set up tools to identify where the blue line crosses above the black line, build a case around a sector, and narrow it down to an individual stock. With adaptive tools, you can see the overall trend is up, even if the neural index goes bearish and you get a gap down. The overall trend remains bullish, hitting predicted lows and quickly moving higher. Palantir saw about a 12% rally, almost 13%, in the past three trading days as strength came into the marketplace.
In summary, using the predictive forecast to adapt and understand shifting market conditions allows traders to adjust their portfolios accordingly. This has been our Hot Stocks Outlook for June 7th, 2024. Thank you all for watching. Best of luck out there, and bye for now.


