


Register for a Free Live Training
Hot Stocks Outlook uses VantagePoint’s market forecasts that are up to 87.4% accurate, demonstrating how traders can improve their timing and direction. In this week’s video, VantagePoint Software reviews forecasts for SPDR SPY($SPY), Nike ($NKE), Franco-Nevada ($FNV), Northrop Grumman ($NOC), Apple ($AAPL), Meta Platforms ($META), Amazon ($AMZN) and Home Depot ($HD)
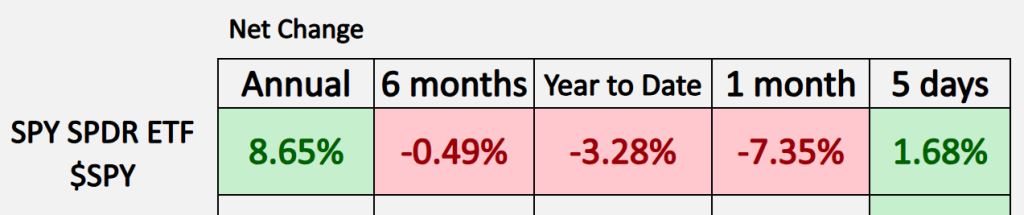
SPDR SPY ETF ($SPY)
VantagePoint A.I. Hot Stocks Outlook for March 21, 2025.
Hello again, traders, and welcome back to the Hot Stocks Outlook for March 21st, 2025. I hope you all have had an excellent week out there in the financial markets. As always, we’re here to take a look at the most recent Vantage Point AI predictive forecast. So, if you haven’t already, make sure you go ahead and click on that link down in the description below, and you can get signed up for a live demonstration, so you can learn all the specifics about how these Predictive Technologies and indicators are helping traders make much better trading decisions out in the marketplace.
Now, as we typically do, we start out by taking a look at the Spy or the S&P 500, and we typically gravitate on these two numbers: one being that year-to-date number now down 3.28%, and this really being the big one—last 30 days, shares of the Spy down 7 and a half percent or just under 7 and a half percent, and that is a very, very large move for a major index.
Nike ($NKE)
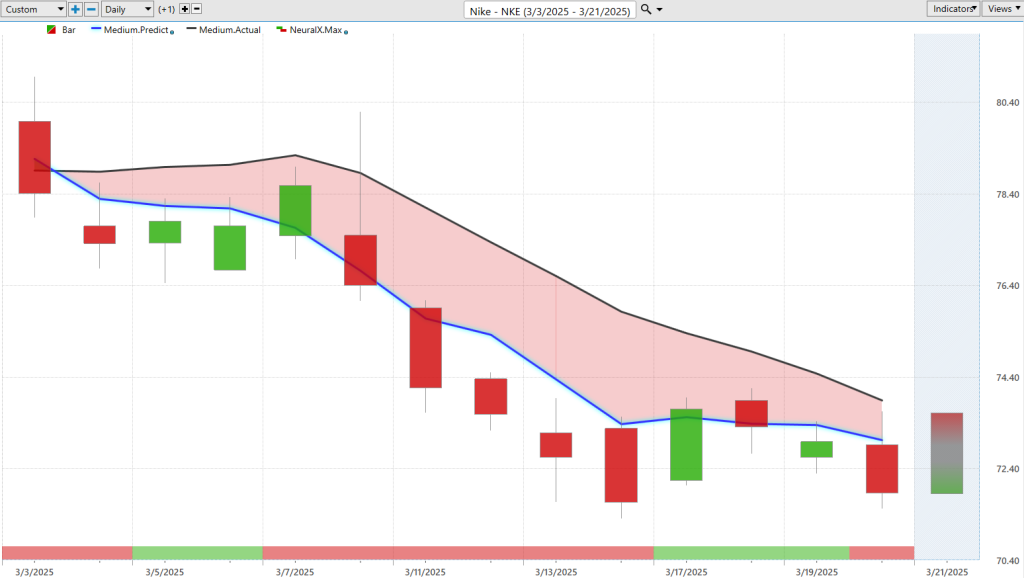
Let’s take a look at some of the predicted forecasts within Vantage Point and identify how traders can get ahead of this move, make sure they’re getting their portfolio positioned appropriately. So, this first chart here we’re going to take a look at is Nike (NKE). Everybody knows Nike, and what we have here is daily bars and candles, right? So, each candle that you’re seeing on the chart there is going to represent a full and complete trading day.
What Vantage Point Traders are able to do is compare this black and blue line value that you see right up against the price data. So, what that black line that you’re seeing there is, is actually a simple moving average. This is one of the most common traditional technical analysis tools. In this case, it’s a 10 period, so it’s going to look back at the previous 10 close prices, add them all together, and divide by 10.
A lot of traditional technical analysis like this, one of the major weaknesses is that all of that data comes from the past, right? It’s already occurred and therefore that’s always going to lag behind the market and has no predictive capability. What we’re able to do, what Vantage Point Traders are able to do, is compare that lagging moving average or we can refer to that as the actual moving average and compare that to the Vantage Point proprietary predicted moving average. For this value, which we can think of as a prediction of future prices, for that value to get calculated and then plotted on the chart every evening, well this is where the technology of artificial neural networks come into play. They’re performing what we would call intermarket analysis on shares of Nike.
So what that means is that rather than just looking at those past prices like technical analysis does, and really just summarizing what’s already occurred, Vantage points Traders are able to look at markets that are known to drive and influence the future price of Nike shares. What neural networks are great at doing is analyzing huge amounts of data and understanding the relevant relationships and then generating accurate predictions. Those data sets that are being used are all of these major market indices, potentially like the the Q’s and the Spy and IWM, but it’s even looking at other individual stocks within other sectors. They may be positively correlated, they may be inversely correlated, they may have leading or lagging relationships, and these are the types of things that artificial neural networks are designed to pick up on and are expert at. And so, it’s going to go all down the line here, if things like the Dollar Index are relevant to that market you’re trading, or things like interest rates or even potentially markets like gold or silver or copper.
This has become especially relevant as we see equity markets go down, gold prices shoot up, the dollar going lower—there’s a lot going on, and those intermarket relationships drive other markets. As we look at shares of Nike, what we see is this blue line crosses below the black line, well, it’s suggesting that these prices are going to start trending lower, and you may want to act accordingly, right? That may involve shorting, taking profits on shorts, buying put options. But here, you see shares off since that crossover down about 7.8%.
But what I want to do is go through all the nuances of this, because depending on what markets traders are trading, what your timeframe is, you could be shorter or longer term. This is where the really sweet suite of Vantage Point predictive indicators is going to help really round out that overall forecast and help traders know what to expect. Once that blue line crosses below the black line, you also notice that we have this bar at the bottom of the screen, and it goes from red to green, back to red. And this is another indicator that’s utilizing the artificial intelligence within Vantage Point, but it’s tuned to solve a different problem here.
What it’s tuned to do is just solve short-term strength or weakness over the next 48 hours, so you can think of that as really just a couple of candles into the subsequent price action, right, giving you that anticipation of short-term strength or weakness. As we look at this chart for Nike, and these subsequent charts, we’re going to see how this works where sometimes you’ll get that neural index going up to a bullish configuration, and this has an extremely high level of accuracy, upwards of 80 plus percent accuracy on a wide range of markets through Fed announcements, through interest rate changes. But what we notice is we get that short-term bounce, but notice that the overall trend—that blue line is still below the black line—therefore the overall trend is still predicted to go lower. You see we get this move, a higher high, but by the end of the day, look where we’re trading, right? Again, here you see that neural index getting bullish, but again, the bigger trend is to the downside, and if anything, you want to use that strength to short.
So, in addition to that predicted neural index, just to give you the general strength or weakness, you also have here a predicted high and low candle for the next trading day. So now we’re down to intraday predictions driven by those in-market relationships and that technology to really identify expert levels to buy, sell, limit orders, profit targets—again, this depends on your trading style and approach and what you’re trying to do here. But really great example here as we look back at how accurate are all of those predicted highs and lows. Well, when traders can understand, look, overall markets are quite bearish, well, if I want to trade Nike, what’s going on there? Well, we’re in a downtrend, might want to look up towards these predicted highs to short, or maybe time buying some put options, but definitely expressing short positions on the market, and if anything, taking profit down at these predicted lows, again in combination with your overall strategy. And something like this, you’d actually be, you know, filled right there if you have an order waiting there. So, really nice opportunities, but we are seeing a lot of weakness, and traders can use not only the forecast from one market but use features like the Vantage Point and telescan to actually see the broader markets turning lower and get a lot of clues that look, a lot of these predictive forecasts are actually skewing to the bearish side.
Franco Nevada ($FNV)
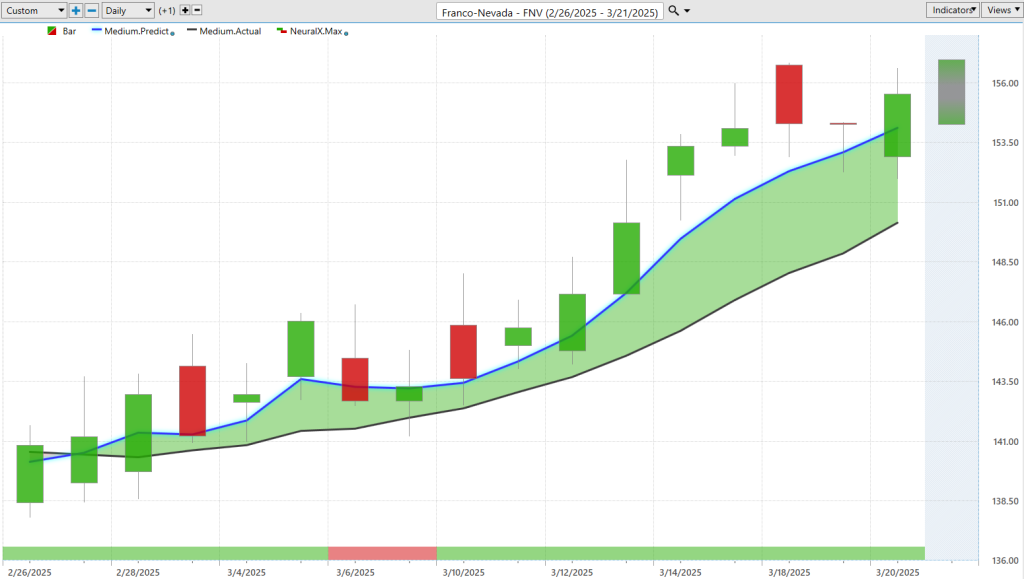
Now, we’ve talked a lot about metal markets, gold, copper, PL. Now, we cover the stocks and not the Futures Market in the Hot Stocks Outlook, but obviously, some markets are going to be driven by those metals as well. So here, we have Franco-Nevada (FNV). We looked at some other markets like Numan over the past few weeks, but here in Franco-Nevada, you see very clearly, blue line over the black line, neural index very bullish, and again, is neural index getting bearish just for a couple of days here, right? So we get through earnings, and that’s pretty much it, remains bullish through the entire route here, and you’re up, you know, another two weeks pretty much straight of advanced price action. But this is where traders can identify, well, you know, hey, do I want to be trading, you know, these big Magnificent Seven stocks? Well, you know, we’ll go ahead and take a look at that. It’s really few and far between as far as areas where we’re actually seeing some strength, where, you know, the sector broadly looks strong. So, you see multiple entries as this market starts to trend higher from those Vantage Point predicted lows. The overall market, as far as that predicted moving average, we’re up over 10%
in just the past 16 trading days. But again, identifying where is there strength in the market over the past couple of weeks? Well, this is where you can focus in on and maybe build a case to go ahead and do some trading on the bullish side.
Northrop Grumman ($NOC)
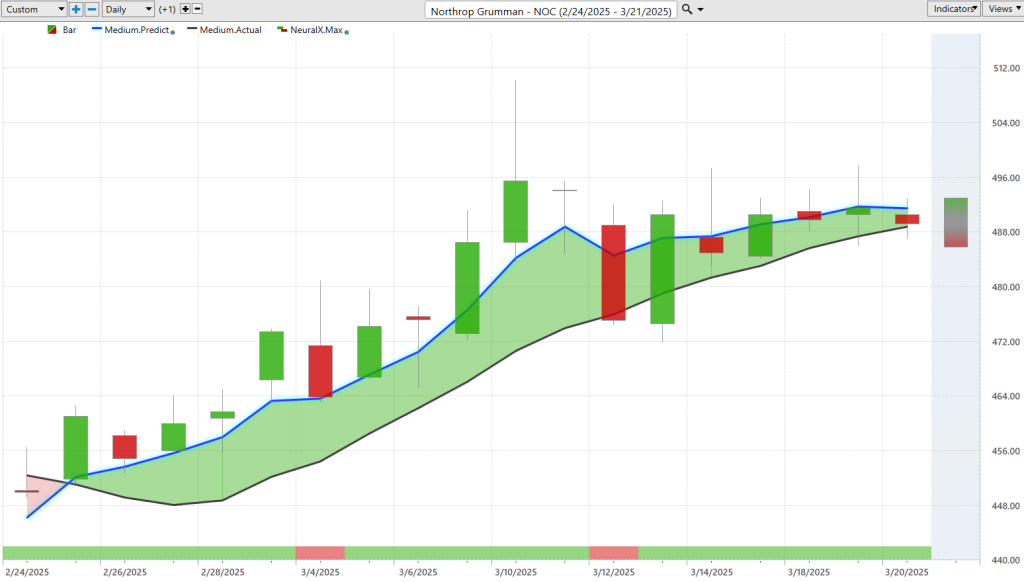
We also have Northrop Grumman (NOC), so another example of few and far between these bullish opportunities, but very clearly, where is that? You see Northrop Grumman, blue line over black line, a couple of blips here with the neural index getting bearish, and actually, I wanted to highlight here because we get these, you know, when you’re using a tool like this, from week to week, you tend to notice a lot of these situations. But here’s your predicted highs and lows, and you see it does an excellent job of picking up on these levels, and then it looks like it’s way off here, but this is actually a weekend, and that’s Friday’s predicted low, so you just had this gap up Monday. You come back into that level, and the overall trend is up, and you see we move down to these predicted lows and still trading up towards those predicted highs. So, you know, when you get a little familiar with some of the nuances of the technology, well, certainly when we start to escape and get a lot of separation, volatility can pick up, but oftentimes Vantage Point is picking up on those very important levels in the market to help traders as they manage their opportunities. So here, we have about a seven, almost 8%, advance here in the past 17 trading days.
Apple ($AAPL)
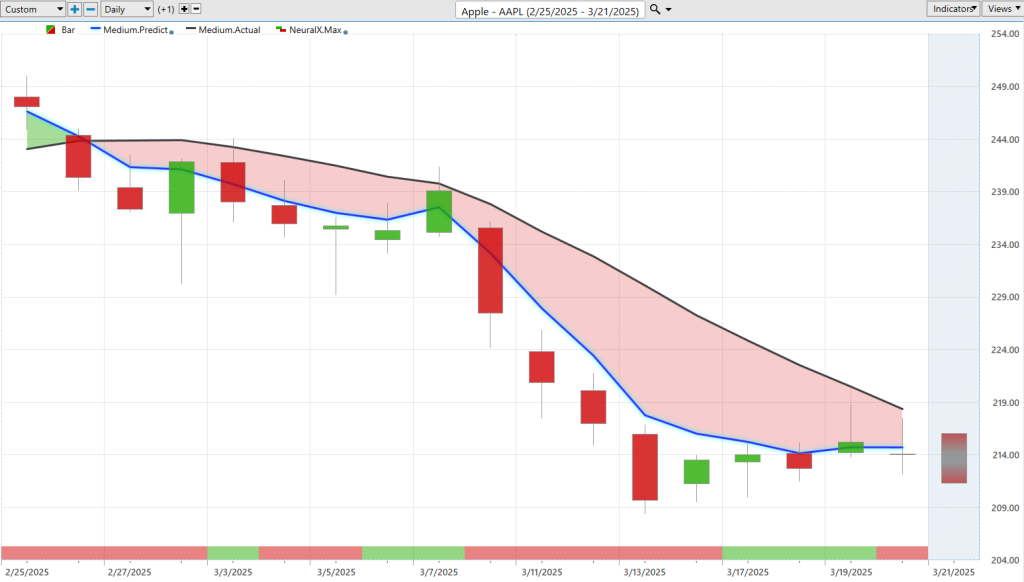
But now let’s get to the broader markets, Apple (AAPL), and this is very, very important for traders to understand because if you don’t have really the tools to get ahead of this, well, your portfolio has really probably suffered as we’ve seen that, you know, almost 8% decline in the S&P 500. Here, shares of Apple, and so here we see very clearly with that same logic and approach and understanding how these tools work, blue line below the black line, signifying we are in a downtrend, and you’ll notice again, that neural index may get bullish at times, right? But what you should really interpret that as is, you know, sideways and upward price action within the downtrend, and you see it again here, you’re getting a blip higher, where we’ve had a little bit of strength this week in the equity markets, but still, as far as that blue line and the black line here in Apple are concerned, we’re still down in downtrend here.
Meta Platforms ($META)
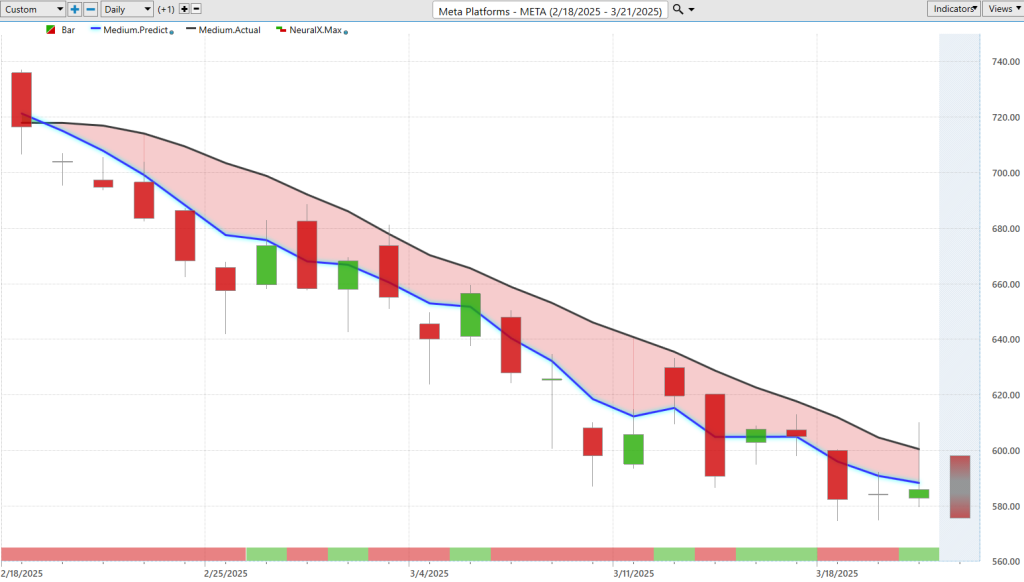
So as we look here, we can see, overall, this move, move, uh, about an 11% drop, but you know, in actuality, if we look towards these, you know, predicted highs, are getting a little bit more than that, about 11% here, from these levels, 12%, uh, and even this more recent level, you know, 11%, uh, so really nice opportunities to the downside side, you know, great opportunities to potentially, you know, hedge the portfolio, um, maybe just directly, you know, short, right, have your portfolio net short, um, and you know, when you’re seeing a lot of these forecasts, especially the major indices and shares like Meta Platforms (META), which we’ve looked, looked at week to week here, right? So we’re just coming back week to week and updating the forecast. Well, how accurate have those forecasts been since you know we first brought this through? Well, this is what traders need to understand, is that it’s all about adapting, right? Every day we’re going to get new information, Vantage Point will take in that information and then forecast its expectations moving forward. So as we look at the last couple of weeks here in Meta, well, it’s indicating that all you want to be doing is shorting, take profits on shorts, and whether you’re a, you know, longer-term swing trader or a shorter-term day trader, you know, that’s what’s going to drive the profits and, you know, get the portfolio positioned in the appropriate way to lock in stops and, um, make some money here. So, uh, the trend is still persisting to the downside; when things shift, well, we’ll shift with the market, but we had about a 17.7% decline here, uh, in just the past 22 trading days, great opportunities to, you know, short the market if you’re early on this and recognizing all this weakness that’s come in, you should be ahead on those bearish trades and able to, uh, you know, keep shorting with profits here, uh.
Amazon.com (AMZN)

Here’s Amazon.com (AMZN), very similar expectation here, blue line below the black line, neural index very bearish. You see you get these blips and some subsequent sort of gap-ups and choppy price action, but overall, the trend here is very bearish. And as we look at those intraday levels provided from Vantage Point, uh, it’s just been day after day after day, predicted highest hit, and the market within 24 to 48 hours, declining down towards those, uh, predicted low levels that Vantage Point is forecasting. So really nice move lower here, you’ve seen about, you know, a dozen entries on the bearish side as over, let’s see, the past, uh, 29 trading days, down about 16, almost 17.7% here.
Home Depot ($HD)
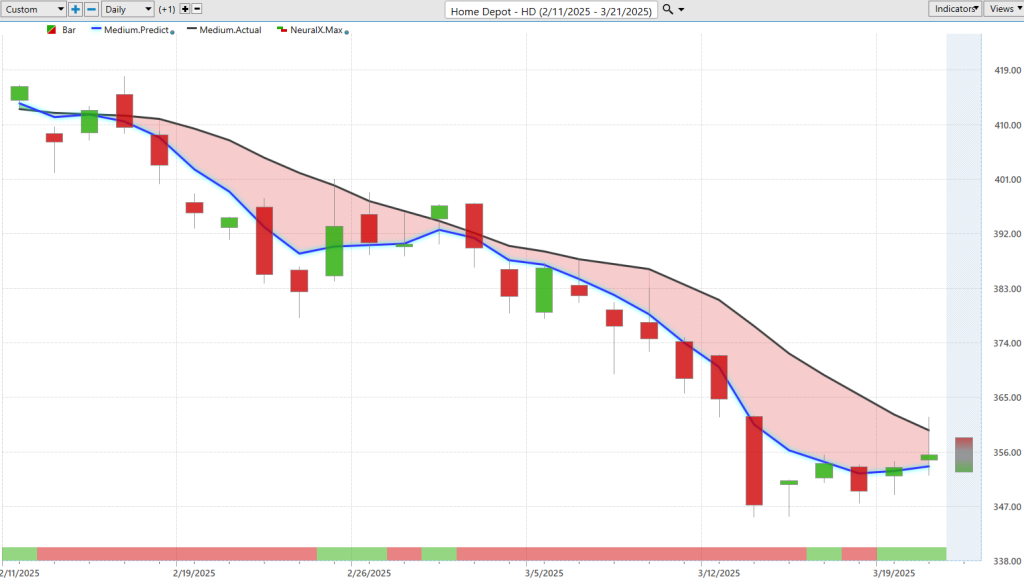
Lastly, we’ll end here on Home Depot (HD), and same story. Um, when we’re looking at these big stocks, you know, it is just very clear, um, you know, we’ve got a lot of weakness, uh, we can stay very patient and waiting on where we see those strong forecasts moving to the bullish side, but here in Home Depot, very straightforward, blue line below the black line, uh, neural index bearish. We get those blips here, this one coming in around earnings, but you see how this works is once that neural index gets bullish, you see the market run sideways, but is that blue line getting
above the black line? Are we seeing the broader market start to flip to the bullish side? Are we? You know, and so we really understand that, look, things are very bearish still, uh, and once you get that trading day there, it’s very clear that, look, you’ve got short-term momentum, the trend is down, and that’s where things really started to, uh, fall off a cliff here, uh. Now this week, we have seen some strength, but it’s strength in a very, very weak market, right? So when we look very broadly at this, when we look at Home Depot, we can see, look, we’ll take this day by day and, and, and March this forward, and if things start to shift, well, your portfolio and your behavior can shift in accordance with those predicted forecasts, um, but things are a little sketchy here still, um, and, uh, you just want to be careful.
So let’s again take a look at this, uh, move lower here in Home Depot, we’ve seen that it’s been about 25 trading days, market off about 14%. And again, these very clear, uh, forecasts here of, you know, short up at those predicted highs, and so you have all of these levels, again, remember, before each and every trading day, right? So just like coming in here, you’ve got all these levels before the trading day, can do all your analysis and really prepare very quickly and easily and efficiently, uh, for that next trading day and help identify the best opportunities.
So, uh, I’ll go ahead and leave it there, really interesting market, really great time to take a look at Vantage Point and, uh, see how you get ahead of a lot of this weakness, uh, and again, regardless of trading style or approach, you really need to know, look, what are the expectations, what are the probabilities that we’re going to have a short-term move, longer-term move, predicted highs and lows, all these things are very helpful, uh, to guide the trader moving forward. So, uh, once again, this has been our Hot Stocks Outlook for March 21st, 2025. Thank you all for watching, best of luck out there, and bye for now.


